Information about the authors
UDC 336.747+338.124 Ye. P. Gurova
STABILITY OF THE REGIONAL BANKING SYSTEMS
IN THE CRISIS AND POST
-
CRISIS PERIODS
1In connection with the recent crises has become more urgent topic of estimating the probability of bank
-ruptcy of inancial institutions. However, do not analyze the level of bankruptcies in the «regional banking systems» and its dependence on certain bank characteristics, the economic situation in the region. The sub
-ject of this study is to estimate the probability of medium-sized («non-capital») regional banks bankruptcy. Purpose of the article is to identify the main factors that have the greatest impact on the probability of default of the situation of regional banks. The study used an analytical and theoretical method is conducted econo
-metric analysis. For performance revealed a signiicant difference in the factors inluencing the onset of me
-dium-sized regional situation of default («non-capital») banks, compared with larger banks. First to assess the likelihood of bankruptcy is used the concentration index of banks included in the model and signiicant macro variables. Results are applicable, from our point of view, the evaluation and more precise deinition of the probability of default CBR regional banks.
Keywords: behavioral strategies of banks, crisis and post-crisis periods, medium-sized («non-capital») regional banks, regional banking system, the level of competition
In recent years, a growing number of studies on the development of models with maximum accu -racy in determining the forecast probability of the banks default. The need for them is conditioned to inluence, that the functioning of the bank -ing system exerted on the state and the develop -ment of the Russian economy, and to the hetero -geneity of the Russian banking system. However in the specialized literature is throwing light in -suficiently up the problem of the predication of regional banks default.
In a series of papers by the authors is high -lighted the concept of «regional banking sys -tem», is shown out the particular selection strate -gies of regional banks (Aleksashin, Aleskerov and others, 2012; Aleskerov, Belousova et al, 2011), out speciicity of regional banks functioning (Drobyshevskiy, Trunin, 2007; Anzoategui, Pería, Melecky, 2012 etc.). This suggests, that the main factors, that determine the risk of default, are dif -ferent for banks in dif-ferent regions. Speciicity behavior of regional banks in the crisis and post-crisis periods allows do identify features of their functioning, select a combination of factors, the is most important in a situation of bankruptcy.
Should pay attention to one of the articles of F. T. Alesgerov et al. [2], which is devoted to mod -eling «patterns» (term of F. T. Aleskerov) of banks behavior. There are important, that patterns of be -havior, called optimal for the banking sector (pat -terns № 1, 2, 3), is characterized mainly regional banks outside the Central Federal District. So, ad -here to the pattern №1 «banks hundreds of sec -ond and third, enough big players in the regional inancial markets, but do not have suficient re -sources for the maintenance and development of the branch network, their activities are largely concentrated in one of the «non-capital» regions of Russia» [2]. Among the banks that stable pat -tern №2, is marked Pervomajskij bank, «a very large bank, whose main activity is concentrated in the regions» [ibid.] In the group of unstable banks, constantly changing its pattern, «are included small banks (fourth hundred and beyond), whose main activity is concentrated in the regions» [ibid.] Moreover, in our view, should pay attention to the fact that, despite the «abnormality» of the pattern №4 , the failures (the defaults) of banks in these regions can’t be called common. Thus, the logical conclusion is that the «abnormal» be -havior, despite the high risk, you may have rea -son to regional conditions. It appears that it is the desire to adapt to the changing economic condi -tions of the region, maintaining competitiveness in a growing number of branches of large banks of other regions.
Importantly, from our perspective, a num -ber of studies that F. T. Aleskerov, V. M. Solodkov, V. Y. Belousova and others [1,2,3,4,5] in evaluat -ing the performance of the bank account of its re -gional presence by incorporating macroparam -eters. According to the authors, «increasing the level of inancial intermediation in the regions is costly for banks activity. However, it is observed that with an increase in cash income per cap -ita costs of banks reduced» [4, p. 29]. Thus, in the evaluation of cost-effectiveness models of Russian banks are signiicant indicators that relect the characteristics and level of socio- and economic development of regions. These studies seem to be important also in terms of estimating the proba -bility of bank failure.
Proof of concept of the difference of behavior, features activities, causes of bankruptcy for banks of different regions can also be seen in studies of Anzoategui and others (Anzoategui D., Pería M., Melecky M., 2012) about the degree of competi -tion in the regions, in the works A. M. Karminsky, A. A. Peresetsky (Karminsky 2012; Peresetsky A. A., Karminsky A.M., Golovan S.V., 2011), etc. It can be assumed that it is the speciic features of economic development in the region are caused by the small size and scale of the majority of the «non-capital» of regional banks.
It seems that it would be logical to build the following logical chain. Smaller «non-capital» banks are different from the major strategy of be -havior [8], respectively, exist by different rules. On the basis of F. T. Aleskerov et al [8] it is logical to conclude that the major banks at the moment of crisis to respond to the crisis, building a certain way trajectory behavior. After some time, it is of -ten repeated medium-sized banks. Thus, we can talk about the slow response of small banks in the crisis. In a crisis, it can mean greater stability, but there is a risk of default or default post-crisis «be -hind the curtain» of the crisis.
Economic studies have repeatedly observed greater stability of small regional banks: the fewer are the cases of defaults. From our perspective, it is quite legitimate to explain this resistance to bankruptcy level of competition in the regions. In the opinion of A. Anzoategui [17], «competition is stronger in regions where there is less concentra -tion of banks, mostly represented by branches of banks and a strong inancial and/or economic de -velopment». This statement explains also appears different concentrations of defaults in the differ -ent regions.
period 2008–2010 among the most failed banks registered in these regions.
The sample represented 146 operating banks and 18 bankrupt banks. Most of the sample, mostly medium-sized banks, characterized by low balance and net proit, often negative (to a greater extent, it is typical for the data for 2009–2010), suficient frequency during recessions and proit growth , decline and increase in liquid assets1.
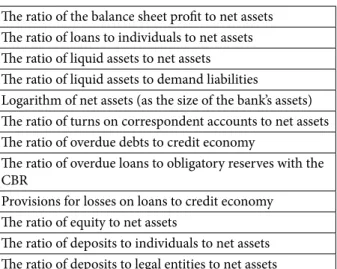
For the analysis of quarterly data taken as a num -ber of studies (Karminsky 2012; Peresetsky A. A., Karminsky A. M., Golovan S. V., 2011) proves the high eficiency of their use. Financial indicators of the bank allocated in accordance with the proce -dure CAMEL. Of indicators after correlation anal -ysis is presented in Table 1.
As repeatedly noted greater accuracy and greater predictive power of the model logit, is used to analyze the probability of bankruptcy regional banks these models. Checking the assumptions we made above about the features of the functioning of medium-sized regional banks, we construct a model of the original logit for the totality of the banks in the sample, including additional dummy variable «region», indicating the geographical lo -cation of the head ofice of the bank. Enabling this variable will determine how the operation within a speciic region potentially affects the probability of bank failure, as well as how much the frequency of bankruptcy in a given region. So it is taking the value «1» means that the bank operates in the Volga Federal District, «0» — in the Urals Federal District. The dependent variable is the «default», receiving a «1» if the bank’s license revoked or liq
-1 www.cbr.ru; Overview of the Russian Banking Sector (online version) — 2008–2010. [El. resource]. access mode: http://www. cbr.ru/archive/Default.aspx.
uidated during the period from 2008 to 2010, and «0» if the bank is valid.
Logical to analyze the results of regressions with different levels of lag (4 and 6 quarter). Thus, we can assess the situation immediately after the onset of the inancial crisis and closer to its end. The choice of lag implemented within eight quar -ters, since comparison of the quality of models shows that this value is optimal lag.
On the basis of Table 2 we can conclude that the model describes 40–51 % of the sample, the accuracy is satisfactory. This result indicates that the choice of variables for the analysis were taken into account, not all explanatory factors. Variables are insigniicant relationship of corporate depos -its to net assets and the ratio of depos-its of indi -viduals to net assets, the ratio of loans to individ -uals to net assets.
In our view, the reason for the variable re -lationship insigniicance of individual depos -its to net assets is not clear until the end. Often it is to work with individuals mainly oriented ac -tivities «non-capital» of regional banks, however, may have high demand in the region is used not so much deposits as credit banking products, which accounts for the regularity of the result — insig -niicance of the variable. In general, this result can also be explained by all the explanatory fac -tors unaccounted for and, as a consequence, low idelity model.
Should pay attention to the signiicance of the dummy variable included a speciic region — «PFD». Negative sign of the coeficient suggests that the probability of bank failures in the Volga Federal District is lower than in the UFD. This re -sult may be due to the fact that in the period from 2008 to 2010. — that is in crisis and post-crisis pe -riods — with fewer banks in the Urals is observed in almost the same number of bank failures, as in the PFD2.
In this case, the table shows the results for the entire set of samples. Comparison of the bank -ing system of the Volga and Urals federal districts through regression is not possible and is not valid, as in this case for logit models will be an unrepre -sentative sample.
In general, the results to be expected for re -gional «non-capital» of medium-sized banks. Thus, an increase of overdue loans in relation to credit the economy is strong enough effect on in -creasing the probability of default. This seems to be indirectly conirmed high-risk policies of the banks we selected regions. The same effect on the
2 he central statistical database (TSBSD). [El. resource]. access mode: http://cbsd.gks.ru.
Table 1 Indicators of inancial condition
he ratio of the balance sheet proit to net assets he ratio of loans to individuals to net assets he ratio of liquid assets to net assets he ratio of liquid assets to demand liabilities
Logarithm of net assets (as the size of the bank’s assets) he ratio of turns on correspondent accounts to net assets he ratio of overdue debts to credit economy
he ratio of overdue loans to obligatory reserves with the CBR
Provisions for losses on loans to credit economy he ratio of equity to net assets
probability of default has an excessive increase in the balance sheet proit in relation to net assets. Increase in the ratio of balance sheet proit to net assets indicates that the bank is playing a risky policy that naturally indicates a high likelihood of default. This result is conirmed by the fact that the most frequent reason for the withdrawal of li -censes of banks selected regions is the riskiness of the bank’s policy orientation almost exclusively on increasing income. It is interesting that in sur -veys reviewed the probability of bank failure, indi -cated otherwise inluence this indicator. Thus, we can conclude that the effect of the ratio of balance sheet proit to net assets to increase the proba -bility of default is typical for «non-capital» medi -um-sized regional banks.
Signiicantly reduces the probability of default increase in the ratio of reserves for possible losses to credit economy. The growth of capital adequacy in the normal range reduces the probability of de -fault of a regional bank.
Naturally, in our view, to increase the proba -bility of default, provided the growth of lending to
individuals as a crisis usually leads to a decrease in the probability of loan repayment term and there -fore increase the likelihood of default of the bank. However, you should pay attention to the fact that in models with both greater and less lag with this variable is not signiicant. Perhaps this is due to insuficient accuracy of the models.
Increasing the ratio of liquid assets to demand liabilities is not signiicant, as the ratio of liquid assets to net assets, which is quite unexpected in this case because, as a rule, are not large «non-cap -ital» regional banks inherent liquidity problems, often leading to a state of default and are also quite frequent cause of withdrawal. Nevertheless, this result could also be due to the rarity «deposi -tors raids» on the banks surveyed regions.
The results of the econometric analysis show that increasing asset size has little effect on re -ducing the probability of default of banks. This result is consistent with our expectations, as the majority of medium-sized banks in the sample.
Should pay attention to some differences in the results of the models with a lag of four quar
-Table 2 Logit model results for the entire sample with the inclusion of dummy variables by region
Model № 1 (the post-crisis period — 4 quarter lag)
Model № 2 (the crisis period — 6 quarter lag) Variable Coeicient Probability Variable Coeicient Probability
region –1.57 0.00 region –1.65 0.00
he ratio of the balance sheet
proit to net assets (–4) 31.73 0.00
he ratio of the balance sheet
proit to net assets (–6) 29.11 0.01 he ratio of liquid assets to net
assets (–4) 1.10 0.49
he ratio of liquid assets to net
assets (–6) 3.18 0.18
he ratio of liquid assets to
de-mand liabilities (–4) –0.03 0.95
he ratio of liquid assets to
de-mand liabilities (–6) –0.09 0.89 Logarithm of net assets (–4) –1.17 0.00 Logarithm of net assets (–6) –1.24 0.00 he ratio of turns on
corre-spondent accounts to net as-sets (–4)
–0.13 0.15
he ratio of turns on corre-spondent accounts to net as-sets (–6)
–0.31 0.01
he ratio of overdue debts to
credit economy (–4) 35.18 0.00
he ratio of overdue debts to
credit economy (–6) 147.52 0.00
he ratio of overdue loans to obligatory reserves with the CBR (–4)
–0.29 0.00
he ratio of overdue loans to ob-ligatory reserves with the CBR (–6)
–3.02 0.00
Provisions for losses on loans to
credit economy (–4) –23.26 0.00
Provisions for losses on loans to
credit economy (–6) –27.11 0.01
he ratio of equity to net
as-sets (–4) –13.76 0.00
he ratio of equity to net
as-sets (–6) –10.45 0.01
he ratio of loans to individuals
to net assets (–4) 0.53 0.59
he ratio of loans to individuals
to net assets (–6) 1.69 0.19
he ratio of deposits to physical
person to net assets (–4) 0.029 0.98
he ratio of deposits to physical
person to net assets (–6) 0.08 0.96 he ratio of deposits to legal
en-tities to net assets (–4) –1.99 0.26
he ratio of deposits to legal
en-tities to net assets (–6) –2.85 0.29
McFadden R-squared 0.40 McFadden R-squared 0.51
ters and with a lag of six quarters. With increasing values lag model accuracy increases. Thus, when a four-quarter lag model’s accuracy is 40 %, while in six quarters lag in model accuracy increases to 51 %. In this regard, in our view, it is interesting to contrast the results obtained AM Karminsky, etc. (2012–2013). As pointed out by the authors, with increasing lag accuracy of the model, in con -trast, falls, and therefore for further consideration by the authors was «accepted lag of two quarters,» [11, p. 76].
When choosing a lag in four quarters, we move to the beginning of the post-crisis period (begin -ning in 2010). Selecting a lag of six quarters to evaluate the situation in the banking systems of the Volga and Urals federal districts in times of crisis. Importantly, in the same period a peak of defaults banks in the PFD.
In general, most of the variables show the same effect on the probability of default as models with a lag of four quarters, and with a lag of six quar -ters. Nevertheless, it should be noted that in the model with a larger quantity lag becomes signii -cant, the ratio of turns on correspondent accounts to net assets, which characterizes the banking ac -tivity and the strategic behavior of the bank’s management. Furthermore, in accordance with the calculation of marginal effects, several times greater effect in the ratio of arrears on loans to credit economy. Since both of the indicators af -fect the increase in the probability of default of banks, it is logical to conclude that the impact due to the strengthening of their analysis of the situa -tion in the crisis period. Quite rightly, in our view, would be to assume that the change in the inlu -ence of these variables in the models, in compar -ison with other indicators suggesting the bólshey signiicance for the stability of the banks surveyed
regions. In other words, perhaps these indicators during the crisis have the greatest impact on in -creasing the probability of default of banks PFD and UFD.
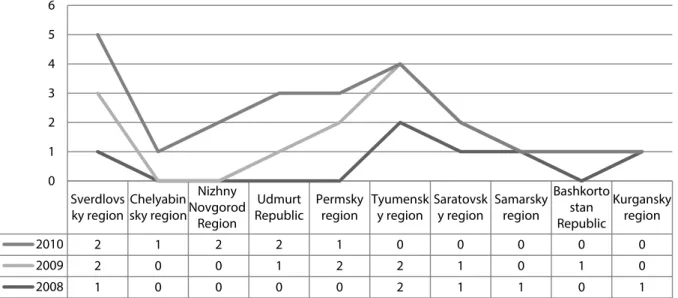
It seems that a different probability of bank failures can be not only in different regions, but also in various ields, which also marked a dif -ferent level of development of the banking sec -tor and competition in the banking system (see Figure).
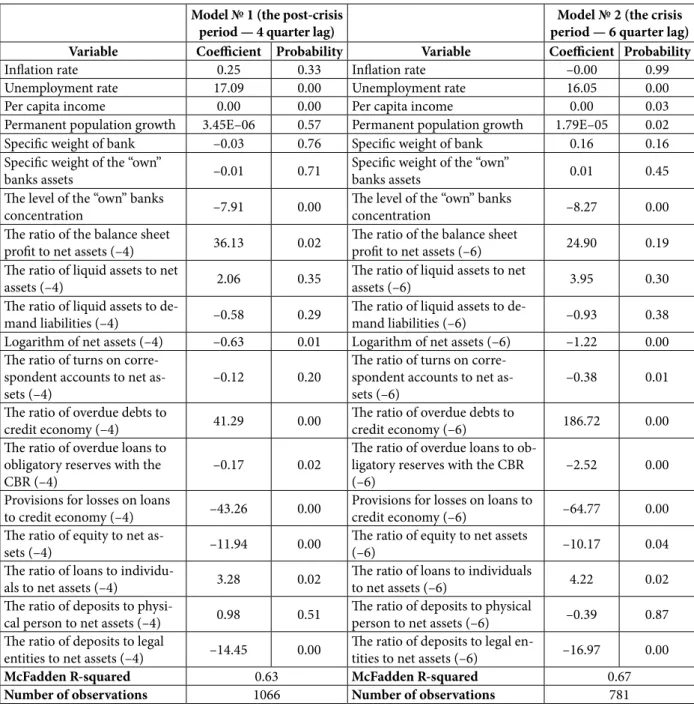
For the analysis suggested a regression with dummy variables, the areas where the most fre -quent defaults in the period under review, and analyze the results (see Table 3). In addition, for the analysis of the probability of bank failures of belonging to the region should also include macro variables: inlation, unemployment rate, per cap -ita income and the constant population growth in selected regions.
Thus, analysis of statistics shows that inlation is higher in the Volga Federal District, the dynam -ics of inlation expressed brighter than in the UFD. The unemployment rate is also higher in the PFD, compared to the UFD. Also, if there is a constant in the UFD rather stable during the period in popula -tion growth, the PFD with the same stability con -stant decline in population observed that from our point of view, can’t affect the probability of bank failure in these regions1.
It should be noted that, according to the re -sults of the regression, the highest probability of bank failure is noted in the Perm region, Nizhny Novgorod Region and the Udmurt Republic. Wave of bank failures in the Sverdlovsk and Nizhny Novgorod regions, Udmurt Republic came in 2010,
1 he central statistical database (TSBSD). [El. resource]. access mode: http://cbsd.gks.ru.
which conirms the hypothesis of the slow re -sponse of medium-sized regional banks to crisis events and a later wave of defaults. It is important that while in the Perm region there is the least number of «own» banks, compared with the rest of the treated area.
It is important for this study that the inclusion of dummy variables for regions and macro var -iables improves the accuracy of the model. The model describes 70–74 % of the data. The results obtained are adjusted somewhat as compared with the irst model.
The above statistics concentration of defaults in the selected regions, the probability of bank -ruptcy in the different areas examined seem can be explained primarily by the fact that the concen -tration of bankruptcies affect the level of compe -tition in the region. Thus, in Banks PFD concen -tration higher than in UFD and below the level of failures. We can assume that there is an inverse relationship between the level of competition in the region and the level of bankruptcies. To test this hypothesis we include indicators of the level of concentration, because the concentration level Table 3 Logit model with the inclusion of dummy variables for regions and macro variables
Model № 1 (the post-crisis period — 4 quarter lag)
Model № 2 (the crisis pe-riod — 6 quarter lag) Variable Coeicient Probability Variable Coeicient Probability
Permsky region 2.60 0.01 Permsky region 4.36 0.00
Tyumen 0.33 0.78 Tyumen 1.63 0.29
Sverdlovsky region –0.49 0.71 Sverdlovsky region 1.39 0.42
Udmurt Republic 6.38 0.00 Udmurt Republic 7.58 0.00
Chelyabinsky region 1.15 0.37 Chelyabinsky region 2.67 0.15
Nizhegorodsky region 3.57 0.00 Nizhegorodsky region 3.70 0.00
Saratovsky region –1.06 0.69 Saratovsky region 2.62 0.02
Inlation 0.42 0.14 Inlation 0.09 0.79
employment 20.62 0.00 employment 16.05 0.00
income 0.00 0.00 income 0.00 0.26
population growth 1.59E–05 0.09 population growth 3.28E–05 0.01
he ratio of the balance sheet
proit to net assets (–4) 53.13 0.00
he ratio of the balance sheet
proit to net assets (–6) 37.32 0.10 he ratio of liquid assets to net
assets (–4) 1.78 0.45
he ratio of liquid assets to net
assets (–6) 1.17 0.79
he ratio of liquid assets to
de-mand liabilities (–4) –1.66 0.01
he ratio of liquid assets to
de-mand liabilities (–6) –1.28 0.30 Logarithm of net assets (–4) –0.85 0.00 Logarithm of net assets (–6) –1.25 0.00 he ratio of turns on
corre-spondent accounts to net as-sets (–4)
–0.29 0.01
he ratio of turns on corre-spondent accounts to net as-sets (–6)
–0.53 0.00
he ratio of overdue debts to
credit economy (–4) 42.46 0.00
he ratio of overdue debts to
credit economy (–6) 205.94 0.00 he ratio of overdue loans to
obligatory reserves with the CBR (–4)
–0.17 0.03
he ratio of overdue loans to obligatory reserves with the CBR (–6)
–2.79 0.00
Provisions for losses on loans
to credit economy (–4) –45.25 0.00
Provisions for losses on loans to
credit economy (–6) –67.41 0.00 he ratio of equity to net
as-sets (–4) –12.76 0.00
he ratio of equity to net
as-sets (–6) –11.32 0.06
he ratio of loans to
individu-als to net assets (–4) 2.30 0.21
he ratio of loans to individuals
to net assets (–6) 0.28 0.91
he ratio of deposits to
physi-cal person to net assets (–4) –0.31 0.86
he ratio of deposits to physical
person to net assets (–6) –3.53 0.26 he ratio of deposits to legal
entities to net assets (–4) –20.30 0.00
he ratio of deposits to legal
en-tities to net assets (–6) –24.98 0.00
McFadden R-squared 0.70 McFadden R-squared 0.74
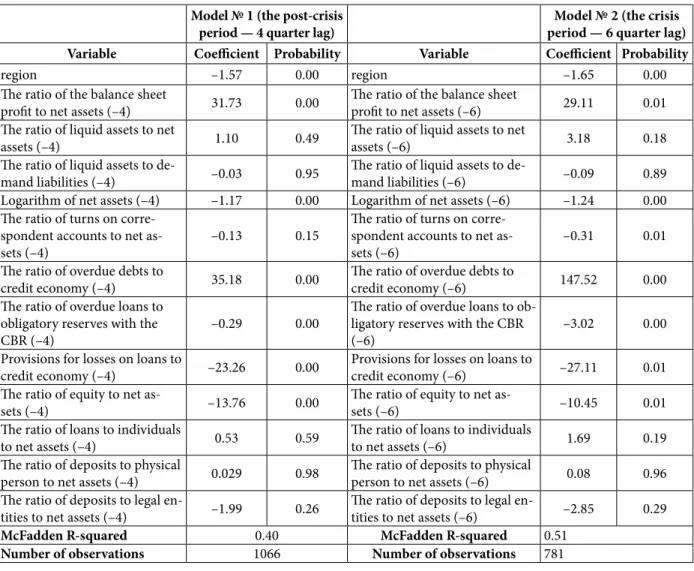
Table 4 Logit model with the inclusion of macro variables and the concentration index
Model № 1 (the post-crisis period — 4 quarter lag)
Model № 2 (the crisis period — 6 quarter lag) Variable Coeicient Probability Variable Coeicient Probability
Inlation rate 0.25 0.33 Inlation rate –0.00 0.99
Unemployment rate 17.09 0.00 Unemployment rate 16.05 0.00
Per capita income 0.00 0.00 Per capita income 0.00 0.03
Permanent population growth 3.45E–06 0.57 Permanent population growth 1.79E–05 0.02 Speciic weight of bank –0.03 0.76 Speciic weight of bank 0.16 0.16 Speciic weight of the “own”
banks assets –0.01 0.71
Speciic weight of the “own”
banks assets 0.01 0.45
he level of the “own” banks
concentration –7.91 0.00
he level of the “own” banks
concentration –8.27 0.00
he ratio of the balance sheet
proit to net assets (–4) 36.13 0.02
he ratio of the balance sheet
proit to net assets (–6) 24.90 0.19 he ratio of liquid assets to net
assets (–4) 2.06 0.35
he ratio of liquid assets to net
assets (–6) 3.95 0.30
he ratio of liquid assets to
de-mand liabilities (–4) –0.58 0.29
he ratio of liquid assets to
de-mand liabilities (–6) –0.93 0.38 Logarithm of net assets (–4) –0.63 0.01 Logarithm of net assets (–6) –1.22 0.00 he ratio of turns on
corre-spondent accounts to net as-sets (–4)
–0.12 0.20
he ratio of turns on corre-spondent accounts to net as-sets (–6)
–0.38 0.01
he ratio of overdue debts to
credit economy (–4) 41.29 0.00
he ratio of overdue debts to
credit economy (–6) 186.72 0.00
he ratio of overdue loans to obligatory reserves with the CBR (–4)
–0.17 0.02
he ratio of overdue loans to ob-ligatory reserves with the CBR (–6)
–2.52 0.00
Provisions for losses on loans
to credit economy (–4) –43.26 0.00
Provisions for losses on loans to
credit economy (–6) –64.77 0.00
he ratio of equity to net
as-sets (–4) –11.94 0.00
he ratio of equity to net assets
(–6) –10.17 0.04
he ratio of loans to
individu-als to net assets (–4) 3.28 0.02
he ratio of loans to individuals
to net assets (–6) 4.22 0.02
he ratio of deposits to
physi-cal person to net assets (–4) 0.98 0.51
he ratio of deposits to physical
person to net assets (–6) –0.39 0.87 he ratio of deposits to legal
entities to net assets (–4) –14.45 0.00
he ratio of deposits to legal
en-tities to net assets (–6) –16.97 0.00
McFadden R-squared 0.63 McFadden R-squared 0.67
Number of observations 1066 Number of observations 781
and will take into account regional belonging banks in the sample.
Model assessing the impact of the level of competition and macroeconomic indicators for the probability of bankruptcy regional banks are shown in Table 4.
The model describes 63–67 % of the sample, the accuracy is good enough. In general, the model results with the inclusion of macro variables and the concentration index practically coincide with the results of previous models considered.
However, from our perspective, we should note a signiicant difference between the results, com -pared with the irst models. In the model with a lag of four quarters insigniicant variables inla
-tion, growth of the resident population as well as the ratio of liquid assets to net assets, the rela -tionship turns on correspondent accounts to net assets, the ratio of liquid assets to demand liabil -ities, the relationship of individuals’ deposits to net assets. Signiicant, compared with the previ -ous results, the relationship variables, are loans to individuals to net assets ratio of deposits of legal entities to net assets.
may prove more persistent and committed to a particular bank. Increase in the ratio of loans to individuals to net assets increases the probability of default of banks PFD and UFD, which also cor -responds to our expectations.
The insigniicance of the variable rate of inla -tion can be explained, in our opinion, the weak -ening of the variable due to the interaction with other macro variables used. Naturally signiicant variable is the level of employment. Since most of the sample compile data on the banks of the Volga Federal District, which is characterized by the em -ployment rate is lower than in the Urals, it is log -ical that an increase in the unemployment rate in the region increases the probability of default of banks.
Characteristically, in the post-crisis period is insigniicant rate constant population growth in the region, while in the model with a lag of six quarters of this igure has little effect on increas -ing the probability of default of banks. Most likely, this result is because during the crisis increased the outlow of population that could be of some, albeit minor, risk of default of the bank.
Not quite clear is the changing nature of inlu -ence in the ratio of the balance sheet proit to net assets in the model with a lag of six quarters, com -pared to the one where the lag used in four quar -ters. In the model with a greater lag variable be -comes insigniicant. Perhaps the lack of inluence in this case, the probability of default due to the fact that during the crisis period (from mid-2009, where we move, if we take the lag 6 blocks) had no failures associated with high-risk banking pol -icies aimed at maximizing proits. This hypothesis is conirmed statistically.
It should be noted that, according to the results of econometric analysis, do not affect the proba -bility of default of two of the three indicators used concentration: the share of the bank in the region and the proportion of assets «own» the region’s banks in total banking assets in the region. The irst indicator of the above-calculated quarterly as a percentage value of the total assets of each bank’s total assets of head ofices of banks and branches, located in the region. Second value is the ratio of total assets of banks registered in the area to total head ofices of banks and branches, located in the territory of the region.
However, the concentration index is signif -icant «own» banks in these regions. Increasing the concentration index inluences to reduce the likelihood of bank failures PFD and UFD. Dany index calculated by us as the ratio of the num -ber of banks (credit institutions) registered in the region (regions, territories, and republics) to
the number of bank branches located in the same area. Its disadvantage is that it does not take into account the share of banks and branches of banks operating in the region. In this case, the study should calculate the Herindahl-Hirschman Index, that would get adjusted and more accurate results. However, data on the amount of assets of branches of credit institutions are not made pub -lic. Nevertheless, the concentration index «own» banks can also conclude on the degree of concen -tration of the banking system in the region and its direct impact on the level of bank failures in the region.
Summarizing, we can conclude that the prob -ability of default on the banks of the regional banking system affects a combination of fac -tors. Among them, one of the most important seems to the external environment, regional be -longing. Compared with the results obtained AM Karminskaya and others, the results of this study show that in the models estimating the probabil -ity of bankruptcy macro variables — unemploy -ment, the level of per capita income, growth in resident population — are signiicant. The strong -est inluence on the increase in the probability of bank failures has selected regions unemploy -ment. Insigniicant effect of a constant popula -tion growth. In addi-tion, it should be noted the ef -fect of increasing the concentration index «own» banks surveyed regions to reduce the likelihood of default. In this paper, the effect of the concen -tration index for the probability of bankruptcy «non-capital» of regional banks was reviewed for the irst time. It speciied index at the moment should be recognized the determinant in assess -ing the likelihood of bankruptcy «non-capital» of regional banks.
References
1. Alesgerov, F. T, Belousov, V. Yu, Serdyuk, M. Yu. & Solodkov, V. M. (2008). Stereotipy povedeniya rossiyskih bankov [Behavioral stereotypes of Russian Banks]. Bankovskoye delo [Banking], 7, 44-50.
2. Aleskerov, F. T, Belousova V. Yu., Solodkov, V. M. & Knurova, A. A. (2011). Stereotipy povedeniya rossiyskikh kom-mercheskikh bankov v period inansovogo krizisa [Behavioral stereotypes of Russian commercial banks during the inancial cri-sis]. XI Mezhdunarodnaya nauchnaya konferentsiya po problemam razvitiya ekonomiki i obschestva [XI International Academic Conference on Economic and Social Development]. Moscow, Publishing House, HSE, V.1, 583-593.
3. Anisimova, A. I. & Vernikov, A. V. (2011). Struktura rynka bankovskikh uslug i eyo vliyanie na konkurentsiyu (na primere dvukh rossiyskikh regionov) [he structure of the banking market and its impact on competition (on the example of two Russian regions)]. Dengi i kredit [Money and Credit], 11, 53-62.
4. Belousov, V. Y. (2011). Efektivnost izderzhek rossiyskikh bankov: faktory rosta [he cost efectiveness of Russian banks: growth factors]. Upravlenie v kreditnoy organizatsii [Management in a credit institution], 1, 72-86.
5. Belousov, V. Y. (2011). Modelirovanie granitsy efektivnosti rossiyskikh bankov po izderzhkam: voprosyi metodologii [Modeling the eiciency frontier Russian banks on costs: methodological issues]. Lizing [Leasing], 2, 23-29.
6. Vasylyuk, A. A. & Karminsky, A. M (2011). Modelirovanie kreditnykh reytingov otechestvennyikh bankov na osnove rossi-yskoy otchetnosti [Modeling credit ratings of domestic banks on the basis of Russian accounting]. Upravlenie inansovymi riskami [Financial Risk Management], 3, 194-205.
7. Vasylyuk, A., Karminskiy, V. & Sosyurko V. (2011). Sistema modeley reytingov bankov v interesakh IRB-podkhoda: sravnitelnyy i dinamicheskiy analiz: preprint WP7/2011/07 [Tekst] [System models ratings of banks in the interest of IRB-approach: a comparative and dynamic analysis: preprint WP7/2011/07 [Text]. Nat. issled. Univ “Vysshaya shkola ekonomiki” [he National Research University Higher School of Economics]. Moscow, House Higher School of Economics Publ., 68.
8. Aleksashin, P. G., Aleskerov, F. T., Belousov, V. Y., Popov, Ye. S. & Solodkov, V. M. (2012). Dinamicheskiy analiz biznes-modeley rossiyskikh bankov v period 2006–2009 gg.: preprint WP7/2012/03 [Tekst] [Dynamic analysis of business models of Russian banks in the period 2006-2009.: Preprint WP7/2012/03 [Text]. Nat. issled. Univ “Vysshaya shkola ekonomiki” [he National Research University Higher School of Economics]. Moscow, House Higher School of Economics Publ., 68.
9. Drobyshevskiy, S. M. (2011). Faktory ustoychivosti rossiyskikh bankov v 2007–2009 godakh [Resistance factors of Russian banks in 2007-2009 years]. Moscow, Inst Gaidar, 108.
10. Drobyshevskiy, S. M., Pashchenko, S. A. (2006). Analiz konkurentsii v rossiyskom bankovskom sektore. Nauchnye trudyi Instituta ekonomiki perekhodnogo perioda [Analysis of competition in the Russian banking sector. Scientiic papers of the Institute of the Economy in Transition], 96, 130.
11. Karminsky, A. M., Kostrov, A. V. & Murzenkov, T. N. (2012). Modelirovanie veroyatnosti defolta rossiyskikh bankov s ispolzovaniem ekonometricheskikh metodov : preprint WP7/2012/04 [Tekst] [Modeling probability of default of Russian banks using econometric methods: preprint WP7/2012/04 [Text] Nat. issled. Univ “Vysshaya shkola ekonomiki” [he National Research University Higher School of Economics]. Moscow, House Higher School of Economics Publ., 64.
12. Karminsky, A. M., Kostrov, A. V. (2013). Modelirovanie veroyatnosti defolta rossiyskikh bankov: rasshirennyye vozmozh-nosti [Campires Modeling the probability of default of Russian banks: advanced facilities]. Zhurnal novoy ekonomicheskoy teorii [Journal of the New Economic Association], 1 (17), 63-86.
13. Obzor bankovskogo sektora Rossiyskoy Federatsii (internet-versiya) — 2008-2010 gg. [Review of Banking Sector of the Russian Federation (online version) — 2008-2010]. Available at: http://www.cbr.ru/archive/Default.aspx
14. Peresetsky, A. A. (2010). Model causes the revocation of licenses of Russian Banks. Preprint. Moscow: Russian Economic School, 2010. 26.
15. Peresetsky, A. A. (2013) Model causes the revocation of licenses of Russian banks. Inluence factors unaccounted. Journal of Applied Econometrics, 32 (2), 49-64.
16. Tsentralnaya baza statisticheskikh dannyikh (TsBSD) [he central statistical database]. Available at: http://cbsd.gks.ru/ 17. Anzoategui, D., Pería, M. & Melecky M. (2012). Bank competition in Russia: An examination at diferent levels of aggrega-tion. Emerging Markets Review, 13,1, 52-53.
Information about the author