www.atmos-chem-phys.net/11/8965/2011/ doi:10.5194/acp-11-8965-2011
© Author(s) 2011. CC Attribution 3.0 License.
Chemistry
and Physics
Isotope effects in N
2
O photolysis from first principles
J. A. Schmidt1, M. S. Johnson1, and R. Schinke2
1Department of Chemistry, University of Copenhagen, Universitetsparken 5, 2100 Copenhagen Ø, Denmark 2Max-Planck-Institut f¨ur Dynamik und Selbstorganisation, 37073 G¨ottingen, Germany
Received: 20 May 2011 – Published in Atmos. Chem. Phys. Discuss.: 26 May 2011 Revised: 23 August 2011 – Accepted: 24 August 2011 – Published: 2 September 2011
Abstract. For the first time, accurate first principles poten-tial energy surfaces allow N2O cross sections and isotopic fractionation spectra to be derived that are in agreement with all available experimental data, extending our knowledge to a much broader range of conditions. Absorption spec-tra of rare N- and O-isotopologues (15N14N16O,14N15N16O, 15N
216O,14N172 O and14N182 O) calculated using wavepacket propagation are compared to the most abundant isotopologue (14N162 O). The fractionation constants as a function of wave-length and temperature are in excellent agreement with ex-perimental data. The study shows that excitations from the 3rd excited bending state,(0,3,0), and the first combination state,(1,1,0), are important for explaining the isotope effect at wavelengths longer than 210 nm. Only a small amount of the mass independent oxygen isotope anomaly observed in atmospheric N2O samples can be explained as arising from photolysis.
1 Introduction
Nitrous oxide, N2O, is an important atmospheric trace gas. It is a potent greenhouse gas with a global warming poten-tial 300 times greater than CO2, and is currently the domi-nant anthropogenic emission depleting ozone (Ravishankara et al., 2009). The mixing ratio of N2O has increased from 270 ppb (i.e. nmol/mol) in the preindustrial atmosphere to around 320 ppb today (Forster et al., 2007). Photolysis in the stratospheric UV window from∼195 nm to 215 nm is re-sponsible for about 90 % of the total N2O loss. The remain-ing 10 % are removed through reactions with O(1D) (Prather et al., 2001, pp. 239), which is a major source of stratospheric NO which, in turn, catalytically removes ozone.
Correspondence to:J. A. Schmidt ([email protected])
The N2O UV absorption cross section is centered at 183 nm and is Gaussian-like with superimposed structure at shorter wavelengths. Absorption in this band is caused by a transition from the electronic ground state to the first excited 1A′state (Hopper, 1984):
N2O(X1A′)+hν→N2O(21A′)→N2(X16g+)+O(1D). (R1) The first excited state (1A′) is also referred to as the A-state. The broad Gaussian-like shape is typical for direct dissocia-tion (Schinke, 1993), and the superimposed structure reflects large amplitude bending and NN stretching motion (Schinke et al., 2010; Schinke, 2011a). The dissociation dynamics lead to highly rotationally excited N2 (Kawamata et al., 2006). The produced N2is vibrationally cold at the onset of the ab-sorption cross section but becomes increasingly hotter with photon energy (Schmidt et al., 2011). The electronic tran-sition is dipole forbidden in the linear geometry and the ab-sorption cross section is relatively small for the vibrational ground state but grows with bending mode excitation. This makes the cross section quite sensitive to temperature (Sel-wyn and Johnston, 1981; Kawamata et al., 2006; Rontu Car-lon et al., 2010; Schinke, 2011a,b).
The absorption cross section (and the rate of photolysis) is therefore smaller for the heavy isotopologues on the low-energy side of the cross section. Since N2O is primarily pho-tolysed on the low energy side (atλ >195 nm) this causes the remaining pool of N2O to be enriched in heavy isotopes. Laboratory experiments (cf. Kaiser et al., 2003; von Hess-berg et al., 2004) later found photolysis to be even more en-riching than first predicted by the Yung and Miller model.
At the same time the first evidence of a small O-isotope anomaly appeared with the measurement of a 117O of about 1‰ in atmospheric N2O samples (Cliff and Thiemens, 1997). The origin of this anomaly is not well understood (McLinden et al., 2003; Liang and Yung, 2007; Kaiser and R¨ockmann, 2005). Experiments performed using Sb-lamps at room temperature found117O = 0 ‰ within experimental error and photolysis is therefore not believed to contribute to the anomaly (R¨ockmann et al., 2001b). A number of non-standard atmospheric N2O sources have been suggested (R¨ockmann et al., 2001b; McLinden et al., 2003; Kaiser et al., 2004; Kaiser and R¨ockmann, 2005; Liang and Yung, 2007), e.g. O(1D)+N2, NH2+NO2and N+NO2, which could transfer the anomaly from ozone (which contains a large O-isotope anomaly). The magnitudes of these sources are not well known. R¨ockmann et al. (2001b) estimated that the NH2+NO2reaction could, by itself, explain the anomaly if about 3 % of the global N2O originated from this reaction. This estimate was later refined by the construction of an isotope budget (Kaiser and R¨ockmann, 2005) and an atmo-spheric model (Liang and Yung, 2007) that included the dif-ferent non-standard sources. In the isotope budget by Kaiser and R¨ockmann (2005) the NH2+NO2 contribution to the global production is only about 0.5 %. Yoshida and Toyoda (2000) used the site specific15N enrichment (i.e.15N14N16O vs.14N15N16O) observed in field measurements to constrain the atmospheric N2O budget.
There have been several theoretical studies on isotopic fractionation in N2O photolysis (Johnson et al., 2001; Nanbu and Johnson, 2004; Liang et al., 2004; Prakash et al., 2005; Chen et al., 2008, 2010). The ab initio study by Daud et al. (2005) did not consider isotope effects. The isotope study by Nanbu and Johnson (2004) was the only one to be based entirely on first principles. This work together with earlier studies of Johnson et al. (2001) and Yung and Miller (1997) were helpful in understanding the main aspects of the frac-tionation. However, the comparison with experimental re-sults was less convincing.
Better agreement with experiments was obtained by Mar-cus and co-workers (Prakash et al., 2005; Chen et al., 2008, 2010). These studies were based on an approximation known as thereflection principle(Schinke, 1993, ch. 6) and the dif-fuse structure and (less important) high energy side of the cross section was not reproduced. These studies clearly il-lustrated the importance of having a reliable description of the vibrational states of the electronic ground state. The latest study by this group used an accurate semi-empirical
ground state Potential Energy Surface (PES) to obtain anhar-monic vibrational wavefunctions which could be considered nearly exact together with an ab initio excited state PES and a Transition Dipole Moment surface (TDM). Note that the semi emperical PES was based on spectroscopic experimen-tal data that are independent of the present isotopic fractiona-tion data. The calculated fracfractiona-tionafractiona-tion constants were mostly in quantitative agreement with experimental results. To ob-tain this good agreement it was necessary to shift the cross sections about 800 cm−1; the origin of this small shift was most likely inaccuracies in the excited state PES.
This is the first theoretical study, based entirely on first principles, to accurately describe all aspects of isotopic frac-tionation in N2O photolysis. No artificial broadening or shifting of the results is performed and they can therefore be considered as pure ab initio results. The results are in good agreement with the latest reflection principle based model (Chen et al., 2010) and accurately describe the iso-topic fractionation observed in broadband photolysis experi-ments (R¨ockmann et al., 2001a; Kaiser et al., 2003) and also the detailed temperature dependence observed in other ex-periments (Kaiser et al., 2002). We show that even highly excited vibrational states (e.g. the 3rd excited bending state and the first combination state) are important for understand-ing fractionation at longer wavelengths. We also find that photolysis is mass-dependent forλ >195 nm and can for the first time account for the observation that the three-isotope exponentβchanges with wavelength.
2 Calculations
2.1 Potential energy surfaces
The PESs for the ground state and the excited state,
VX and VA, were calculated using the multi-configuration reference internally contracted configuration interaction (MRCI) theory (Werner and Knowles, 1988; Knowles and Werner, 1988) based on wave functions obtained by state-averaged full-valence complete active space self consistent field (CASSCF) calculations (Werner and Knowles, 1985; Knowles and Werner, 1985). The augmented correlation consistent polarized valence quadruple zeta (aug-cc-pVQZ) basis set of Dunning Jr. (1989) was employed. The David-son correction was applied in order to approximately account for contributions of higher excitations and for size-extensive energies (Langhoff and Davidson, 1974). The correspond-ing TDM (µXA) was calculated at the same level of theory. Further details are given by Schinke (2011a). The PESs and the TDM were calculated as functions of the Jacobi coordi-natesR (distance from O to the center of mass of NN), r
The PESs and TDM are currently the most accurate ab initio surfaces available for N2O. They have an excellent track record; they were used to obtain the N2O UV ab-sorption cross section (Schinke et al., 2010; Schinke, 2011a) which, including the vibrational structure, was in good agree-ment with experiagree-ments. They were also used to investigate the temperature dependence (Schinke, 2011b) of the absorp-tion cross secabsorp-tion and the energy partiabsorp-tioning in the products (Schmidt et al., 2011) and again the agreement with experi-mental data was excellent. The overall scaling factor of∼1.4 necessary to match the absolute value of the experimental cross section in (Schinke et al., 2010; Schinke, 2011a) is of no relevance in the present study, because only ratios of cross sections are considered.
2.2 Quantum mechanical calculations
The absorption cross sections were calculated using the time-dependent approach (Schinke, 1993, ch. 4). The triatomic system was described using the Jacobi coordinates defined in Sect. 2.1. Wave packets were propagated on the A-state PES and the resulting autocorrelation functions were used to calculate the cross sections. An initial wave packet at
t=0, 8(R,r,γ;0), was defined as the product of a vibra-tional wave function of the X-state,9(v1,v2,v3), and the
mod-ulus of the TDM,µXA. The propagation was performed by expanding the propagator in Chebychev polynomials (Tal-Ezer and Kosloff, 1984). Propagation was terminated after 250 fs. The pseudospectral scheme presented by Le Qu´er´e and Leforestier (1990) was employed. In this scheme the action of the radial part, i.e. R and r, of the kinetic en-ergy operator on the wave packet is evaluated via the Fourier method (Kosloff and Kosloff, 1983), while the angular part is evaluated by transforming between a grid representation and an associated Legendre polynomial, Plm(cos(γ )), ba-sis set representation. The following grid parameters were employed: 400 and 140 equally spaced points in the inter-vals 2 a0≤R≤13.97 a0and 1.6 a0≤r≤5.77 a0respectively (where a0is the Bohr radius), and 256 angle grid points be-tweenγ=0 andγ=180◦. To prevent the wave packet from
reflection at the edge of the grid, absorbing boundaries were employed forR >10 a0andr >4.2 a0.
Calculations were performed for the vibrational ground state,(0,0,0), the first four excited bending states,(0,11,0),
(0,2,0),(0,31,0),(0,4,0), the first excited stretching states,
(1,0,0),(0,0,1), and the first combination state, (1,11,0). The vibrational wave functions of the X-state were obtained by propagating a trial wave packet in imaginary time (Kosloff and Tal-Ezer, 1986). When obtaining the excited states (ex-cept(0,11,0)) it was necessary to continuously project out components of lower energy from the trial wave packet. All calculations involving(0,0,0),(0,2,0),(0,4,0),(1,0,0)and
(0,0,1)were done using Legendre polynomials (i.e.m=0) while calculations involving(0,11,0),(0,31,0)and(1,11,0)
were done using associated Legendre polynomials withm=
150 160 170 180 190 200 210 220
0 0.5 1
λ / nm
arb. units.
(A) ArF →
Sb1 Sb2 Sb3 D2 HgXe
150 160 170 180 190 200 210 220
0 2 4 6
x 1011
λ / nm
act. flux / ph cm
-2 s -1 nm
-1
(B)
σ (298K) →
F( λ; 20 km) × 30 F( λ; 30 km)
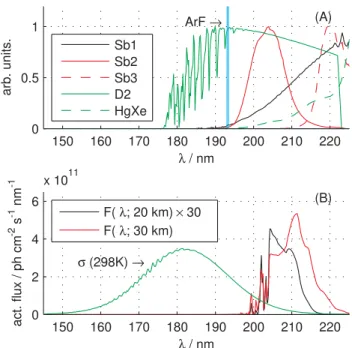
Fig. 1. Panel(A): The spectra of the various lamps used in the
broadband photolysis studies of Kaiser et al. (2002, 2003) and R¨ockmann et al. (2001a,b). “Sb1”, “Sb2” and “Sb3” refer to Sb lamp without filter, with 200 nm filter and 220 nm filter, respec-tively. The position of the ArF excimer laser line used in the latter study is also shown. Panel(B): The N2O cross section compared to
the actinic fluxF (λ)at different altitudes.
1. A modified version of theWavePacket 4.6program
package (Schmidt and Lorenz, 2009) was used to perform the quantum calculations.
2.3 Photochemical calculations
When comparing the results of this study with experimen-tal studies performed using broadband light sources, e.g. Sb-lamp or the sun, it was necessary to calculate the rate of pho-tolysis,
j=
Z
dλ σ (λ)F (λ)φ (λ), (1)
whereF (λ)is the quantity of light available for photolysis at given wavelength, e.g. the actinic flux in the case of at-mospheric photolysis. The yield of dissociation,φ (λ), is set to unity in accordance with experimental results (Simonaitis et al., 1972) and since the photodissociation process is direct (Schinke et al., 2010; Schinke, 2011a) and essentially all of the wave packet has dissociated after 250 fs.
2.3.1 Lamp spectral data
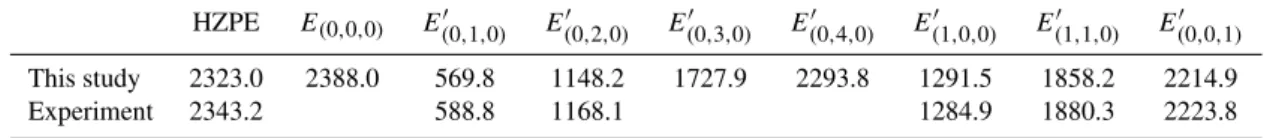
Table 1. Vibrational energies given in cm−1of14N
216O, withE′i=Ei−E(0,0,0). The experimental excitation energies are the gas phase
values cited in Łapi´nski et al. (2001) and HZPE=0.5E(′1,0,0)+E′(0,1,0)+0.5E(′0,0,1)is a harmonic estimate of the zero point energy.
HZPE E(0,0,0) E(′0,1,0) E
′
(0,2,0) E
′
(0,3,0) E
′
(0,4,0) E
′
(1,0,0) E
′
(1,1,0) E
′
(0,0,1)
This study 2323.0 2388.0 569.8 1148.2 1727.9 2293.8 1291.5 1858.2 2214.9
Experiment 2343.2 588.8 1168.1 1284.9 1880.3 2223.8
is shown in Panel a of Fig. 1. The D2lamp data is a convo-lution of the spectral radiant intensity of a D2lamp with the transmission function of a Hamamatsu silica window and the O2Schumann-Runge band (see Kaiser et al. (2003)). The Sb-lamp was used both with and without band pass inter-ference filters (Melles Griot) centered at 4 different wave-lengths; 200 nm, 207 nm, 214 nm and 220 nm. The filter functions used in this study were measured by Kaiser et al. (2003).
2.3.2 Actinic flux data
Actinic flux data at 0.1 nm resolution at various altitudes were obtained from McLinden et al. (2002) and are shown together with the N2O absorption cross section in Panel b of Fig. 1.
2.4 Isotopic fractionation
The enrichment of a given isotope, e.g.18O, is commonly (Assonov and Brenninkmeijer, 2005) quantified in terms the relative isotope ratio difference (or isotope delta) defined as,
δ18O= 18R
18R ref
−1, (2)
where18R
ref is the 18O:16O ratio in a reference, with Vi-enna Standard Mean Ocean Water (VSMOW) being a typi-cal reference for oxygen. The14N218O isotopic fractionation as function of wavelength is commonly quantified using the fractionation constant(cf. von Hessberg et al., 2004; John-son et al., 2001; Nanbu and JohnJohn-son, 2004; Prakash et al., 2005; Chen et al., 2008, 2010),
18ǫ(λ)=18σ (λ)
σ (λ) −1, (3)
whereσ (λ)and18σ (λ)are the14N216O and14N218O cross sections respectively, and analogous definitions apply for the other isotopes. The fractionation constant can also be defined for broadband photolysis (cf. Kaiser et al., 2004),
18ǫ=18j
j −1. (4)
For a first order process, like photolysis, the concentration of the reactant decays exponentially in time. The ratio of
a rare isotopologue, i.e.14N218O, to the most abundant can therefore be expressed as,
[14N218O]t
[14N216O]t
=[ 14N
218O]0 [14N216O]0
e(j−18j )t, (5)
where [X]t are the concentrations at a time t. By defin-ing the variablef as the remaining fraction of unphotolysed 14N
216O, i.e.,
f=[ 14N
216O]t
[14N216O]0
=e−j t, (6)
a simple expression for the isotope delta (δ18O) as a function off can be obtained,
δ18O= 18R
0 18Rref
!
f18ǫ−1, (7)
where18R
0is the initial isotope ratio.
Early experimental studies (Cliff and Thiemens, 1997; R¨ockmann et al., 2001b) quantified the oxygen isotope anomaly using,
117O=δ17O−0.515δ18O, (8)
while the later study of Kaiser et al. (2004) suggested using
117O∗defined as,
117O∗= 1+δ 17O
(1+δ18O)0.516−1, (9)
and also suggested using thethree-isotope exponent,
β=ln( 17ǫ+1)
ln(18ǫ+1), (10)
to determine if photolysis (or any other process) is anoma-lous. If β is either smaller than 0.50 or greater than 0.53 then the process is considered to be anomalous (Kaiser et al., 2004; Assonov and Brenninkmeijer, 2005). The isotope delta, fractionation constant, and117O are usually denoted in per mil (‰).
3 Results and comparison with experiments
Table 2. Isotopic shift in vibrational energies in cm−1. Experimental gas phase values cited in Łapi´nski et al. (2001) are given in parenthesis.
The shifts are defined as118E=E(14N216O)−E(14N218O)and118E
′
i=Ei′(14N216O)−E
′
i(14N218O)for18O and analogously for other
isotopes.
1HZPE 1E0,0,0 1E0′,1,0 1E0′,2,0 1E0′,3,0 1E′1,0,0 1E1′,1,0 1E0′,0,1 14N15N16O 38.6 (38.7) 38.0 13.5 (13.4) 23.3 (23.8) 34.4 5.3 (4.5) 20.6 44.8 (46.1) 15N14N16O 21.4 (22.0) 23.0 3.5 (3.5) 8.6 (8.1) 12.7 14.4 (15.0) 17.2 21.4 (22.2) 15N
216O 60.7 (61.2) 61.3 17.0 (16.9) 31.5 (31.6) 46.6 19.6 (19.6) 38.2 (37.9) 67.8 (69.1) 14N
217O 13.9 (14.4) 15.3 2.4 (2.4) 7.0 (6.6) 10.6 19.8 (20.2) 20.8 3.2 (3.7) 14N
218O 26.6 (27.1) 29.0 4.6 (4.6) 13.8 (13.0) 20.9 37.4 (38.0) 39.1 6.6 (7.1)
experimental values with the biggest deviation being about 20 cm−1. The calculated isotopic energy shifts are compared to experimental data in Table 2. The deviation from experi-ments is small, usually on the order a of few tenths of a cm−1. The largest deviations are seen for(0,0,1).
The cross sections for the vibrational states are shown in Panel a of Fig. 2. The overall magnitude increases with bending excitation as discussed elsewhere (Schinke, 2011a; Rontu Carlon et al., 2010; Johnson et al., 2001). The bimodal structure for(1,0,0)and(1,1,0)reflects the node of the re-spective wavefunctions along the dissociation coordinateR
(Schinke, 1993). Panel b shows the cross sections multi-plied by the Boltzmann weighting factor atT =300 K. The weighting factor for(0,0,1)is so small thatw(0,0,1)σ(0,0,1)
lies outside the range plotted in Panel b. In the impor-tant region around 210 nm the contributions to the total cross section at 300 K are 1:1:0.5:0.1:0.05:0.025:0.01 for(0,0,0),(0,1,0),(0,2,0),(0,3,0),(1,0,0),(1,1,0)and
(0,4,0)respectively. The contribution from the 3rd bending excitation is significant at room temperature; we note that ignoring this state changes the calculated broadband photol-ysis fractionation constants by up to 20 ‰. For the isotopic calculations the(0,4,0)and (0,0,1) vibrational states can be ignored because the weighted cross sections are so small. Daud et al. (2005) considered several electronically excited states and found that the absorption cross section for the
X1A′→11A′′ transition consists of two broad overlapping Gaussians peaking around 170 and 190 nm. The magnitude of theX1A′→11A′′cross section was typically 1 % or less of the magnitude of theX1A′→21A′ cross section. This suggests that the 11A′′ electronic state and the 4th excited bending state are about equally (un)important for describing the total cross section at 300 K and the 11A′′electronic state is therefore not included in this study. At 233 K the contri-butions around 210 nm go as 1:0.5:0.1:0.01:0.01:0.002: 0.0005, and a fair representation could have been obtained by only considering the ground state and the first two excited bending states.
150 160 170 180 190 200 210 220
0 1 2 3 4
x 10-19
λ / nm
σ
/ cm
2
(A) (0,4,0) →
(0,0,0) (0,1,0) (0,2,0) (0,3,0) (1,0,0) (1,1,0) (0,0,1)
150 160 170 180 190 200 210 220
10-23 10-22 10-21 10-20 10-19
λ / nm
w
σ
/ cm
2
(B)
Fig. 2. Panel(A): The N2O cross section for various initial
vi-brational states. Panel(B): Cross sections for the various initial states multiplied by the Boltzmann weighting factorwi=Q−1(1+
v2)exp(−Ei/(kBT )) withT =300 K and Q being the partition
180 190 200 210 220 -200
-150 -100 -50
0 (B)
λ / nm
ε
/ per mil
180 190 200 210 220 -100
-80 -60 -40 -20 0 20
(A)
λ / nm
ε
/ per mil
180 190 200 210 220 -250
-200 -150 -100 -50
0 (C)
λ / nm
ε
/ per mil
180 190 200 210 220 -100
-80 -60 -40 -20 0 20 40
(D)
λ / nm
ε
/ per mil
This study (284 K) This study (233 K) von Hessberg et al. (284 K) von Hessberg et al. (233 K) Selwyn and Johnston (301 K) Kaiser et al. (298 K) Zhang et al. (298 K)
..
Rockmann et al. (298 K) Turatti et al. (298 K)
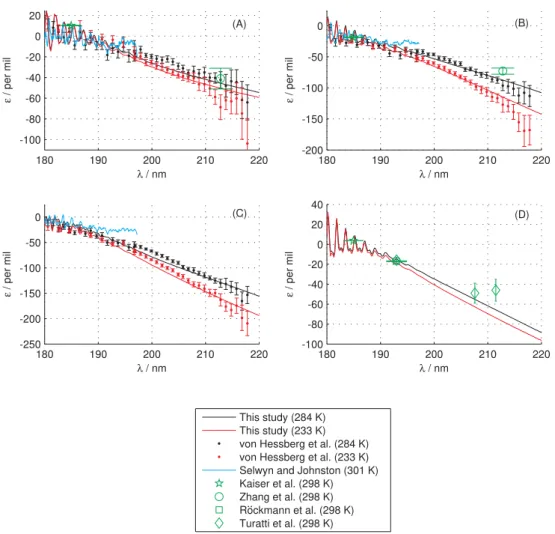
Fig. 3.The fractionation constants for15N14N16O (PanelA),14N15N16O (PanelB),15N216O (Panel C) and14N218O (Panel D) at different
temperatures compared to experimental results of von Hessberg et al. (2004), Selwyn and Johnston (1981), Kaiser et al. (2003), Zhang et al. (2000), R¨ockmann et al. (2000) and Turatti et al. (2000). The legend applies to all panels, however the results of this study in Panel d were calculated at 300 K (black) and 220 K (red).
3.1 Monochromatic photolysis
Figure 3 shows the fractionation constant as a function of wavelength compared to the spectroscopic measurements of Selwyn and Johnston (1981) and von Hessberg et al. (2004). The results of four single-wavelength photolysis experiments (Kaiser et al., 2003; Zhang et al., 2000; R¨ockmann et al., 2000; Turatti et al., 2000) are also shown. Overall, the agree-ment with experiagree-mental results is excellent. Compared to the spectroscopic results of von Hessberg et al. (2004), our results slightly underestimate the magnitude of the fraction-ation at wavelengths longer than 212 nm. However, our re-sults overestimate the magnitude of fractionation compared to single-wavelength photolysis based experimental results (Zhang et al., 2000; Turatti et al., 2000). The results of Sel-wyn and Johnston (1981) are generally believed to be inaccu-rate at longer wavelengths: the authors wrote: “at low ener-gies the isotope shift and the random experimental error are about equal”.
The N- and O-isotopic fractionation becomes increasingly negative with increasing wavelength. This behavior has been explained by several groups (Yung and Miller, 1997; Johnson et al., 2001; Nanbu and Johnson, 2004; Liang et al., 2004; Prakash et al., 2005) and arises because: (a) The heavy iso-topes of N2O have a smaller ZPE which shifts their cross sections to higher energies, making photolysis slower on the low energy side. (b) The wavefunctions of the heavy isotopes are narrower making the cross sections narrower and in turn making the rate of photolysis decrease more rapidly on the low energy side. The “narrowing” of the heavy isotope wave-functions (in particular along the bending degree of freedom) also decreases the integrated cross section and shifts the cross section to higher energies. The latter is a consequence of a growing excitation energy becauseVAincreases when going towards a linear geometry.
175 180 185 190 195 -60
-40 -20 0 20 40 60
(B)
λ / nm
ε
/ per mil
175 180 185 190 195
-60 -40 -20 0 20 40 60
(A)
λ / nm
ε
/ per mil
175 180 185 190 195
-60 -40 -20 0 20 40 60
(C)
λ / nm
ε
/ per mil
This study (301 K) v. Hessberg (284 K) Selwyn (301 K)
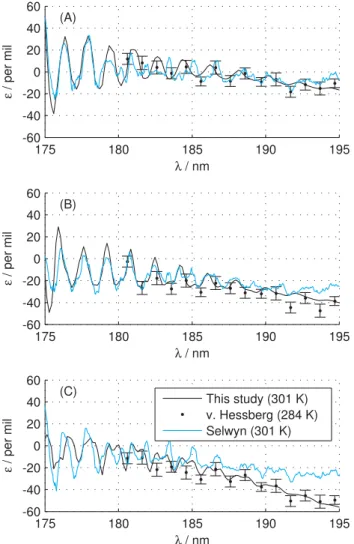
Fig. 4. The fractionation constants for 15N14N16O (Panel A),
14N15N16O (PanelB),15N
216O (Panel C) compared to
experimen-tal results of von Hessberg et al. (2004), and Selwyn and Johnston (1981). The legend in Panel C applies to all panels. A blue shift of 300 cm−1(about 1 nm) has been applied to our results in all panels of this figure.
(Johnson et al., 2001; Nanbu and Johnson, 2004; Prakash et al., 2005; Chen et al., 2008, 2010) included both effects. The temperature effects of the N- and O-isotope fractionation will be discussed below.
Figure 4 gives a more detailed view of the fractionation constants in the structured region atλ <195 nm. The struc-ture predicted by this study is slightly out of phase with the structure measured by Selwyn and Johnston (1981). The re-sults of this study can be brought in phase with experimental results by either applying a blue shift of∼1 nm or a red shift of∼0.5 nm to our results. As seen in Fig. 4 the spacing be-tween the peaks and the overall pattern is well reproduced. Results at low temperatures are not shown since both this study and the study by Selwyn and Johnston (1981) finds the fractionation constants at 301 K and 213 K to coincide almost
perfectly in the structured region. This is not surprising since photolysis in this region is dominated by transitions from the vibrational ground state (see Fig. 2) and the population of this state is not very sensitive to temperature.
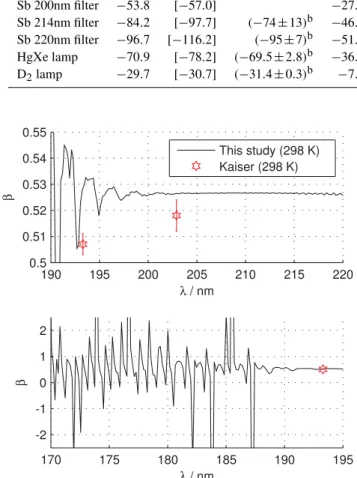
The calculated three-isotope exponent is shown in Fig. 5 and compared to available experimental data. For strato-spheric photolysis at wavelengths longer than 195 nm the calculatedβ is around 0.526 and is therefore always mass-dependent (in the sense that 0.50≤β≤0.53). Our three-isotope exponent is slightly larger than the value of 0.518 derived by Kaiser et al. (2004) for Sb-lamp photolysis, and smaller than theanomalousvalue of 0.537 obtained in the most recent reflection principle based study of Chen et al. (2010). At wavelengths shorter than 200 nm the cross sec-tions display diffuse vibrational structure due to large ampli-tude bending and NN stretching motion (Schinke et al., 2010; Schinke, 2011a), causing large oscillations in the fractiona-tion constants and the three-isotope exponent. The measured ArF laser photolysis (193.3 nm) three-isotope exponent co-incides almost perfectly with a calculated dip inβ. The cal-culated value of beta is only very slightly dependent on tem-perature, changing by a few thousandths as temperature is decreased from 300 to 220 K.
The three-dimensional chemical transport model of McLinden et al. (2003) shows that a mass-dependent source of N2O in equilibrium with an isotopically fractionating stratospheric sink will give a117O value of 0.3 ‰ forβ= 0.545 and 0.0 ‰ forβ=0.515. An interpolation for our re-sult ofβ=0.526 predicts that stratospheric photolysis will result in an oxygen isotope anomaly of 0.1 ‰ and therefore cannot by itself explain the tropospheric anomaly of ca. 1 ‰. 3.2 Broadband photolysis
Table 3 compares the calculated broadband fractionation constants with experimental data (R¨ockmann et al., 2001a; Kaiser et al., 2003). In general the agreement is good. Most of the broadband photolysis experiments were centered at long wavelengths where many excited vibrational states con-tribute to the cross section at room temperature (see Fig. 2). The contribution from relatively highly excited states like
(0,3,0) and(1,0,0) are therefore important for describing the broadband photolysis fractionation. For instance, ig-noring the 3rd excited bending (1st excited stretch) state increases the deviation between experiment and theory by up to 21 ‰ (10 ‰). The bending excitation has a larger ef-fect on14N15N16O, i.e. the centrally substituted case, while the stretching excitation is most important for describing 14N218O. The contributions from(1,0,0)and(1,1,0)to the total cross section at 300 K are comparable at 214 nm and 220 nm; as is the “isotope-effect” exemplified by the energy shift,1Ei′, which is 39.1 cm−1and 37.4 cm−1in the case of 14N
Table 3. Fractionation constants for photolysis with broadband light sources. Results obtained without including(0,3,0)and(1,1,0)are given in brackets and experimental results of R¨ockmann et al. (2001a)aand Kaiser et al. (2003)bare given in parenthesis.
456ǫ/‰ 546ǫ/‰ 18ǫ/‰
Sb lamp −57.6 [−62.2] (−51.2±1.6)a −29.0 [−29.9] (−21.4±1.1)a −43.0 [−44.1] (−33.1±1.1)a Sb 200nm filter −53.8 [−57.0] −27.6 [−28.4] −39.0 [−40.1] (−43±8)b Sb 214nm filter −84.2 [−97.7] (−74±13)b −46.0 [−48.9] (−41±7)b −72.5 [−76.5] (−52±9)b Sb 220nm filter −96.7 [−116.2] (−95±7)b −51.9 [−55.9] (−43±3)b −84.6 [−90.3] (−61±5)b HgXe lamp −70.9 [−78.2] (−69.5±2.8)b −36.8 [−38.1] (−28.1±2.1)b −56.5 [−57.8] (−46.9±1.9)b D2lamp −29.7 [−30.7] (−31.4±0.3)b −7.4 [−7.6] (−8.4±0.4)b −13.1 [−13.4] (−15.9±0.1)b
190 195 200 205 210 215 220
0.5 0.51 0.52 0.53 0.54 0.55
λ / nm
β
This study (298 K) Kaiser (298 K)
170 175 180 185 190 195
-2 -1 0 1 2
λ / nm
β
Fig. 5. The three-isotope exponent (see Eq. 10) at room
temper-ature compared to ArF (λ=193.3 nm) and Sb-lamp (λ∼202 nm) experimental results of Kaiser et al. (2004)
Figure 6 shows δ18O vs. 117O for different reaction yields. Equations (7) and (8) are used to obtainδ18O and
117O. This definition of117O was also used in the experi-mental studies of Cliff and Thiemens (1997) and R¨ockmann et al. (2001b). The Sb-lamp results of this study, despite be-ing mass-dependent in terms ofβ=0.526, yield an oxygen isotope anomaly of up to about117O = 0.6 ‰. However, lab-oratory Sb-lamp measurements of R¨ockmann et al. (2001b) found photolysis to yield117O = 0±0.2 ‰. The 0.6 ‰ de-viation between theory and experiments could be a result of small inaccuracies in the PESs or TDM. This study finds that photolysis at 193.3 nm (the ArF wavelength) yields a small positive anomaly of around117O = 0.2 ‰ atf =0.3. The experimental results show no anomaly within the error bars, but have a negative tendency due toβ=0.507<0.515 for this light source (Kaiser et al., 2004). Figure 6 also shows the
0 10 20 30 40 50 60
-0.5 0 0.5 1 1.5
δ18O / per mil
∆
17
O / per mil
Sb (298 K) This study .. Sb (298 K) Rockmann ArF (298 K) This study
.. ArF (298 K) Rockmann
Fig. 6.The evolution ofδ18O and117O as the fraction of
remain-ing reactant (f) decreases. Theδ18O and117O of this study are calculated using Eqs. (7) and (8). All lines run fromf=1.0 to 0.3 (i.e. from 0 % to 70 % conversion). The black×markf=0.6 and f=0.3 while the red×markf =0.7 andf =0.5. The exper-imental results of R¨ockmann et al. (2001b) are at about the same yield of reaction. The broken red line is monochromatic photolysis at 192.8 nm.
development ofδ18O and117O for photolysis at 192.8 nm, the λ for which β has a local minima (see Fig. 5). The result of photolysis at 192.8 nm is strikingly similar to the experimental ArF results. An inaccuracy of about 0.5 nm (134 cm−1) in the calculated PES is not unrealistic and the ArF laser line would perfectly match the “dip” in β. The difference in three-isotope exponent between the two light sources would then be due to a coincidental matching of the ArF laser frequency with the “dip” inβ due to the structure caused by large amplitude bending and NN stretching mo-tion.
3.3 Temperature dependence
180 200 220 240 260 280 300 -120
-100 -80 -60 -40 -20
T / K
ε
/ per mil
14
N14N18O
14
N15N16O
15
N14N16O
Fig. 7. The Sb-lamp fractionation constant vs. temperature. The
fractionation constants of this study are calculated using Eqs. (1) and (4). Broken and solid lines are the results of this study with and without 207 nm filter respectively, while◦and×mark the exper-imental data of Kaiser et al. (2002) also with and without 207 nm filter respectively.
2002; von Hessberg et al., 2004). The calculated temperature dependence is in good agreement with experimental obser-vations. As seen in Fig. 2 populating the excited vibrational states increases the cross section at the low energy side. The excited vibrational states of the heavy isotopes of N2O are lower in energy compared to light N2O and are therefore populated more quickly with increasing temperature, thus enhancing the low energy side of the cross section and coun-teracting the negative fractionation.
As seen in Fig. 7, our results predict that the 207 nm band-pass filter lowers the fractionation by about 5–15 ‰. How-ever the experiments find that the filter has almost no effect on the fractionation. This deviation could be a result of in-accuracies in the calculated cross sections at longer wave-lengths.
4 Conclusions
The photodissociation of N2O in the first absorption band leads to strong N- and O-isotopic fractionation. The mag-nitude of the fractionation depends on photolysis energy (wavelength) and temperature
The isotopic fractionation in N2O photolysis was studied using quantum mechanical wave packet calculations and new potential energy surfaces for the ground and the excited elec-tronic state. The results are in excellent agreement with ex-perimental data and the most recent reflection principle based model (Chen et al., 2010).
On the important low-energy side of the absorption band the isotopic fractionation increases with increasing wave-length and decreases with temperature. The former can be explained in terms of overall blue-shifting and an additional narrowing of the cross sections for the heavy isotopes, mak-ing photolysis slower for these isotopes on the low energy
side. The decrease of fractionation with temperature is due to the vibrationally excited states; UV absorption from the excited vibrational states enhances the low energy side of the cross section, increasing the rate of photolysis in this re-gion. At the same time the vibrationally excited states be-come more rapidly populated for the heavy isotopologues, thus decreasing the magnitude of the fractionation constant.
In the long wavelength region, i.e.λ >210 nm, photolysis from highly excited vibrational states such as the 3rd bending excitation or the first combination state become important. These states are significant for describing the fractionation constants around room temperature.
It is shown that the experimentally observed wavelength dependence in the three-isotope exponent,β, is due to coin-cidental matching of the ArF laser frequency with structure in the cross sections caused by large amplitude bending and NN stretching motion.
In conclusion, this study indicates that photolysis con-tributes only very little to the mass independent oxygen iso-tope anomaly observed in tropospheric N2O.
Supplementary material related to this article is available online at:
http://www.atmos-chem-phys.net/11/8965/2011/ acp-11-8965-2011-supplement.zip.
Acknowledgements. We thank Chris McLinden for providing us with the actinic flux data and Jan Kaiser for providing us with experimental data and the lamp spectral data. JAS also thanks W.-C. Chen and R. A. Marcus for useful discussions in the early and final stages of this study. We thank the IntraMIF project in the European Community’s Seventh Framework Programme (FP7/2007-1013) under grant agreement number 237890 for support.
Edited by: J. Kaiser
References
Assonov, S. S. and Brenninkmeijer, C. A. M.: Reporting small 117O values: existing definitions and concepts, Rapid Commun. Mass Spectrom., 19, 627–636, doi:10.1002/rcm.1833, 2005. Chen, W.-C., Prakash, M. K., and Marcus, R. A.: Isotopomer
fractionation in the UV photolysis of N2O: 2. Further
compar-ison of theory and experiment, J. Geophys. Res., 113, D05309, doi:10.1029/2007JD009180, 2008.
Chen, W.-C., Nanbu, S., and Marcus, R. A.: Isotopomer Fraction-ation in the UV Photolysis of N2O: 3. 3D Ab Initio Surfaces
and Anharmonic Effects, J. Phys. Chem. A, 114, 9700–9708, doi:10.1021/jp101691r, 2010.
Cliff, S. S. and Thiemens, M. H.: The18O/16O and17O/16O Ratios in Atmospheric Nitrous Oxide: A Mass-Independent Anomaly, Science, 278, 1774–1776, doi:10.1126/science.278.5344.1774, 1997.
prod-uct quantum state distributions for the low-lying electronic states of N2O, J. Chem. Phys., 122, 054305, doi:10.1063/1.1830436, 2005.
Dunning Jr., T. H.: Gaussian basis sets for use in correlated molecu-lar calculations. I. The atoms boron through neon and hydrogen, J. Chem. Phys., 90, 1007–1023, doi:10.1063/1.456153, 1989. Forster, P., Ramaswamy, V., Artaxo, P., Berntsen, T., Betts, R.,
Fa-hey, D. W., Haywood, J., Lean, J., Lowe, D. C., Myhre, G., Nganga, J., Prinn, R., Raga, G., Schulz, M., and Van Dorland, R.: Climate Change 2007: The Physical Science Basis. Con-tribution of Working Group I to the Fourth Assessment Report of the Intergovernmental Panel on Climate Change, Cambridge University Press, 2007.
Hopper, D. G.: Ab initio multiple root optimization MCSCF study of theC∞v/Cs excitation spectra and potential energy surfaces
of N2O, J. Chem. Phys., 80, 4290–4316, doi:10.1063/1.447260, 1984.
Johnson, M. S., Billing, G. D., Gruodis, A., and Janssen, M. H. M.: Photolysis of Nitrous Oxide Isotopomers Studied by Time-Dependent Hermite Propagation, J. Phys. Chem. A, 105, 8672–8680, doi:10.1021/jp011449x, 2001.
Johnston, J. C., Cliff, S. S., and Thiemens, M. H.: Measurement of multioxygen isotopic (δ18O andδ17O) fractionation factors in the stratospheric sink reactions of nitrous oxide, J. Geophys. Res., 100, 16801–16804, doi:10.1029/95JD01646, 1995. Kaiser, J. and R¨ockmann, T.: Absence of isotope exchange
in the reaction of N2O + O(1D) and the global 117O budget of nitrous oxide, Geophys. Res. Lett., 32, L15808, doi:10.1029/2005GL023199, 2005.
Kaiser, J., R¨ockmann, T., and Brenninkmeijer, C. A. M.: Temperature dependence of isotope fractionation in N2O
photolysis, Phys. Chem. Chem. Phys., 4, 4420–4430, doi:10.1039/B204837J, 2002.
Kaiser, J., R¨ockmann, T., Brenninkmeijer, C. A. M., and Crutzen, P. J.: Wavelength dependence of isotope fractionation in N2O
photolysis, Atmos. Chem. Phys., 3, 303–313, doi:10.5194/acp-3-303-2003, 2003.
Kaiser, J., R¨ockmann, T., and Brenninkmeijer, C. A. M.: Contri-bution of mass dependent fractionation to the oxygen isotope anomaly of atmospheric nitrous oxide, J. Geophys. Res., 109, D03305, doi:10.1029/2003JD004088, 2004.
Kawamata, H., , Kohguchi, H., Nishide, T., and Suzuki, T.: Pho-todissociation of nitrous oxide starting from excited bending lev-els, J. Chem. Phys., 125, 133312, doi:10.1063/1.2264362, 2006. Kim, K.-R. and Craig, H.: Nitrogen-15 and Oxygen-18 Charac-teristics of Nitrous Oxide: A Global Perspective, Science, 262, 1855–1857, doi:10.1126/science.262.5141.1855, 1993. Knowles, P. J. and Werner, H.-J.: An efficient second-order MC
SCF method for long configuration expansions, Chem. Phys. Lett., 115, 259–267, doi:10.1016/0009-2614(85)80025-7, 1985. Knowles, P. J. and Werner, H.-J.: An efficient method for the
eval-uation of coupling coefficients in configuration interaction cal-culations, Chem. Phys. Lett., 145, 514–522, doi:10.1016/0009-2614(88)87412-8, 1988.
Kosloff, D. and Kosloff, R.: A Fourier method solution for the time dependent Schr¨odinger equation as a tool in molecular dynamics, J. Comp. Phys., 52, 35–53, doi:10.1016/0021-9991(83)90015-3, 1983.
Kosloff, R. and Tal-Ezer, H.: A direct relaxation method for
calculating eigenfunctions and eigenvalues of the Schr¨odinger equation on a grid, Chem. Phys. Lett., 127, 223–230, doi:10.1016/0009-2614(86)80262-7, 1986.
Langhoff, S. R. and Davidson, E. R.: Configuration interaction cal-culations on the nitrogen molecule, J. Quantum Chem., 8, 61–72, doi:10.1002/qua.560080106, 1974.
Łapi´nski, A., Spanget-Larsen, J., Waluk, J., and Radziszewski, J. G.: Vibrations of nitrous oxide: Matrix isolation Fourier trans-form infrared spectroscopy of twelve N2O isotopomers, J. Chem. Phys., 115, 1757–1764, doi:10.1063/1.1383031, 2001.
Le Qu´er´e, F. and Leforestier, C.: Quantum exact three-dimensional study of the photodissociation of the ozone molecule, J. Chem. Phys., 92, 247–253, doi:10.1063/1.458471, 1990.
Liang, M.-C. and Yung, Y. L.: Sources of the oxygen isotopic anomaly in atmospheric N2O, J. Geophys. Res., 112, D13307,
doi:10.1029/2006JD007876, 2007.
Liang, M.-C., Blake, G. A., and Yung, Y. L.: A semianalytic model for photoinduced isotopic fractionation in simple molecules, J. Geophys. Res., 109, D10308, doi:10.1029/2004JD004539, 2004. McLinden, C. A., McConnell, J. C., Griffioen, E., and McElroy, C. T.: A vector radiative-transfer model for the Odin/OSIRIS project, Can. J. Phys., 80, 375–393, doi:10.1139/p01-156, 2002. McLinden, C. A., Prather, M. J., and Johnson, M. S.: Global mod-eling of the isotopic analogues of N2O: Stratospheric
distribu-tions, budgets, and the17O-18O mass-independent anomaly, J. Geophys. Res., 108, 4233, doi:10.1029/2002JD002560, 2003. Moore, H.: Isotopic measurement of atmospheric
nitro-gen compounds, Tellus, 26, 169–174, doi:10.1111/j.2153-3490.1974.tb01963.x, 1974.
Nanbu, S. and Johnson, M. S.: Analysis of the Ultraviolet Absorp-tion Cross SecAbsorp-tions of Six Isotopically Substituted Nitrous Oxide Species Using 3D Wave Packet Propagation, J. Phys. Chem. A, 108, 8905–8913, doi:10.1021/jp048853r, 2004.
Prakash, M. K., Weibel, J. D., and Marcus, R. A.: Iso-topomer fractionation in the UV photolysis of N2O:
Compari-son of theory and experiment, J. Geophys. Res., 110, D21315, doi:10.1029/2005JD006127, 2005.
Prather, M., Ehhalt, D., Dentener, F., Derwent, R., Dlugokencky, E., Holland, E., Isaksen, I., Katima, J., Kirchhoff, V., Matson, P., Midgley, P., and Wang, M.: Climate Change 2001: The Scientific Basis, Contribution of Working Group I to the Third Assessment Report of the Intergovernmental Panel on Climate Change, Cam-bridge University Press, 2001.
Rahn, T. and Wahlen, M.: Stable Isotope Enrichment in Stratospheric Nitrous Oxide, Science, 278, 1776–1778, doi:10.1126/science.278.5344.1776, 1997.
Ravishankara, A. R., Daniel, J. S., and Portmann, R. W.: Nitrous Oxide (N2O): The Dominant Ozone-Depleting Sub-stance Emitted in the 21st Century, Science, 326, 123–125, doi:10.1126/science.1176985, 2009.
R¨ockmann, T., Brenninkmeijer, C. A. M., Wollenhaupt, M., Crow-ley, J. N., and Crutzen, P. J.: Measurement of the isotopic frac-tionation of15N14N16O,14N15N16O and14N14N18O in the UV photolysis of nitrous oxide, Geophys. Res. Lett., 27, 1399–1402, doi:10.1029/1999GL011135, 2000.
10403–10410, doi:10.1029/2000JD900822, 2001a.
R¨ockmann, T., Kaiser, J., Crowley, J. N., Brenninkmeijer, C. A. M., and Crutzen, P. J.: The origin of the anomalous or mass indepen-dent oxygen isotope fractionation in tropospheric N2O, Geophys.
Res. Lett., 28, 503–506, doi:10.1029/2000GL012295, 2001b. Rontu Carlon, N., Papanastasiou, D. K., Fleming, E. L., Jackman,
C. H., Newman, P. A., and Burkholder, J. B.: UV absorption cross sections of nitrous oxide (N2O) and carbon tetrachloride
(CCl4) between 210 and 350 K and the atmospheric implications, Atmos. Chem. Phys., 10, 6137–6149, doi:10.5194/acp-10-6137-2010, 2010.
Schinke, R.: Photodissociation Dynamics, Cambridge University Press, 1993.
Schinke, R.: Photodissociation of N2O: Potential energy
sur-faces and absorption spectrum, J. Chem. Phys., 134, 064313, doi:10.1063/1.3553377, 2011a.
Schinke, R.: Photodissociation of N2O: Temperature
de-pendence, Chem. Phys., In Press, Corrected Proof, doi:10.1016/j.chemphys.2011.06.003, 2011b.
Schinke, R., Suarez, J., and Farantos, S. C.: Communication: Pho-todissociation of N2O – Frustrated NN bond breaking causes
diffuse vibrational structures, J. Chem. Phys., 133, 091103, doi:10.1063/1.3479391, 2010.
Schmidt, B. and Lorenz, U.: WavePacket 4.6: A program package for quantum-mechanical wavepacket propagation and time-dependent spectroscopy, available via http://wavepacket. sourceforge.net, 2009.
Schmidt, J. A., Johnson, M. S., Lorenz, U., McBane, G. C., and Schinke, R.: Photodissociation of N2O: Energy partitioning, J.
Chem. Phys., 135, 024311, doi:10.1063/1.3602324, 2011. Selwyn, G. S. and Johnston, H. S.: Ultraviolet absorption spectrum
of nitrous oxide as a function of temperature and isotopic sub-stitution, J. Chem. Phys., 74, 3791–3803, doi:10.1063/1.441608, 1981.
Simonaitis, R., Greenberg, R. I., and Heicklen, J.: The photolysis of N2O at 2139 ˚A and 1849 ˚A, Int. J. Chem. Kinet., 4, 497–512,
doi:10.1002/kin.550040504, 1972.
Tal-Ezer, H. and Kosloff, R.: An accurate and efficient scheme for propagating the time dependent Schr¨odinger equation, J. Chem. Phys., 81, 3967–3971, doi:10.1063/1.448136, 1984.
Toyoda, S., Yoshida, N., Urabe, T., Aoki, S., Nakazawa, T., Sugawara, S., and Honda, H.: Fractionation of N2O
iso-topomers in the stratosphere, J. Geophys. Res., 106, 7515–7522, doi:10.1029/2000JD900680, 2001.
Turatti, F., Griffith, D. W. T., Wilson, S. R., Esler, M. B., Rahn, T., Zhang, H., and Blake, G. A.: Positionally dependent 15N fractionation factors in the UV photolysis of N2O determined
by high resolution FTIR spectroscopy, Geophys. Res. Lett., 27, 2489–2492, doi:10.1029/2000GL011371, 2000.
von Hessberg, P., Kaiser, J., Enghoff, M. B., McLinden, C. A., Sorensen, S. L., R¨ockmann, T., and Johnson, M. S.: Ultra-violet absorption cross sections of isotopically substituted nitrous ox-ide species:14N14NO,15N14NO,14N15NO and15N15NO, At-mos. Chem. Phys., 4, 1237–1253, doi:10.5194/acp-4-1237-2004, 2004.
Werner, H.-J. and Knowles, P. J.: A second order multiconfiguration SCF procedure with optimum convergence, J. Chem. Phys., 82, 5053–5063, doi:10.1063/1.448627, 1985.
Werner, H.-J. and Knowles, P. J.: An efficient internally contracted multiconfiguration-reference configuration interaction method, J. Chem. Phys., 89, 5803–5814, doi:10.1063/1.455556, 1988. Yoshida, N. and Toyoda, S.: Constraining the atmospheric N2O
budget from intramolecular site preference in N2O isotopomers,
Nature, 405, 330–334, doi:10.1038/35012558, 2000.
Yung, Y. L. and Miller, C. E.: Isotopic Fractionation of Stratospheric Nitrous Oxide, Science, 278, 1778–1780, doi:10.1126/science.278.5344.1778, 1997.