Hypertension and Quantitative Traits of Body Fatness
and Blood Pressure among 6,514 Adult Danes
Anette P. Gjesing1*, Thomas Sparsø1, Knut Borch-Johnsen2,6, Torben Jørgensen3,4, Oluf Pedersen1,3,6, Torben Hansen1,7, Niels V. Olsen3,5
1Hagedorn Research Institute, Gentofte, Denmark, 2Steno Diabetes Center, Gentofte, Denmark,3Institute of Biomedical Sciences, University of Copenhagen, Copenhagen, Denmark,4Research Centre for Prevention and Health, Glostrup University Hospital, Glostrup, Denmark,5Department of Neuroanaesthesia, Copenhagen University Hospital, Copenhagen, Denmark,6Faculty of Health Science, University of Aarhus, Aarhus, Denmark,7Faculty of Health Sciences, University of Southern Denmark, Odense, Denmark
Abstract
Background:Evidence regarding the association of variation withinADRB2, the gene encoding the beta-adrenergic receptor 2 (ADRB2) with obesity and hypertension is exceedingly ambiguous. Despite negative reports, functional impacts of individual genetic variants have been reported. Also, functional haplotypes as well as haplotype combinations affecting expression levelsin vivoof ADRB2 mRNA and protein as well as receptor sensitivity have been reported. The aim of the present study was therefore to evaluate if variations withinADRB2as haplotypes or as haplotype combinations confer an increased prevalence of obesity and hypertension among adults.
Methodology/Principal Findings:We genotyped five variants required to capture common variation in a region including the ADRB2 locus in a population-based study of 6,514 unrelated, middle-aged Danes. Phases of the genotypes were estimatedin silico. The variations were then investigated for their combined association with obesity, hypertension and related quantitative traits. The present study did not find consistent evidence for an association ofADRB2variants with either obesity or hypertension when variations were analysed in a case-control study. The same lack of impact was also seen in the quantitative trait analyses, apart from nominal differences on waist-to-hip ratio and systolic blood pressure between specific haplotype combinations.
Conclusions/Significance:In a population-based sample of 6,514 Danes we found no consistent associations between five common variants which tag theADRB2locus and prevalence of obesity or hypertension neither when analysed as individual haplotypes nor as haplotype pairs.
Citation:Gjesing AP, Sparsø T, Borch-Johnsen K, Jørgensen T, Pedersen O, et al. (2009) No Consistent Effect ofADRB2Haplotypes on Obesity, Hypertension and Quantitative Traits of Body Fatness and Blood Pressure among 6,514 Adult Danes. PLoS ONE 4(9): e7206. doi:10.1371/journal.pone.0007206
Editor:Amanda Ewart Toland, Ohio State University Medical Center, United States of America ReceivedMay 12, 2009;AcceptedSeptember 3, 2009;PublishedSeptember 25, 2009
Copyright:ß2009 Gjesing et al. This is an open-access article distributed under the terms of the Creative Commons Attribution License, which permits unrestricted use, distribution, and reproduction in any medium, provided the original author and source are credited.
Funding:The study was supported by grants from the Lundbeck Foundation Centre of Applied Medical Genomics for Personalized Disease Prediction, Prevention and Care (LUCAMP), the Danish Medical Research Council, the Danish Diabetes Association, Novo Nordisk, the University of Copenhagen, the scientific board of Copenhagen University Hospital (Rigshospitalet), the scientific board of the Danish Society of Anesthesiology, and the FOOD Study Group/the Danish Ministry of Food, Agriculture and Fisheries and Ministry of Family and Consumer Affairs, grant no. 2101-05-0044. The funders had no role in study design, data collection and analysis, decision to publish, or preparation of the manuscript.
Competing Interests:K. Borch-Johnsen, T. Hansen and O. Pedersen hold employee shares in Novo Nordisk and have received lecture fees from pharmaceutical companies. All other authors declare that there is no duality of interest associated with this manuscript.
* E-mail: [email protected]
Introduction
The beta-adrenergic receptor 2 (ADRB2) is part of the sympathetic nervous system influencing metabolic as well cardiovascular functions. Due to this biological function, ADRB2 has been a candidate for the development of obesity and hypertension; however, no consistent associations with these conditions have been observed. Previous studies have especially examined two functional variants, the Arg16Glu and the Gln27Glu, which in few studies were associated with both obesity [1,2] and hypertension [1,2]. However, overall there is ambiguity regarding the effect of these variants and in our previous study none of them were associated with either trait [3].
composed of these four SNPs were associated with obesity in a case-control study comprising 59 obese, 61 overweight and 79 lean individuals [6]. Moreover, ADRB2 haplotypes were reported to have a physiological effect on measures of blood pressure [7]. Thus, despite the previous lack of a consistent effect of individual SNPs inADRB2, there are several indications that haplotypes and haplotype combinations may have a physiologically significant effect, yet the effect of haplotypic pairs is so far unexplored in a large-scale study sample.
Therefore, we examined the impact of the individual haplotypes and haplotypic combinations within ADRB2. Five SNPs were selected using pair wise tagging with an R2above 0.8 as they were required to represent variation within theADRB2locus covering a 15 Kbp region which includedADRB2and two flanking linkage disequilibrium (LD) blocs according to HapMap (http://www. hapmap.org). This was followed by analyses of the effect of haplotypes and haplotype combinations in relation to the prevalence of obesity and hypertension.
Materials and Methods
Study sample
We studied a Danish population-based study sample involving of 6,514 middle-aged Danes from the greater Copenhagen area sampled at Research Centre for Prevention and Health (n= 6,514; 3,169 men, 3,345 women) aged 4668 years (mean6SD) and having a (body mass index) BMI of 26.364.6 kg/m2 (Clinical-Trials.gov ID-no:NCT00289237 [8]). Hypertension was defined as mean systolic blood pressure$140 mm Hg and/or mean diastolic blood pressure$90 mm Hg and/or current or previous treatment with antihypertensive drugs. Obesity was defined as individuals having a BMI above 30 kg/m2. A lean control individual was defined as having a BMI less the 25 kg/m2.
Ethics statements
Informed written consent was obtained from all subjects before participation. The study was approved by the Ethical Committee of Copenhagen County and was in accordance with the principles of the Helsinki Declaration.
Anthropometrics and physiological measures
Height and weight were measured in light indoor clothes and without shoes, and BMI was calculated as weight (kg)/height (m)2. Waist circumference was measured at the umbilical level to the nearest 0.5 cm with the subjects standing using a non-extendable linen tape measure according to WHO recommendation. The remaining measures were performed as previously described [9].
Genotyping
rs1042713, rs1042714, rs1800888, rs1042718 and rs1042719 were selected for analysis of the ADRB2 locus using pair wise tagging with an R2above 0.8. Genotyping was performed using Taqman allelic discrimination (KBioscience, Hoddesdon, UK) with a genotyping success rate above 97% for all five variants and only one genotyping error was observed out of a total of 1,726 duplicate samples. All genotype groups obeyed Hardy-Weinberg equilibrium in the population-based sample of Danes (p.0.2).
Statistical analysis
LD-structure was generated using HaploView 4.1. Fisher’s exact test was applied to analyse differences in minor allele frequency as well as genotype distribution of the individual genotypes. Logistic regression assuming an additive model was performed to evaluate the difference in genotype distribution
adjusted for sex and age in relation to obesity and hypertensive status. Multiple linear regression analysis was used to analyse the effect of individual genotypes on quantitative traits. Haplotype frequencies were estimated using the expectation-maximization (EM) algorithm and association was evaluated by global and haplotype-specific score statistics [10]. The global p-value is an estimate of the overall effect of haplotypes in the statistical model and the specificp-value is an estimate of the effect of a specific haplotype compared to the effect of the remaining haplotypes. Haplotypes with a frequency below 0.5% were excluded. The program PHASE version 2.1.1 was used to estimate the combinations of haplotypes. PHASE is a program using a Bayesian statistical method for reconstructing haplotypes from population genotype data developed by Stephens and colleagues [11,12]. General linear models with adjustment for sex and age was used to test a reference haplotype combination against the remaining haplotype combinations (in a pair-wise manner) for differences in the frequency of obesity and hypertension and traits related to these conditions and a specific p-value for each comparison was calculated. The reference was set as the haplotype combination (4,4). This was chosen as the reference based on the decreased expression previously seen for the haplotype corre-sponding to haplotype number 4 in the present study [4]. F-test (for continuous traits) and Chi-squared (for binary traits) were used to calculate the globalp-value representing the fit to the model added by haplotype combinations compared to a model including only sex, age and BMI. Statistical analyses rely on traits being normally distributed which after evaluation of quantile-quantile plots were found. Patients with known diabetes (n= 108) were excluded from all quantitative trait analyses and patients receiving anti-hypertensive treatment (n= 403) were excluded from quanti-tative trait analyses of blood pressure. A statistical power calculation was performed assuming haplotype frequencies of 39% versus 27% as observed in a previous report [6], a significance level of 95%, and a sample size of 1,000. All analyses were performed using RGui version 2.7. Ap-value of less than 0.05 was considered to be significant.
Results
The fiveADRB2variants which were genotyped were all located within the coding region and their allele frequencies were: 38% for rs1042713; 45% for rs1042714; 1.5% for rs1800888; 15% for rs1042718 and 28% for rs1042719. The LD-structure for the SNPs was evaluated and D’ was above 0.8 except for the two variations located furthest apart (Figure S1). R2was below 0.8 for all analyses (Figure S1). Only variants located within the same LD-block were included in the haplotypes. Thus, haplotypes were constructed from rs1042713, rs1042714, rs1800888, and rs1042718. These haplo-types were examined for association with obesity (Table 1) however; both specific and global effects were insignificant. Nor was any association of the haplotypes observed with BMI, waist circumfer-ence, or body weight (data not shown).
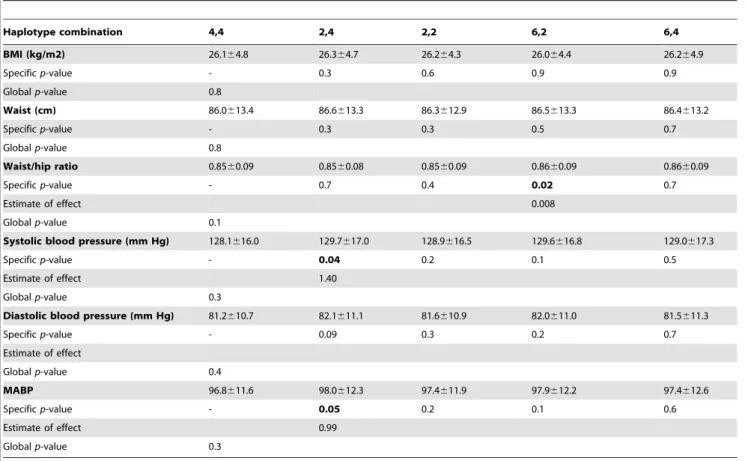
the haplotype combination 6,2, which had increased waist-to-hip ratio (p= 0.02; Table 2).
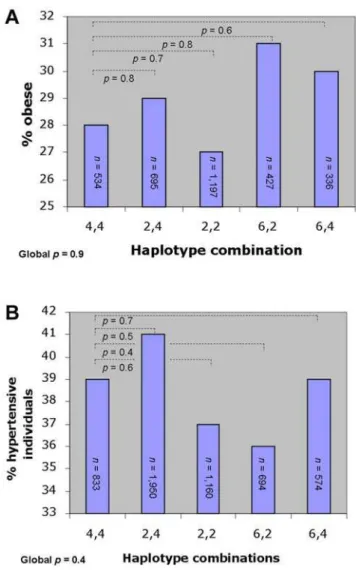
The haplotypes and haplotype combinations were also examined for association with hypertension. Haplotype analyses yielded the same lack of association with hypertension and blood pressure (Table 1). Also, haplotype combinations failed to significantly associate with hypertension (Figure 1B). However, a nominal significant difference in measures of systolic blood pressure as well as mean arterial blood pressure was observed between the reference combination and haplotype combination 2,4 with the latter having an increased blood pressure (Table 2).
Interactions between sex and the individual variants as well as haplotype pairs were examined (data not shown). Minor interaction was seen between rs1042719 and sex for measures of blood pressure; however, when performing sex stratified analyses for this variant no significant associations was found (data not shown). In contrast, we did not observe any interaction between sex and the effect of the haplotype pairs.
All of the above analyses were also performed after removal of the rare rs1800888, yet no robust associations were found except for an association with waist-to-hip ratio of a haplotype pair corresponding to 6,2 excluding rs1800888 (data not shown).
Despite the overall aim to evaluate the effect of haplotype combinations, the effect of individual genotypes was examined, yet no effect on either obesity or hypertension was observed for rs1800888, rs1042718, and rs1042719 (Table S1). The same lack of association was observed for the quantitative traits study (Table S2), except for a nominal association with increased waist-to-hip ratio for rs1042718 (p= 0.03).
Discussion
No consistent association with body weight or blood pressure regulation was found for the individualADRB2locus haplotypes. Neither did analyses ofADRB2haplotype combinations indicate any physiological impact on weight status except from the nominal difference in waist-to-hip ratio between the reference and the haplotype combination 6,2.
If the haplotype previously showing a decreased expression (haplotype number 4) had a physiologically impact on weight regulation, we would expect this haplotype to be associated with increased BMI, waist circumference or waist-hip ratio or an increased proportion of obese individuals due to a reduced lipolysis. Or it could have been expected that the haplotype
Figure 1. Case-control study comparing the frequency of obese and hypertensive individuals among the ADRB2 haplotype pairs, respectively.A: The proportion of obese out of the combined number of individuals in the lean group (BMI,25 kg/m2) and the obese (BMI.30 kg/m2) group (n= 3,189). B: The proportion of hypertensive individuals out of the combined number of individuals in the normotensive group and the hypertensive group (n= 5,211).
doi:10.1371/journal.pone.0007206.g001
Table 1.ADRB2haplotype analysis comparing obesity and hypertension status among 5,838 and 5,584 individuals from the Inter99 study sample, respectively.
Number corresponding to (2).
rs1042713 (Gly16Arg)
rs1042714 (Gln27Glu)
rs1800888 (Thr164Ile)
rs1042718 (AA175
Synonymous) Frequency (%)
Obesity Specificp-value
Hypertension Specificp-value
2 G G C C 44 0.5 0.6
5 G C C C 3 0.7 0.9
7 G C T A 2 0.8 1.0
6 G C C A 13 0.9 0.1
4 A C C C 38 0.5 0.1
Globalp-value 1.0 0.4
Haplotype frequencies were estimated using the expectation-maximization (EM) algorithm and association was evaluated by global and haplotype-specific score statistics (Schaid et al.2002). The globalp-value is an estimate for the overall effect of haplotypes in the statistical model and the specificp-value is an estimate of the effect of a specific haplotype compared to the effect of the remaining haplotypes combined. Obesity status was examined as individuals having a BMI below 25 kg/m2
vs. individuals having a BMI above 30 kg/m2. Hypertension status was examined as mean systolic blood pressure
$140 mm Hg and/or mean diastolic blood pressure$90 mm Hg and/or current or previous treatment with antihypertensive drugs vs. normotensive individuals.
combination showing the lowest response to a ADRB2 agonist (4,4) lead to a higher BMI due to a reduced agonist response and thus lower lipolysis. Yet, this is not the case.
Examination of the influence of haplotype combinations on measures of blood pressure showed a nominal effect of the haplotype combination 2,4 compared to haplotype pair 4,4. This combination is composed of the haplotypes previously showing the highest (2) and the lowest expression (4) of mRNA and proteinin vitro, thus there is no apparent link between expression and the physiological response observed. Also, no clear relation was seen between the haplotype combination (2,4) associating with increased blood pressure in the present study - most likely caused by vessel contraction - and the haplotype combination (6,6) previous associating with increased noradrenalin sensitivity measured in fat cells as maximum effect on lipolysis [5].
A statistical power calculation was performed based on the previously reported effect ofADRB2 haplotypes on obesity (OR: 0.58; CI: 0.34–0.96) [6]. In our study we have a statistical power of 1 to detect an equivalent association. If the haplotype pairs showing nominal effects on waist-to-hip ratio (4,4 and 6,2) and systolic blood pressure (4,4 and 2,4) are used for obesity and hypertension case-control studies, we can based on the OR confidence intervals estimate that it is unlikely in the present study population to find effect sizes on obesity above 1.4 and above 1.3 on hypertension.
Marker-by-marker analyses of rs1800888, rs1042718 and rs1042719 of ADRB2 in the present study and the previous
published analyses of rs1042713 and rs1042719 [4] showed nominally significant association with waist-to-hip ratio and systolic blood pressure in line with the results seen for haplotype pairs.
In summary, based on the findings of the present population based study in 6,514 adult Danes there is no evidence of functional haplotypes in the ADRB2locus with significant impact on body fatness or blood pressure regulation.
Supporting Information
Table S1 Case-control studies examining the individual effects of variants inADRB2 on obesity and hypertension among 6,514 individuals from the Inter99 study sample.
Found at: doi:10.1371/journal.pone.0007206.s001 (0.08 MB RTF)
Table S2 Quantitative trait analyses associations between 3 common ADRB2 variants and measures related to obesity and hypertension among 6,039 and 5,638 Danes from the inter99 study sample, respectively.
Found at: doi:10.1371/journal.pone.0007206.s002 (0.08 MB RTF)
Figure S1 Pair-wise LD plot calculated for the present study population of 5,730 Danes for the fiveADRB2variants estimated using D’ (A) and R2(B).
Found at: doi:10.1371/journal.pone.0007206.s003 (7.65 MB TIF) Table 2.Comparison betweenADRB2haplotype combinations and body composition and blood pressure among 4,885 and 4,566 Danish individuals, respectively.
Haplotype combination 4,4 2,4 2,2 6,2 6,4
BMI (kg/m2) 26.164.8 26.364.7 26.264.3 26.064.4 26.264.9
Specificp-value - 0.3 0.6 0.9 0.9
Globalp-value 0.8
Waist (cm) 86.0613.4 86.6613.3 86.3612.9 86.5613.3 86.4613.2
Specificp-value - 0.3 0.3 0.5 0.7
Globalp-value 0.8
Waist/hip ratio 0.8560.09 0.8560.08 0.8560.09 0.8660.09 0.8660.09
Specificp-value - 0.7 0.4 0.02 0.7
Estimate of effect 0.008
Globalp-value 0.1
Systolic blood pressure (mm Hg) 128.1616.0 129.7617.0 128.9616.5 129.6616.8 129.0617.3
Specificp-value - 0.04 0.2 0.1 0.5
Estimate of effect 1.40
Globalp-value 0.3
Diastolic blood pressure (mm Hg) 81.2610.7 82.1611.1 81.6610.9 82.0611.0 81.5611.3
Specificp-value - 0.09 0.3 0.2 0.7
Estimate of effect
Globalp-value 0.4
MABP 96.8611.6 98.0612.3 97.4611.9 97.9612.2 97.4612.6
Specificp-value - 0.05 0.2 0.1 0.6
Estimate of effect 0.99
Globalp-value 0.3
Data is mean6SD. P-values were corrected for age and sex. MABP (mean arterial blood pressure) is calculated as [(26diastolic blood pressure)+systolic blood pressure] divided by 3. The specificp-value is calculated based on a pair-wise comparison of the haplotype combination with the reference haplotype combination (4,4) using a multiple linear regression and the globalp-value has been calculated using an ANOVA. Patients with known diabetes were excluded from all of the above analyses and patients receiving anti-hypertensive treatment were excluded from blood pressure trait analyses.
Acknowledgments
The authors thank A. Forman, L. Wantzin, T. Lorentzen and M. Stendal for technical assistance, G. Lademann for secretarial support, A.L. Nielsen for data management, and M. Kristensen for scientific administration.
Author Contributions
Conceived and designed the experiments: APG OP TH NVO. Performed the experiments: APG OP TH NVO. Analyzed the data: APG TS TH. Contributed reagents/materials/analysis tools: KBJ TJ OP TH. Wrote the paper: APG. Discussed/revised the design, results and the paper: APG TS KBJ TJ OP TH NVO.
References
1. Pereira AC, Floriano MS, Mota GF, Cunha RS, Herkenhoff FL, et al. (2003) Beta2 adrenoceptor functional gene variants, obesity, and blood pressure level interactions in the general population. Hypertension 42: 685–92.
2. Bengtsson K, Orho-Melander M, Melander O, Lindblad U, Ranstam J, et al. (2001) Beta(2)-adrenergic receptor gene variation and hypertension in subjects with type 2 diabetes. Hypertension 37: 1303–8.
3. Gjesing AP, Andersen G, Burgdorf KS, Borch-Johnsen, Jørgensen T, et al. (2007) Studies of the associations between functionalb2-adrenergic receptor
variants and obesity, hypertension and type 2 diabetes in 7,808 subjects. Diabetologia 50: 563–568.
4. Drysdale CM, McGraw DW, Stack CB, Stephens JC, Judson RS, et al. (2000) Complex promoter and coding region beta 2-adrenergic receptor haplotypes alter receptor expression and predict in vivo responsiveness. Proc Natl Acad Sci U S A 97: 10483–10488.
5. Eriksson P, Dahlman I, Ryde´n M, Hoffstedt J, Arner P (2004) Relationship between b-2 adrenoceptor gene haplotypes and adipocyte lipolysis in women. Int J Obes 28: 185–190.
6. Cerrone GE, Pe´rez MS, Caputo M, Targovnik HM, Frechtel GD (2007) A simple method for the identification of three major haplotypes of the beta2AR. Mol Cell Probes 21: 222–225.
7. Binder A, Garcia E, Wallace C, Kazeem G, Ben-Shlomo Y, et al. (2006) Haplotypes of the beta-2 adrenergic receptor associate with diastolic blood pressure in the Caerphilly prospective study. J Hypertens 24: 471–477. 8. Jørgensen T, Borch-Johnsen K, Thomsen TF, et al. (2003) A randomized
non-pharmacological intervention study for prevention of ischaemic heart disease: baseline results Inter99 (1). Eur J Cardiovasc Prevention Rehab 10: 377–386. 9. Gjesing AP, Andersen G, Albrechtsen A, Glu¨mer C, Borch-Johnsen K, et al.
(2007) Studies of associations between the Arg389Gly polymorphism of the beta1-adrenergic receptor gene (ADRB1) and hypertension and obesity in 7677 Danish white subjects. Diabet Med 24: 392–7.
10. Schaid DJ, Rowland CM, Tines DE, Jacobson RM, Poland GA (2002) Score tests for association between traits and haplotypes when linkage phase is ambiguous. Am J Hum Genet 70: 425–434.
11. Stephens M, Smith NJ, Donnelly P (2001) A new statistical method for haplotype reconstruction from population data. Am J hum Genet 68: 978–989. 12. Stephens M, Scheet P (2005) Accounting for decay of linkage disequilibrium in