Spectral Sensitivity Measured with
Electroretinogram Using a Constant
Response Method
Fernando Allan de Farias Rocha1*, Bruno Duarte Gomes1,3, Luiz Carlos de
Lima Silveira1,3,4, Sonia Limara Martins2, Renata Genaro Aguiar2, John Manuel de Souza2, Dora Fix Ventura2
1Instituto de Ciências Biológicas, Universidade Federal do Pará, Belém, Pará, Brazil,2Instituto de Psicologia, Universidade de São Paulo, São Paulo, São Paulo, Brazil,3Núcleo de Medicina Tropical, Universidade Federal do Pará, Belém, Pará, Brazil,4Universidade Ceuma, São Luís, Maranhão, Brazil
Abstract
A new method is presented to determine the retinal spectral sensitivity functionS(λ) using the electroretinogram (ERG).S(λ)s were assessed in three different species of myomorph rodents, Gerbils (Meriones unguiculatus), Wistar rats (Ratus norvegicus), and mice (Mus musculus). The method, called AC Constant Method, is based on a computerized automatic
feedback system that adjusts light intensity to maintain a constant-response amplitude to a flickering stimulus throughout the spectrum, as it is scanned from 300 to 700 nm, and back. The results are presented as the reciprocal of the intensity at each wavelength required to maintain a constant peak to peak response amplitude. The resultingS(λ) had two peaks in all three rodent species, corresponding to ultraviolet and M cones, respectively: 359 nm and 511 nm for mice, 362 nm and 493 nm for gerbils, and 362 nm and 502 nm for rats. Results for mouse and gerbil were similar to literature reports ofS(λ) functions obtained with other methods, confirming that the ERG associated to the AC Constant-Response Method was effective to obtain reliableS(λ) functions. In addition, due to its fast data collection time, the AC Constant Response Method has the advantage of keeping the eye in a constant light adapted state.
Introduction
There are several studies in vision that require knowledge of the wavelength range within which the retina is able to function. In fact, determining this range by spectral sensitivity func-tionsS(λ) for a given species is the core of any experiment that utilizes visual stimulation to obtain either behavioral or physiological parameters. TheS(λ) gives information that might suggest different types of retinal processing as well as clues about behavioral priorities when the animal is in its natural environment. Classically, one can determine the photoreceptorS(λ) directly from measurements performed in outer segment of the photoreceptor cell through
OPEN ACCESS
Citation:Rocha FAdF, Gomes BD, Silveira LCdL, Martins SL, Aguiar RG, de Souza JM, et al. (2016) Spectral Sensitivity Measured with Electroretinogram Using a Constant Response Method. PLoS ONE 11 (1): e0147318. doi:10.1371/journal.pone.0147318
Editor:Daniel Osorio, University of Sussex, UNITED KINGDOM
Received:October 24, 2015
Accepted:December 31, 2015
Published:January 22, 2016
Copyright:© 2016 Rocha et al. This is an open access article distributed under the terms of the
Creative Commons Attribution License, which permits unrestricted use, distribution, and reproduction in any medium, provided the original author and source are credited.
Data Availability Statement:All relevant data are within the paper and its Supporting Information files.
microspectrophotometry [1–10] or indirectly from behavioral methods [11–18]. There are also a number of electrophysiological methods to determine photoreceptor spectral sensitivity (reviewed in [19]). De Souzaet al.[20], developed an efficient apparatus to make measurements ofS(λ) functions from intracellular recordings of retinal cells called AC Constant Response Method (AC method). This was a modification of previous procedures used in photoreceptor measurements ofS(λ), that relied on the cell’s steady response to light (DC methods) [21].
The DC constant-response method adjusts the intensity of a steady light to keep the response amplitude constant as wavelength is swept from one end to the other end of the spectrum. This method is applicable to photoreceptor cell responses, whose amplitude remain constant to a light stimulus of constant intensity. In the DC constant response method a computer steps the spectrum from ultraviolet to red or vice-versa. After each wavelength change, the response may increase or decrease in amplitude. The computer is programmed to step a neutral density wedge up or down to correct for this amplitude change, until the photoreceptor response crosses a con-stant criterion value [19,21].
De Souzaet al.[20] were interested in being able to determineS(λ) of other cell types, such as bipolar cells, whose response to light decreases over time, rather than being a step change, as in the photoreceptor. They thus devised a method in which an intermittent stimulus replaces the steady light which is presented in the DC method. When using the AC method the cell is stimulated with a flickering light, the computer then measures the peak-to-peak amplitude of the cell response and adjusts the intensity of the light to keep this response amplitude matched to a predetermined criterion. As in the DC method, this is effected by automatically controlling the position of a neural density filter to decrease or increase light intensity.
Venturaet al. [22,23] used the AC method to indirectly estimateS(λ) of UV cones in the turtle (Trachemys scripta elegans) by recording it from horizontal cells and comparing different chromatic adaptations. The UV function thus obtained had its maximum sensitivity at 372 nm mdash;a result exactly confirmed by concomitant investigation using microspetrophoto-metry (MSP) [6]. The coincidence ofS(λ) peaks obtained with MSP and electrophysiology rati-fied the reliability of the AC method as a valuable tool to measure spectral sensitivity functions.
The ERG has also been extensively used for measurements ofS(λ) in a variety of species [11–15,17,18,24–32]. One important approach using ERGs was the determination ofS(λ) curves by flicker photometry developed by Jacobset al. [33]. This was the color substitution method in which light from two beams, a flickering test and a reference beam, are interleaved and the intensity of the test beam is varied until the responses to the two beams are equated. To determineS(λ) the procedure is repeated for different wavelengths in the test beam.
In the present study, we used a modified version of the AC Constant Response Method to measure spectral sensitivity from mouse, rat, and gerbil using ERG.S(λ)measured with ERG contains pooled contributions of different photoreceptor types summed with the contribution of other cells in the retinal network, rather than the output of single photoreceptors or horizon-tal cells as in the previous studies that used this method to measureS(λ) through intracellular recordings in the eyes of bees and turtles [19,20,22,23]. The main advantages of using ERG as information source are that it is a simple procedure to implement in comparison with intracel-lular recordings and that it is a non invasive method. As such, it allows easy adaptation to other mammalian species.
Materials and Methods
Subjects
Experiments were performed on three rodent species: albino Wistar rat (Rattus norvegicus), gerbil (Meriones unguiculatus), and mouse (Mus musculus). The animals, all adults at the time
CAPES fellowship for graduate students. The funders had no role in study design, data collection and analysis, decision to publish, or preparation of the manuscript.
of testing (about 3 months old), were housed in cages measuring 41 x 34 x 16 cm, two animals per cage, food and water ad libitum, and kept on a 12h light / 12h dark cycle with ambient light. Animal handling and care complied with the Society for Neuroscience guidelines, also recommended by the Brazilian Society for Neuroscience and Behavior. The procedure was approved by the Ethic Commission for Research with Animals, Psychology Institute, Univer-sity of São Paulo, protocol #07/56844/-1, 19thMarch 2008.
The animals were anesthetized with an intramuscular injection of a mixture of xylazine hydrochloride (21 mg/kg) and ketamine hydrochloride (108 mg/kg). The pupil was dilated with atropine sulfate (0.04%) eye drops (about 30 min before start of measurements). The ani-mals were positioned in a head restraint apparatus and aligned with the optical system. ERGs were recorded with DTL electrodes (Diagnosys LLC, Lowell, MA, USA) placed over the corneal surface after applying drops of 1% methylcellulose. Ground (Grass E5 disc electrode; Grass-Telefactor, West Warwick, RI, USA) and reference electrodes (Grass-Telefactor) were placed on the forehead and external canthi, respectively. Retinal electrical potentials were amplified (Grass-Telefactor) with a band-pass set between 0.3–100 Hz, monitored on an oscilloscope (TDS 210; Tektronix, Richardson, TX, USA), and continuously digitized at a rate of 1 kHz by a computer equipped with a data-acquisition board (National Instruments, Austin, TX, USA). Before cone ERGs were recorded, the animals were light adapted for 10 min to assure maximal cone output and moreover the recordings were made in a room illuminated by ceiling-mounted fluorescent lamps (150 lx). This procedure was used in previous studies that aimed to have measured cone responses without rod influence [17,33].
Apparatus
The determination ofS(λ) was made using the equipment and general procedures described earlier [22,34]. In brief, an intermittent stimulus was delivered from an optical system, the out-put of which was presented in Maxwellian view (circular field 57° in diameter). A beam of monochromatic light originating from a monochromator (38-86-79; Bausch & Lomb, Tampa, FL, USA) equipped with a 75-W xenon arc lamp was used. A circular 4 log-unit neutral-density wedge was used to adjust light intensity (maximum intensity about 4.6 x 10¹⁶quanta/s/cm2). In the pupil plane, the optical system spectral output was calibrated with a radiometer (IL 1700 with modelED033 photodetector; International Light Technologies, Peabody, MA, USA) at all combinations of wavelength and position of the neutral-density wedge.
Software
positions times 256 wedge positions = 25856 values. Relative quanta were determined with a separate program that stepped the monochromator and wedge to each of the 25,856 combina-tions, The radiance input at the position of the eye was measured with an International Light IL700 radiometer with a PMD271D photomultiplier detector and converted to quantum fluxes.
Functional Description
The preparation was kept in a Faraday cage. We initially ran a spectral series consisting of monochromatic light flashes (at -1.5 log below the maximum intensity) from 340 to 560nm with intervals of 20 nm between flashes and then we proceeded to the determination of theS
(λ) with the AC Constant Response method [19,20]. In this method, a flickering light was pro-duced by a shutter (100% modulation). The resulting ERG was periodic and varied in ampli-tude across the light spectrum. The system measured the peak-to-peak response voltage (PPV) at a given wavelength and compared it to a pre-set criterion value. At each wavelength the peri-odic response to the flickering stimulus was digitized at 1000 samples/s and smoothed by aver-aging 16 consecutive samples; the peak-to-peak amplitudes of the smoothed samples were found and compared to the previously set criterion. If they were unequal, the wedge was stepped to a denser or a less dense position depending on the sign of the difference. After the criterion value had been crossed the wedge position corresponding to the closest match was recorded. The system could be programmed to average two or more consecutive peak-to-peak measurements before comparison with the criterion. Wavelengths were sampled from 300 to 700 nm, or vice-versa, in 4 or 12 nm steps.
EachS(λ) curve is an average of 10–15 spectral scans per animal. The frequency of stimula-tion was adjusted in the range of 4–12 Hz, the criteria of ERG response amplitude was set to 4μV amplitude.
Spectral Sensitivity Curves Estimate
We used the residual method to determine the sensitivity curves and peak maximum sensitivi-ties with the support of software PeakFit v. 4.12 (SeaSolve Software, Bangalore, Karnataka, India). This method is highly sensitive for the detection of peaks and is often used to find peak sensitivity in spectrographic or chromatographic among others applications [35–38].
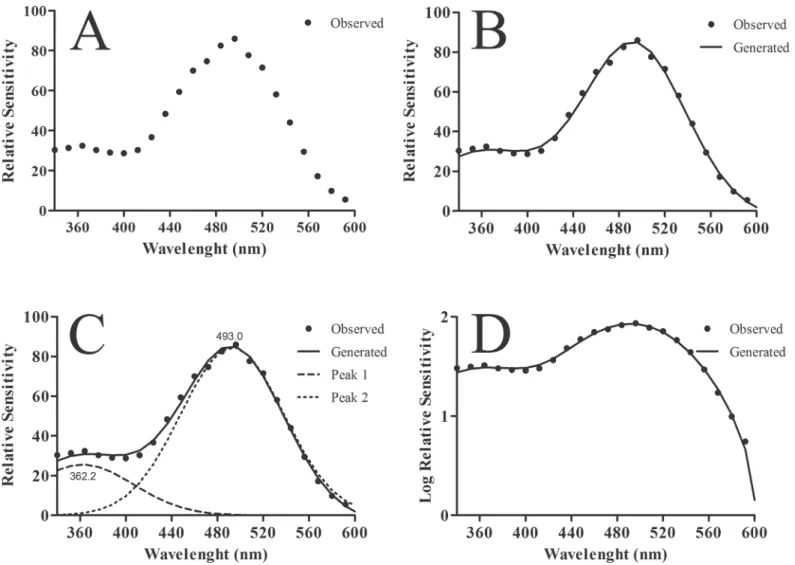
Briefly, the residual procedure provided a curve fitting by using a Fast Fourier Transform (FFT) filter from the data obtained by the AC Constant-Response Method (Fig 1A and 1B). The peaks were placed at local maxima in a smoothed data stream (Fig 1C) using Gaussian curves.Fig 1illustrates data obtained from gerbils, where two sensitivity peaks (λ
max) were
found: one in the UV range with aλmaxat 362 nm and another in the green region of the light spectrum with aλ
maxat 493 nm.
Results
Spectral Sensitivities for Different Species of Rodents
The next step was to perform measurements of spectral sensitivity with the AC Constant-Response Method on different rodent species. In all procedures, three animals of each species were used and 10–15 scans were performed in each animal with wavelengths presented from 340 to 600 nm in 4 or 12 nm steps. Average curves representing theS(λ) function were then fit-ted to the data points.
Fig 2Bshows theS(λ) functions obtained from mice. Two peaks were observed: a small one at 350–370 nm and a second large one between 500 and 520 nm. Peak values differed in sensi-tivity by approximately 0.5 log unit. For values larger than 520 nm, the sensisensi-tivity dropped sharply towards 600 nm. We did not observe significant responses for flashes above 620 nm.
TheS(λ) functions measured in rats (Fig 2C) also showed two peaks. The maximum sensi-tivity occurred in the green range of the light spectrum. When compared with the curve obtained for mice, the sensitivity range had an offset of -10 nm, with the peak situated in the range of 490–510 nm. Another peak could be seen in the UV range. The peaks differed in sensi-tivity by 0.8 log. The spectral sensisensi-tivity curve measured in gerbil (Fig 2D) was similar to those Fig 1. Sensitivity curves determined by the residual method. (A)Data obtained by using the AC Constant-Response Method for the gerbil.(B)Spectral sensitivity curve obtained using a Fast Fourier Transform (FFT) filter fitted to data points showed in (A).(C)Two peaks were found by fitting Gaussian normal curves to the FFT results. For the gerbil, the two peaks were located at 362 nm and 493 nm.(D)The same as in (B) showed in log scale.
found in mice and rats despite the fact that the flicker frequency used had been 12 Hz. Simi-larly, to results obtained in the other two rodents, two peaks were observed, one in the range of 480–500 nm and another in the UV range. The peaks differed in sensitivity for approximately 0.5 log.
Once we had analyzed all data points for the discrete wavelength range we then applied the residual method to estimate fitting curves forS(λ) of each rodent species (seeMaterial and
Methods).Fig 3AshowsS(λ) as a continuous curve for mice (r2= 0.9724) and the dashed lines are Gaussian curves generated by curve adjustment. The maximum sensitivities were 359 nm and 511 nm. For rats, theλmaxwas found at 362 nm and 502 nm (r2= 0.9654). For the gerbil the best curve yieldedλ
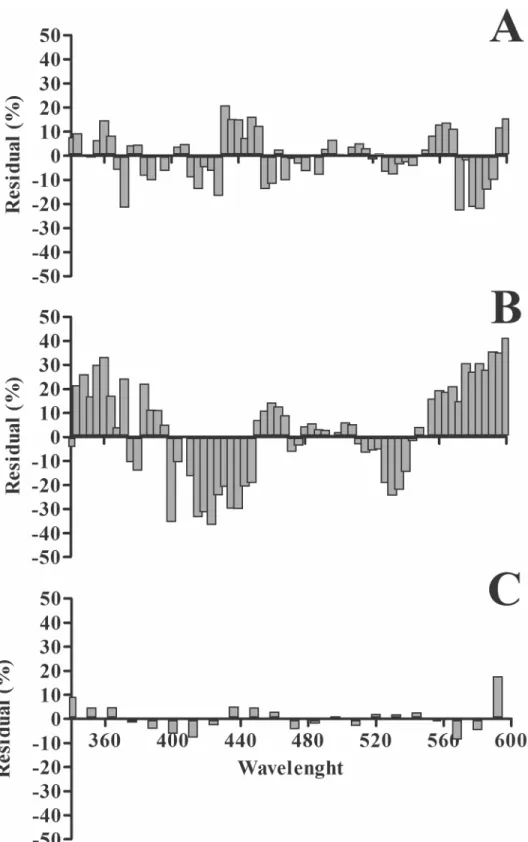
maxat 362 and 492 nm (r2= 0.9929).Fig 4shows a residual plot for
each species. The highest and lowest deviation between the fitted curve and the data was observed for gerbil and rats, respectively (Fig 4B and 4C).
Fig 2. Spectral series and spectral sensitivity obtained by using the AC Constant-Response Method. (A)ERG responses obtained from a light-adapted mouse. ERG responses were driven by flashes of monochromatic equal quanta lights of different wavelength. Note responses to wavelengths in the UV and green ranges.(B)Mean spectral sensitivity for mice. Filled circles and bars represent means and standard deviations for n = 3 animals.(C)and(D)
are the mean spectral sensitivities obtained for rats (n = 3) and gerbils (n = 3), respectively. Spectral sensitivity curves for mice and rats were obtained at 4 nm intervals while curves for gerbils were obtained at 12 nm intervals.
Discussion
The AC Constant-Response Method has been used in previous studies to estimate the spectral sensitivity of bees and turtles through intracellular recording of photoreceptors (bees) or hori-zontal cells (turtles) [20,22]. In bees, de Souzaet al. [20] estimatedS(λ) curves of three types corresponding to three photoreceptors (UV, blue, and green) peaking at 354, 430, and 518 nm. Another set of experiments that confirmed the reliability of the AC Constant-Response Method was performed by Venturaet al. [22], who described the spectral sensitivity for UV cones in turtles using intracellular recordings of horizontal cells. They found peak sensitivity at 372 nm for the UV cones. Simultaneously, Loew and Govardovskii found similar results using microspectrophotometry [6]. In the studies with turtles, the experiments were done with iso-lated eyes, using an eyecup preparation and required procedures to allow an adequate tissue survival. In the present study we extended the use of the AC Constant-Response Method for measurements using ERG which is a noninvasive measurement and thus enabled the calcula-tion ofS(λ)in vivo.
The ERG is a mass extracellular recording with a typical phasic response. The choice of the AC Constant-Response Method was adequate for this type of response because it is indepen-dent of the response type to be recorded, phasic or tonic [19,20]. Because the criterion in the AC method is a peak-to-peak amplitude rather than a voltage level [19,20], another advantage of the AC method is that it is insensitive to baseline changes during the recording session. These are common occurrences in electrophysiological recordings such as the ERG due to eye Fig 3. Mean spectral sensitivity curves for different species measured with the AC Constant-Response Method. (A)MeanS(λ) curves for mice with
λmaxat 359 and 511 nm (n = 3).(B)Mean spectral sensitivity curves for rats withλmaxat 362 and 502 nm (n = 3).(C)Mean spectral sensitivity curves for gerbil
withλmaxat 362 and 493 nm (n = 3).(D)Best fittings obtained for each species. For each species, spectral sensitivity curves directly obtained from FFT fits
and underlying Gaussian curves representing individual UV and M cone spectral sensitivities are shown.
Fig 4. Residual analysis for the spectral sensitivity curves of different species. (A)and(B)Results for mice and rats, respectively, where large differences relative to the adjustment curve were observed.(C)
Results for gerbils where the differences were small.
movements or other interferences. Moreover, ERGs elicited by a periodic stimulus (flicker ERG) are derived by both photoreceptors and bipolar cells when they are recorded at the cor-nea. Therefore, normal signaling of photoreceptors and bipolar cells as well as regular synaptic transmission from photoreceptors to bipolar cells are indispensable for the methods.
Nevertheless, the use of ERG associated with the AC Constant-Response Method showed high sensitivity, being able to detect spectral response of both cone populations (UV and M cones). These results showed that even in animals with low numbers of cones such as the rat, where cones correspond to about 1% of all photoreceptors [19], the method was still effective for photopic spectral sensitivity curve determination.
We were able to reproduce with the AC Constant-Response Method measurements of sensi-tivity in the UV range for the mouse and gerbil. Our results were very similar to those reported in previous publications by other authors. In our study, the fits for these animals showed peak sensitivity at 362 nm for the gerbil and 359 nm for the mouse. Peak sensitivity has been reported by Jacobs and collaborators to occur at 360 nm in gerbil [15] and 360 nm in mouse [29], in both cases they used the ERG flicker photometry method [33]. For the M cones we were able to measure the spectral sensitivity of the three species studied. Our results for the mouse and gerbil were very similar to those of other studies [15,27,29]. The peak sensitivity found for gerbils was 493 nm and thisλ
maxcoincided with that found by Jacobs and Deegan
[15]. For mice, theλmaxwas 511nm and it is within the range of 509–512 nm described by Jacobset al. [29].
Most studies that measured visual spectral sensitivity in albino mice have found curves shaped by M cone response [39–43]. Under light adaptation, ERG and behavioral results pro-vided aλmaxnear 500 nm [39,42]. Lewis and colleagues used fundus reflectometry to report λ
maxat 505 nm [41]. In our study theλmaxat about 501.8 nm using the AC method is closer to
the peaks reported by studies that used ERG. In addition, our method was able to show a sec-ond prominent elevation peaking at the UV range (362 nm). For comparison, theλ
maxfor
pig-mented rats in the UV range has been reported as being around 359 nm [17], which is only 3 nm apart from our peak measure.
Previous studies have reported peak differences for the middle wavelength part of the spec-trum between pigmented and albino rats [39,40,43]. Similarly, in the middle wavelength range λmaxwas higher (509 nm) for pigmented rats [17] compared to peak measured for albino rats
in our study (501 nm). It confirms the accuracy of the AC method for spectral sensitivity mea-sures. The results obtained for the albino rat are extremely important because of the wide use of these animals in physiological and behavioral studies of vision.
The residual analysis showed that the higher deviations from the fitted curves were found for rats followed by mice and by gerbil, with the lowest residual bounds. This discrepancy in the residual analysis could be attributed to the proportion of cones at each species relative to the total number of photoreceptors. The gerbil is a diurnal rodent whose photoreceptors com-prise 13% of cones [44]. In contrast, in the retina of the nocturnal mice and rats the proportion of cones is only 1–3% [45,46]. The reduced number of cones in mice and rats compared to ger-bil may have influenced the ERG amplitude adding a high cross-trials variager-bility mainly in the UV range where the highest residual values were observed. The influence of the number of cones on the ERG variability found in our results finds support in other studies. Yang and cols [47] recently conducted a detailed study of scotopic and photopic ERG in gerbil and mouse and pointed out that under scotopic conditions, the ERG response was higher in the rat. How-ever, in photopic conditions the amplitude of both the a-wave and b-wave were higher in the gerbil.
we had previously performed chromatic adaptation experiments in intracellular recordings from horizontal cells in the turtle and by doing so we were able to separate the four photopig-ments that exist in that species. We were pleasantly surprised by the fact that the peak we found for the ultraviolet receptor coincided almost exactly with that measured by Loew and Gowardovskii using microspectrophotometry [7]. We are planning to extend the method to human recordings but this would require some adaptation of the optical system.
In the present study we have successfully used the AC Constant-Response Method to obtain spectral sensitivity curves from rodent species using the ERG. The reliability of the method has already been established in previous studies using intracellular measurements [19,20,22]. The extension of the method to include ERG measurements remarkably simplifies the procedure enabling the application to mammals, whose retinas have smaller cells and require an intensive care to be maintained alive when compared with the retina of reptiles or insects.
Supporting Information
S1 ARRIVE Checklist. ARRIVE Guidelines Checklist.
(DOC)
S1 Dataset. Rodent sensitivity curves obtained with the AC Constant-Response Method.
(XLSX)
Author Contributions
Conceived and designed the experiments: FAFR JMS DFV. Performed the experiments: FAFR SLM RGA. Analyzed the data: FAFR BDG JMS DFV. Contributed reagents/materials/analysis tools: DFV. Wrote the paper: FAFR BDG LCLS DFV.
References
1. Arrese CA, Hart NS, Thomas N, Beazley LD, Shand J. Trichromacy in Australian marsupials. Curr Biol. 2002; 12: 657–660. doi:10.1016/S0960-9822(02)00772-8PMID:11967153
2. Bowmaker JK, Thorpe A, Douglas RH. Ultraviolet-sensitive cones in the goldfish. Vision Res. 1991; 31: 349–352. doi:10.1016/0042-6989(91)90087-LPMID:1843746
3. Bowmaker JK, Loew ER, Ott M. The cone photoreceptors and visual pigments of chameleons. J Comp Physiol A. 2005; 191: 925–932. doi:10.1007/s00359-005-0014-4
4. Govardovskii VI, Fyhrquist N, Reuter T, Kuzmin DG, Donner K. In search of the visual pigment tem-plate. Vis Neurosci. 2000; 17: 509–528. PMID:11016572
5. Hemmi JM, Maddess T, Mark RF. Spectral sensitivity of photoreceptors in an Australian marsupial, the tammar wallaby (Macropus eugenii). Vision Res. 2000; 40: 591–599. doi:10.1016/S0042-6989(99) 00210-2PMID:10824263
6. Loew ER, Govardovskii VI. Photoreceptors and visual pigments in the red-eared turtle,Trachemys scripta elegans. Vis Neurosci. 2001; 18: 753–757. PMID:11925010
7. Loew ER, Govardovskii VI, Rohlich P, Szel A. Microspectrophotometric and immunocytochemical iden-tification of ultraviolet photoreceptors in geckos. Vis Neurosci. 1996; 13: 247–256. PMID:8737275 8. Loew ER. A third, ultraviolet-sensitive, visual pigment in the Tokay gecko (Gekko gekko). Vision Res.
1994; 34: 1427–1431. doi:10.1016/0042-6989(94)90143-0PMID:8023453
9. Parry JWL, Bowmaker JK. Visual pigment coexpression in guinea pig cones: A microspectrophotomet-ric study. Inv Ophthalmol Vis Sci. 2002; 43: 1662–1665.
10. Partridge JC, Speare P, Shand J, Muntz WR, Williams DM. Microspectrophotometric determinations of rod visual pigments in some adult and larval Australian amphibians. Vis Neurosci. 1992; 9: 137–142. doi:10.1017/S0952523800009597PMID:1504022
12. Neumeyer C, Arnold K. Tetrachromatic color vision in the goldfish becomes trichromatic under white adaptation light of moderate intensity. Vision Res. 1989; 29: 1719–1727. doi:10.1016/0042-6989(89) 90154-5PMID:2631393
13. Neumeyer C, Jager J. Spectral sensitivity of the freshwater turtle Pseudemys scripta elegans: Evidence for the filter-effect of colored oil droplets. Vision Res. 1985; 25: 833–838. doi:10.1016/0042-6989(85) 90191-9PMID:4024481
14. Kaltenrieder M, Labhart T, Hess E. Spectral sensitivity, absolute threshold, and visual field of two tick species,Hyalomma dromedariiandAmblyomma variegatum. J Comp Physiol A. 1989; 165: 155–164. PMID:2746548
15. Jacobs GH, Deegan JF. Sensitivity to ultraviolet light in the gerbil (Meriones unguiculatus): Characteris-tics and mechanisms. Vision Res. 1994; 34:1433–1441. doi:10.1016/0042-6989(94)90144-9PMID: 8023454
16. Jacobs GH, Neitz J. Spectral mechanisms and color vision in the tree shrew (Tupaia belangeri). Vision Res. 1986; 26: 291–298. doi:10.1016/0042-6989(86)90026-XPMID:3716222
17. Jacobs GH, Fenwick JA, Williams GA. Cone-based vision of rats for ultraviolet and visible lights. J Exp Biol. 2001; 204: 2439–2446. PMID:11511659
18. Jacobs GH, Deegan JF. Spectral sensitivity, photopigments, and color vision in the guinea pig (Cavia porcellus). Behav Neurosci. 1994; 108: 993–1004. doi:10.1037/0735-7044.108.5.993PMID:7826522 19. DeVoe RD, De Souza JM, Ventura DF. Electrophysiological measurements of spectral sensitivities: A
review. Brazil J Med Biol Res. 1997; 30: 169–177. doi:10.1590/S0100-879X1997000200003 20. De Souza JM, Devoe RD, Schoeps C, Ventura DF. An AC constant-response method for
electrophysi-ological measurements of spectral sensitivity functions. J Neurosci Methods. 1996; 68: 203–210. doi: 10.1016/0165-0270(96)00076-3PMID:8912193
21. Menzel R, Ventura DF, Hertel H, Souza JM, Greggers U. Spectral sensitivity of photoreceptors in insect compound eyes: Comparison of species and methods. J Comp Physiol A. 1986; 158: 165–177. doi:10. 1007/BF01338560
22. Ventura DF, Zana Y, de Souza JM, DeVoe RD. Ultraviolet colour opponency in the turtle retina. J Exp Biol. 2001; 204: 2527–2534. PMID:11511668
23. Zana Y, Ventura DF, de Souza JM, DeVoe RD. Tetrachromatic input to turtle horizontal cells. Vis Neu-rosci. 2001; 18: 759–765. PMID:11925011
24. Jacobs GH, Deegan JF 2nd. Spectral sensitivity of macaque monkeys measured with ERG flicker pho-tometry. Vis Neurosci. 1997; 14: 921–928.
25. Jacobs GH, Deegan JF. Cone pigment variations in four genera of new world monkeys. Vision Res. 2003; 43: 227–236. doi:10.1016/S0042-6989(02)00565-5PMID:12535982
26. Jacobs GH, Deegan JF, Moran JL. ERG measurements of the spectral sensitivity of common chimpan-zee (Pan troglodytes). Vision Res. 1996; 36: 2587–2594. doi:10.1016/0042-6989(95)00335-5PMID: 8917819
27. Jacobs GH, Williams GA. Contributions of the mouse UV photopigment to the ERG and to vision. Doc Ophthalmol. 2007; 115: 137–144. doi:10.1007/s10633-007-9055-zPMID:17479214
28. Jacobs GH, Williams GA. Cone pigments in a North American marsupial, the opossum (Didelphis vir-giniana). J Comp Physiol A. 2010; 196: 379–384. doi:10.1007/s00359-010-0519-3
29. Jacobs GH, Williams GA, Fenwick JA. Influence of cone pigment coexpression on spectral sensitivity and color vision in the mouse. Vision Res. 2004; 44: 1615–1622. doi:10.1016/j.visres.2004.01.016 PMID:15135998
30. Matsumoto T, Ihara H, Ishida Y, Okada T, Kurata M, Sawada Y, et al. Electroretinographic analysis of night vision in juvenile Pacific bluefin tuna (Thunnus orientalis). Biol Bull. 2009; 217: 142–150. PMID: 19875819
31. Schleich CE, Vielma A, Glösmann M, Palacios AG, Peichl L. Retinal photoreceptors of two subterra-nean tuco-tuco species (Rodentia, Ctenomys): Morphology, topography, and spectral sensitivity. J Comp Neurol. 2010; 518: 4001–4015. doi:10.1002/cne.22440PMID:20737597
32. Toda K, Bush RA, Humphries P, Sieving PA. The electroretinogram of the rhodopsin knockout mouse. Vis Neurosci. 1999; 16: 391–398. PMID:10367972
33. Jacobs GH, Neitz J, Krogh K. Electroretinogram flicker photometry and its applications. J Opt Soc Am A. 1996; 13: 641–648. doi:10.1364/JOSAA.13.000641
35. Jacobson F, Karkehabadi S, Hansson H, Goedegebuur F, Wallace L, Mitchinson C, et al. The crystal structure of the core domain of a cellulose induced protein (Cip1) from Hypocrea jecorina, at 1.5 A reso-lution. PLoS One. United States; 2013; 8: e70562. doi:10.1371/journal.pone.0070562PMID:
24039705
36. Doǧan ÖN, Hu R, Song X, Chen S, Gao MC. Ordered bcc phases in a Cu-Pd-Mg hydrogen separation membrane alloy. J Alloys Compd. 2012; 528: 10–15. doi:10.1016/j.jallcom.2012.02.120
37. Huang Q, Zhang K, Wang Z, Wang C, Peng X. Enantiomeric determination of azole antifungals in wastewater and sludge by liquid chromatography-tandem mass spectrometry. Anal Bioanal Chem. 2012; 403: 1751–1760. doi:10.1007/s00216-012-5976-9PMID:22526654
38. Singh TB, Rey L, Gartia RK. Applications of PeakFit software in thermoluminescence studies. Indian J Pure Appl Phys. 2011; 49: 297–302.
39. Dodt E, Echte K. Dark and light adaptation in pigmented and white rat as measured by electroretino-gram threshold. J Neurophysiol. 1961; 24: 427–445. PMID:13723365
40. Massof RW, Nicholson JM, Jones AE. A possible mechanism for color vision in the rat. Psychon Sci. 1972; 26: 175–176. doi:10.3758/BF03335473
41. Lewis DM. Retinal photopigments in the albino rat. J Physiol. 1957; 136: 615–623. PMID:13429526 42. Silver PH. Spectral sensitivity of the white rat by a training method. Vision Res. 1967; 7: 377–383.
PMID:5613303
43. Green DG. Light adaptation in the rat retina: evidence for two receptor mechanisms. Science. 1971; 174: 598–600. PMID:5114823
44. Govardovskii VI, Röhlich P, Szél A, Khokhlova TV. Cones in the retina of the Mongolian gerbil, Mer-iones unguiculatus: an immunocytochemical and electrophysiological study. Vision Res. 1992; 32: 19– 27. doi:10.1016/0042-6989(92)90108-UPMID:1502806
45. Szél A, Röhlich P. Two cone types of rat retina detected by anti-visual pigment antibodies. Exp Eye Res. 1992; 55: 47–52. doi:10.1016/0014-4835(92)90090-FPMID:1397129
46. Carter-Dawson LD, LaVail MM. Rods and cones in the mouse retina. I. Structural analysis using light and electron microscopy. J Comp Neurol. 1979; 188: 245–62. doi:10.1002/cne.901880204PMID: 500858