Phytoplankton by a Next Generation Sequencing Based
Approach
Alexander Eiler1*, Stina Drakare2, Stefan Bertilsson1, Jakob Pernthaler3, Sari Peura4, Carina Rofner1, Karel Simek5, Yang Yang6, Petr Znachor5, Eva S. Lindstro¨m1
1Uppsala University, Department of Ecology and Genetics, Limnology, Uppsala, Sweden,2Swedish University of Agricultural Sciences, Aquatic Sciences and Assessment, Uppsala, Sweden,3Limnological Station, Institute of Plant Biology, Kilchberg, Switzerland,4University of Jyva¨skyla¨, Department of Biological and Environmental Science, Jyva¨skyla¨, Finland,5Biology Centre of the Academy of Sciences of the Czech Republic, v.v.i., Institute of Hydrobiology, Cˇeske´ Budeˇjovice, Czech Republic,6Uppsala University, Erken Laboratory, Norrta¨lje, Sweden
Abstract
The recognition and discrimination of phytoplankton species is one of the foundations of freshwater biodiversity research and environmental monitoring. This step is frequently a bottleneck in the analytical chain from sampling to data analysis and subsequent environmental status evaluation. Here we present phytoplankton diversity data from 49 lakes including three seasonal surveys assessed by next generation sequencing (NGS) of 16S ribosomal RNA chloroplast and cyanobacterial gene amplicons and also compare part of these datasets with identification based on morphology. Direct comparison of NGS to microscopic data from three time-series showed that NGS was able to capture the seasonality in phytoplankton succession as observed by microscopy. Still, the PCR-based approach was only semi-quantitative, and detailed NGS and microscopy taxa lists had only low taxonomic correspondence. This is probably due to, both, methodological constraints and current discrepancies in taxonomic frameworks. Discrepancies included Euglenophyta and Heterokonta that were scarce in the NGS but frequently detected by microscopy and Cyanobacteria that were in general more abundant and classified with high resolution by NGS. A deep-branching taxonomically unclassified cluster was frequently detected by NGS but could not be linked to any group identified by microscopy. NGS derived phytoplankton composition differed significantly among lakes with different trophic status, showing that our approach can resolve phytoplankton communities at a level relevant for ecosystem management. The high reproducibility and potential for standardization and parallelization makes our NGS approach an excellent candidate for simultaneous monitoring of prokaryotic and eukaryotic phytoplankton in inland waters.
Citation:Eiler A, Drakare S, Bertilsson S, Pernthaler J, Peura S, et al. (2013) Unveiling Distribution Patterns of Freshwater Phytoplankton by a Next Generation Sequencing Based Approach. PLoS ONE 8(1): e53516. doi:10.1371/journal.pone.0053516
Editor:Ive De Smet, University of Nottingham, United Kingdom
ReceivedSeptember 18, 2012;AcceptedNovember 29, 2012;PublishedJanuary 22, 2013
Copyright:ß2013 Eiler et al. This is an open-access article distributed under the terms of the Creative Commons Attribution License, which permits unrestricted use, distribution, and reproduction in any medium, provided the original author and source are credited.
Funding:This work was supported by the Swedish foundation for strategic research (grant to AE), the Swedish Research Council (separate grants to ESL and SB) and the Czech Grant Agency (grant 206/08/0015 to KS). The funders had no role in study design, data collection and analysis, decision to publish, or preparation of the manuscript.
Competing Interests:Stefan Bertilsson is an editor of PLOS ONE. This does not alter the authors’ adherence to all the PLOS ONE policies on sharing data and materials.
* E-mail: [email protected]
Introduction
Phytoplankton are essential for biogeochemical cycles [1] and form the base of aquatic food webs [2,3]. Their excessive growth can also cause significant threats to local biodiversity and ecosystem functioning, as in the case of toxic algal blooms [4]. Consequently, phytoplankton are used to monitor the status of aquatic ecosystems and there is a need to understand and predict the responses of these communities to shifting environmental conditions, such as climate change, increasing nutrient inputs, and modifications in flow regimes and land use due to an increasing anthropogenic pressure [4,5]. Considering that phytoplankton species differ widely in nutrient requirements, susceptibility to predation and toxicity, it is important to understand not only the drivers of total phytoplankton biomass but also of their community composition.
preparation can be automated and thereby lower analytical costs as well as increase speed of analyses. This makes it possible to increase sampling frequency across both time and space and facilitate large scale comparisons of results from very different aquatic systems. By using the same protocol, it is also possible to standardize the analyses in different laboratories around the globe. Since this sequence-based taxonomic identification can be done in an identical way regardless of operator and laboratory, this significantly improves the potential for cross-system comparisons. Microscopic identification on the other hand, relies heavily on the skills and experience of each taxonomist. This may lead to consistency problems when more than one operator carries out the analyses, for instance in long term water monitoring projects or global comparative studies, as taxonomic resolution is quite likely to vary. Another advantage of molecular approaches is that it becomes possible to recognize and identify nano- and picophyto-plankton that cannot be discriminated based on morphological features, such as unicellular cyanobacteria and small flagellates [12]. Furthermore, NGS based approaches allow the accurate identification of rare and fragile phytoplankton taxa, allow unmasking of look-a-likes and do not discriminate between life stages. A final advantage is the fact that evolving sequence-based phytoplankton monitoring datasets can be re-analyzed at a later time, using more refined taxonomic reference databases and other new information.
In the aquatic environment, these new sequencing technologies have already been introduced in studies on the diversity of other organisms lacking morphological detail for identification e.g. bacteria [13–17], archaea [18,19] and microeukaryotes [20]. NGS is now allowing us to study patterns of microbial diversity in much greater detail than with microscopy or previously used molecular techniques [10], and should be equally useful for phytoplankton communities. However, the choice of the most informative taxonomic marker gene is still highly debated for phytoplankton and has so far hindered the large scale application of NGS facilitated approaches for phytoplankton monitoring. Still, the NGS method itself is global as it can be applied to every taxonomic marker with appropriate PCR primer sites and hence its development is independent from the marker of choice.
Here, we use the 16S rRNA gene as a marker as it is universal in prokaryotes including cyanobacteria and also universally present in the chloroplasts of eukaryotes. This enables simultaneous detection of prokaryotic and eukaryotic phytoplankton taxa. Using datasets based on 16S rRNA gene amplicons that have been sequenced by 454 pyrosequencing, we describe temporal patterns in three lakes and compare phytoplankton communities among an additional 46 lakes from temperate, boreal and polar regions. Our sequence-based data reveals that phytoplankton composition differ significantly among lakes with different trophic status showing that our approach can resolve phytoplankton communities and act as a tool for monitoring trophic status of aquatic systems. Our study illustrates the potential of DNA sequencing-based analyses as powerful tools in environmental monitoring by offering accurate, reliable and rapid identification of phytoplankton taxa from complex environmental samples.
Methods
Sampling
Water samples were taken from a range of lakes of different nutrient content (including also some saline Antarctic lakes) as described previously for Erken (ER [14]); Alinen Mustaja¨rvi (AM), Mekkojarvi (MJ), Nimeto¨n (N), Valkea Kotinen (VK) and Valkea Mustajarvi (VM) [17]; A˚ tva¨ndtja¨rnen (AT), Bodsjo¨n (Bod),
Bustadtja¨rnen (Bus), Digerna¨stja¨rnen (DT), Gravatja¨rnen (GT), Ha¨ggsjo¨n (Hag), Halla˚stja¨rnen (Hat), Hensjo¨n (Hes), Holmtja¨rnen (Holm), La˚ng-Bjo¨rsjo¨n (LBS), Medstugusjo¨n (MS), O¨ ster-Noren (ON), Skalsvattnet (SV), Ta¨nnsjo¨n (TS), Va¨ster-Noren (VN) [16]; Alstasjo¨n (AS), A˚ resjo¨n (AS), Bredsjo¨n (Bre), Fibysjo¨n (Fib), Funbosjo¨n (Fun), Hasselasjo¨n (Has), La˚ngsjo¨n (LAS), Lille Jonsvatn (LJ), Lo¨tsjo¨n (LOS), Lumpen (LUM), O¨ vre La˚ngsjo¨n (OLS), man-made Rˇ ı´mov Reservoir (RI), Norrsjo¨n (NS), Ramsen (RA), Ramsjo¨n (RS), Ryssjo¨n (Rys), Siggeforasjo¨n (Sig), Strandsjo¨n (Str), Valloxen (VA) and Zurich (ZU; this study); and Antarctic systems [14]. Metadata including physiochemical parameters were determined as described previously [14–17] and are summarized in Table S1. Time-series data were obtained from four systems; AM, ER, RI and ZU were represented by 44, 71, 48 and 33 samples, respectively. Most other systems (N = 41) were only sampled once, and 11 systems were sampled twice, bringing the total number of samples to 259 samples with 56 lakes represented.
Microscopy analysis of phytoplankton community composition
Samples for assessment of phytoplankton abundance and biomass were preserved with Lugol’s solution. This was done for time series data from AM, ER and RI. Phytoplankton were enumerated using inverted microscopes at 100–10006 magnifica-tion, after sedimentation of a known volume of sample in a counting chamber [21]. The mean algal cell dimensions were obtained for biovolume calculation using the approximation of cell morphology to regular geometric shapes [22]. Species composition was determined to the finest level possible (usually species). Some taxa were grouped into non-taxonomical groups due to few morphological characteristics visible with the chosen analysis method. Each time-series was analyzed by different taxonomists using national taxonomic monographs.
DNA extraction, PCR amplification and sequencing Genomic DNA extraction from filters (0.2mm) was performed using the Ultra clean Soil DNA extraction kit as recommended by the manufacturer (MoBio, Laboratories, Solana Beach, CA, USA). Except for lakes AM, MJ, N, VK and VM a modified protocol originally described by Griffiths et al. was used [17,23]. DNA from the Antarctic lakes was extracted using the Power soil kit (MoBio) and for lakes AS, AT, Bod, Bre, Bus, DT, Fib, Fun, GT, Hag, Has, Hat, Hes, Holm, LBS, LAS, LJ, LOS, LUM, MS, OLS, ON, NS, RA, RS, Rys, Sig, SV, Str TS, VA and VN the Easy DNA extraction kit (Invitrogen, Carlsbad, CA, USA) was used. PCR amplification was performed using general bacterial primers 341F (CCTACGGGNGGCWGCAG) and reverse primers 805R (GACTACHVGGGTATCTAATCC) with 454 adaptors and a sample-specific barcode on the reverse primer [13] under conditions described previously [14–16]. The amplicons were pyrosequenced with the 454 GS FLX system (454 Life Sciences, Branford, CT, USA) by different laboratories using both FLX and Titanium chemistry following procedures as described in detail previously [13–17].
Sequence processing
Output from the sequencer in the form of SFF files together with a list of samples including their corresponding barcodes were used for the analyses. First, ambiguous sequences were removed from the data set including reads with low quality as inferred from their flowcharts and those that did not carry the exact primer sequence (reverse primer 805R) [13]. After reads had been sorted into samples based on the barcodes, they were denoised using
AmpliconNoise Version 1.24 [24]. AmpliconNoise implements algorithms that remove PCR and 454 pyrosequencing noise as well as the chimera removal tool Perseus. This procedure resulted in almost 1.2 Million high quality reads of which almost 90,000 were annotated as cyanobacteria or chloroplasts using a naı¨ve Bayesian classifier [25] and the taxonomy after Hugenholtz [26]. To obtain a higher taxonomic resolution than provided by the classifier, a representative sequence from each OTU was aligned in MOTHUR [27] using kmer for finding the template sequence and Needleman for aligning sequences against the SILVA106 small subunit rRNA gene database [28]. Aligned sequences were imported into ARB [29] and the quick parsimony option was used to add the aligned sequences to the small subunit reference tree included in SILVA106 database. In addition, a refined classifica-tion was performed using an in-house cyanobacterial/chloroplast database using the naı¨ve Bayesian classifier [25]. This database is based on the 16S rRNA gene sequences of cyanobacteria and eukaryotic chloroplasts from well-characterized phytoplankton entries of the SILVA106 database.
Statistical analyses
To assign phytoplankton reads into operational taxonomic units (OTUs) prior to ordination procedures, sequences were clustered based on 97% sequence similarity using UCLUST [30]. The perl script daisychopper.pl (available at http://www.genomics.ceh.ac. uk/GeneSwytch/Tools. html) [31] was used to resample a selection of 139 samples (including only chloroplast and cyano-bacteria related OTUs) to 100 reads prior to statistical analyses. Samples with less than 100 chloroplast and cyanobacteria reads were excluded from further analyses.
All statistical analyses were conducted using R (http://www.R-project.org/) [32] and the vegan package [33]. Non-metric multidimensional scaling of a Morisita-Horn distance matrix (function metaMDS) was used to visualize dynamics in phyto-plankton community structure (beta diversity) using an OTU abundance matrix based on all OTUs represented by at least 3 reads in the non-resampled data matrix (194 OTUs). Permuta-tional MANOVA was used to determine significant differences among lakes of different trophic status. Oligotrophic, mesotrophic,
eutrophic and dystrophic as well as Antarctic samples were placed into their respective categories based on previous ecosystem characterization in the literature [14–17]. The direct comparison of the NGS data with microscopic data (cell abundances and biovolumes) were done from three lakes by both Procrustes superimposition and Mantel’s test [33]. The three systems were analyzed individually as microscopy was performed each by a different taxonomist.
Results
Taxonomic composition
After quality filtering and preprocessing 1,116 833 reads were obtained from the 259 sequenced samples included in the study, whereof nine percent or a total of 89,982 reads could be assigned to cyanobacteria or chloroplasts (from this onwards termed phytoplankton). The sequencing effort was highly variable among the samples ranging from 106 to 32,832 total reads per sample. Heterotrophic bacteria usually occur in higher numbers than phytoplankton, which is reflected in the ratio between phyto-plankton reads and the total number of reads. This ratio was on average 0.098 (range from 0 to 0.58) and a distribution as depicted in Figure 1A. Low ratios together with low sequencing effort caused the number of phytoplankton reads to be too low to resolve the alpha diversity of the phytoplankton in most samples (see Figure 1B). To diminish the limitations of small sampling sizes for analyses on beta diversity and taxon dynamics, samples with less than 100 phytoplankton reads were removed, leaving 139 samples (54% of all samples) and a total of 82,825 phytoplankton sequences. The 139 selected samples represent lakes with a concentration range in total phosphorus from 2.9 to 149mg L21
, total nitrogen from 0.4 to 1900mg L21
, chlorophyllafrom 0 to 40mg L21and dissolved organic carbon from 2 to 32mg C L21 (see Table 1 for list of lakes used for analyses and Table S1 for associated metadata).
For each of these 139 samples, the average number of reads annotated as cyanobacteria and chloroplasts was 596. This is in the same range as the average number of cells counted and classified by microscopy (at least 500) [34]. In total 946 Figure 1. The ratio between the total number of reads and the number of phytoplankton reads (A) and rarefaction curves of the next-generation sequencing data (from all 259 samples) (B).The lines depict different ratios (phytoplankton reads:total number of reads) and the points represent the samples.
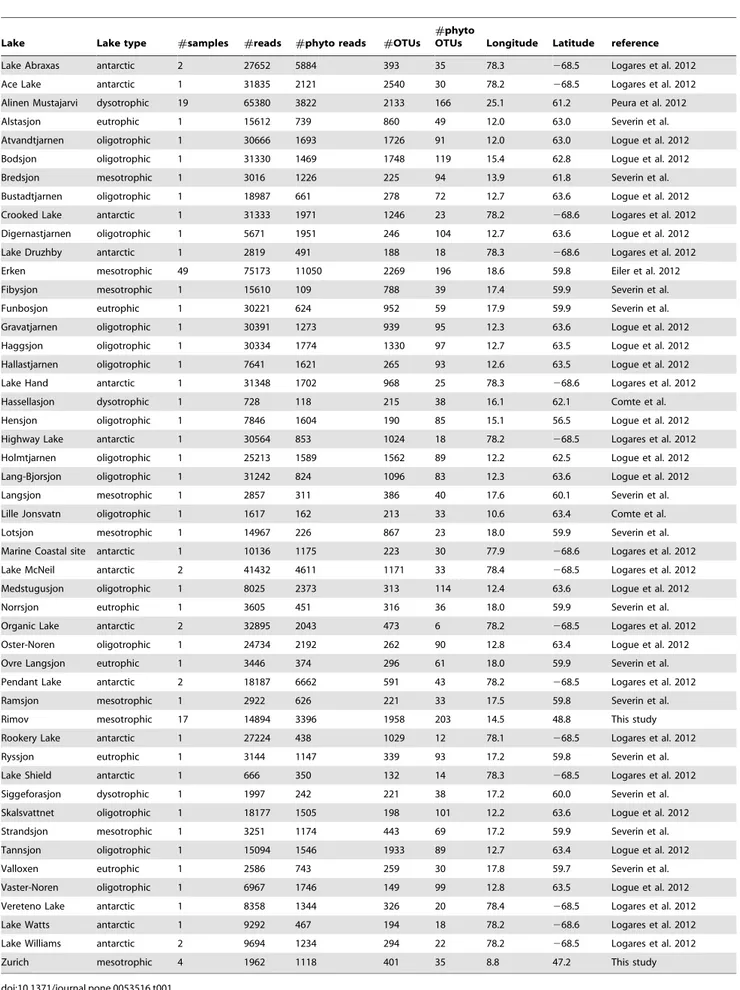
Table 1.Summary statistics of sequencing data including coordinates and classification of systems.
Lake Lake type #samples #reads #phyto reads #OTUs
#phyto
OTUs Longitude Latitude reference
Lake Abraxas antarctic 2 27652 5884 393 35 78.3 268.5 Logares et al. 2012
Ace Lake antarctic 1 31835 2121 2540 30 78.2 268.5 Logares et al. 2012
Alinen Mustajarvi dysotrophic 19 65380 3822 2133 166 25.1 61.2 Peura et al. 2012
Alstasjon eutrophic 1 15612 739 860 49 12.0 63.0 Severin et al.
Atvandtjarnen oligotrophic 1 30666 1693 1726 91 12.0 63.0 Logue et al. 2012
Bodsjon oligotrophic 1 31330 1469 1748 119 15.4 62.8 Logue et al. 2012
Bredsjon mesotrophic 1 3016 1226 225 94 13.9 61.8 Severin et al.
Bustadtjarnen oligotrophic 1 18987 661 278 72 12.7 63.6 Logue et al. 2012
Crooked Lake antarctic 1 31333 1971 1246 23 78.2 268.6 Logares et al. 2012
Digernastjarnen oligotrophic 1 5671 1951 246 104 12.7 63.6 Logue et al. 2012
Lake Druzhby antarctic 1 2819 491 188 18 78.3 268.6 Logares et al. 2012
Erken mesotrophic 49 75173 11050 2269 196 18.6 59.8 Eiler et al. 2012
Fibysjon mesotrophic 1 15610 109 788 39 17.4 59.9 Severin et al.
Funbosjon eutrophic 1 30221 624 952 59 17.9 59.9 Severin et al.
Gravatjarnen oligotrophic 1 30391 1273 939 95 12.3 63.6 Logue et al. 2012
Haggsjon oligotrophic 1 30334 1774 1330 97 12.7 63.5 Logue et al. 2012
Hallastjarnen oligotrophic 1 7641 1621 265 93 12.6 63.5 Logue et al. 2012
Lake Hand antarctic 1 31348 1702 968 25 78.3 268.6 Logares et al. 2012
Hassellasjon dysotrophic 1 728 118 215 38 16.1 62.1 Comte et al.
Hensjon oligotrophic 1 7846 1604 190 85 15.1 56.5 Logue et al. 2012
Highway Lake antarctic 1 30564 853 1024 18 78.2 268.5 Logares et al. 2012
Holmtjarnen oligotrophic 1 25213 1589 1562 89 12.2 62.5 Logue et al. 2012
Lang-Bjorsjon oligotrophic 1 31242 824 1096 83 12.3 63.6 Logue et al. 2012
Langsjon mesotrophic 1 2857 311 386 40 17.6 60.1 Severin et al.
Lille Jonsvatn oligotrophic 1 1617 162 213 33 10.6 63.4 Comte et al.
Lotsjon mesotrophic 1 14967 226 867 23 18.0 59.9 Severin et al.
Marine Coastal site antarctic 1 10136 1175 223 30 77.9 268.6 Logares et al. 2012
Lake McNeil antarctic 2 41432 4611 1171 33 78.4 268.5 Logares et al. 2012
Medstugusjon oligotrophic 1 8025 2373 313 114 12.4 63.6 Logue et al. 2012
Norrsjon eutrophic 1 3605 451 316 36 18.0 59.9 Severin et al.
Organic Lake antarctic 2 32895 2043 473 6 78.2 268.5 Logares et al. 2012
Oster-Noren oligotrophic 1 24734 2192 262 90 12.8 63.4 Logue et al. 2012
Ovre Langsjon eutrophic 1 3446 374 296 61 18.0 59.9 Severin et al.
Pendant Lake antarctic 2 18187 6662 591 43 78.2 268.5 Logares et al. 2012
Ramsjon mesotrophic 1 2922 626 221 33 17.5 59.8 Severin et al.
Rimov mesotrophic 17 14894 3396 1958 203 14.5 48.8 This study
Rookery Lake antarctic 1 27224 438 1029 12 78.1 268.5 Logares et al. 2012
Ryssjon eutrophic 1 3144 1147 339 93 17.2 59.8 Severin et al.
Lake Shield antarctic 1 666 350 132 14 78.3 268.5 Logares et al. 2012
Siggeforasjon dysotrophic 1 1997 242 221 38 17.2 60.0 Severin et al.
Skalsvattnet oligotrophic 1 18177 1505 198 101 12.2 63.6 Logue et al. 2012
Strandsjon mesotrophic 1 3251 1174 443 69 17.2 59.9 Severin et al.
Tannsjon oligotrophic 1 15094 1546 1933 89 12.7 63.4 Logue et al. 2012
Valloxen eutrophic 1 2586 743 259 30 17.8 59.7 Severin et al.
Vaster-Noren oligotrophic 1 6967 1746 149 99 12.8 63.5 Logue et al. 2012
Vereteno Lake antarctic 1 8358 1344 326 20 78.4 268.5 Logares et al. 2012
Lake Watts antarctic 1 9292 467 194 18 78.2 268.6 Logares et al. 2012
Lake Williams antarctic 2 9694 1234 294 22 78.2 268.5 Logares et al. 2012
Zurich mesotrophic 4 1962 1118 401 35 8.8 47.2 This study
doi:10.1371/journal.pone.0053516.t001
phytoplankton OTUs were identified using the NGS based approach with an average 33.8 OTUs in each sample (range 4 to 117). Overall, Heterokonta was the most abundant phylum (28.3% of the reads), followed by Cyanobacteria (21.0%), Cryptophyta (18.3%), Chlorophyta (6.2%), Dinophyta (5.7%). Other phyla including Euglenophyta, Haptophyta and Strepto-phyta contributed less than 1% each. In addition, 16% of the reads were annotated to an unclassified sequence cluster, from now on
termed, USC. The twelve taxa, with the highest proportion of reads in the dataset were (in order of their abundances) annotated as Thalassiosira sp. (Heterokonta), Plagioselmis sp. (Cryptophyta),
Cryptomonas sp. (Cryptophyta), Aulacoseira sp. (Heterokonta),
Dinophysis-related (most likelyPeridiniumandCeratium; Dinophyta),
Cyanobium sp. (Cyanobacteria), Heterosigma-related (most likely
Gonyostomum; Raphidophyceae, Heterokonta), and Microcystis sp., Figure 2. Phylogenetic tree (based on SILVA106 reference tree) showing representative sequences from all phytoplankton-related OTUs.Inner ring indicates the similarity of sequences to the nt/nr database (NCBI) as determined by BLAST search. Outer ring (bars) indicates the number of reads assigned to each node when using the resampled dataset (100 reads); note that nodes where all reads were removed by resampling are still given. Colored branches indicate group assignments from Bayesian classifier against a phytoplankton database.
Synechococcussp. andProchlorococcussp. (all Cyanobacteria; for more detail see Figure 2).
To obtain the position of the USC reads in a phylogenetic framework, sequences were aligned and inserted into the SILVA106 phylogenetic tree. This analysis showed that the USC sequences form a deeply-branching sequence cluster and fall outside previously characterized entries (see Figure 2), but close to Euglenophyta. A Blastn search against the nr/nt databases further corroborate that USC belong to a so far uncharacterized group of photosynthetic eukaryotes at least by 16S rRNA gene standards and is related (up to 95% sequence similarity) to recently amplified single cell genomes of marine protists reported by Martinez-Garcia et al. [35].
System comparison
Among the lakes, cyanobacterial reads dominated in samples from eutrophic systems (45.5%) and were also abundant in oligotrophic lakes (36.0%), while these lakes also featured a high proportion of USC reads (43.4%). Other OTUs affiliated with the USC dominated in humic lakes (32.9%) and were accompanied by almost equal relative amounts of reads (approx 12%) annotated to
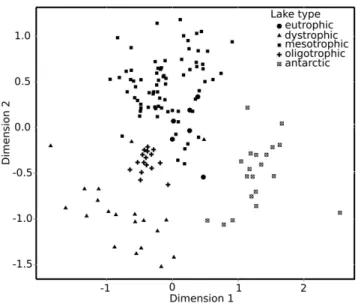
Chlorophyta, Cryptophyta, Cyanobacteria and Heterokonta. In samples from mesotrophic lakes most reads were annotated to Heterokonta (30.1%), Cyanobacteria (23.5%) and Cryptophyta (22.0%). Analysis of phytoplankton community composition by ordination of NGS data confirmed the clear differences described above in phylum composition among systems (see Figure 3). Here, oligotrophic lakes were in the center of the ordination and the other systems were clustered around these nutrient poor systems. Antarctic lakes were clearly different from all others, probably as a result of their saline character and possibly also their geographic location at high latitudes. Disparity between lakes of different trophic status was shown to be significant by permutational MANOVA (p,0.001;R2= 0.246;pseudo-F= 10.861). Posthoc pair-wise comparisons confirmed differences among lake types with mesotrophic and eutrophic lakes showing the least pronounced separation from each other (Table 2 and Figure 3).
Comparison of methods
Seasonal dynamics were analyzed in three lakes using both NGS and microscopy. Samples with both microscopic and NGS data available were 14 for AM, 34 for ER and 16 for RI. Using microscopy the total number of taxa were 58 in AM, 84 in ER and 107 in RI (see Table S2 for a detailed list); the average number of taxa in a sample was 25.5 with a range from 11 to 45. Analyzing the corresponding resampled samples from NGS revealed a total number of 102 OTUs in AM, 122 OTUs in ER and 140 OTUs in RI; on average 20 OTUs per sample were detected with a sampling effort resampled to 100 reads.
Statistical comparisons of seasonal phytoplankton dynamics in the three lakes (AM, ER, RI) by, on the one hand, cell abundance and biovolume data from microscopic counts and, on the other hand, NGS derived read numbers, revealed significant correspon-dence in the dynamics of community composition between the two methods, especially between microscopic abundance and NGS data. Here, both Procrustes superimposition and Mantel’s test were significant (Table 3). Biovolume data showed a lower correspondence with NGS data and was not significant for RI. The correspondence of methods was less clear when comparing taxonomic groups in more detail (Figure 4). Heterokonta, Euglenophyta, Cryptophyta and Dinophyta were overrepresented in the microscopic biovolume data set compared to the NGS data, RI being an exception. A noteworthy 15% of the reads were annotated to USC, which was detected by NGS in all three lakes but was either missed or misclassified by microscopy. Cyanobac-teria were proportionally overrepresented in the NGS dataset when compared to microscopic biovolume data (17.7% and 1.7%, respectively). Additionally, Dinophyta, a major phylum in the microscopic data, was only once detected by NGS in AM whereas it was regularly observed under the microscope. For ER, the Figure 3. Ordination plot showing phytoplankton community
composition among lakes of different trophic status (oligotro-phic, mesotro(oligotro-phic, eutrophic and dystrophic).Stress value was 0.20. Permutational ANOVA confirmed visual inspection of significant differences in community composition between lakes of different status (p,0.001; R2= 0.254).
doi:10.1371/journal.pone.0053516.g003
Table 2.Results of permutational MANOVA comparing the phytoplankton communities among systems with different trophic status.
antarctic oligotrophic mesotrophic eutrophic
Fstats R2 p Fstats R2 p Fstats R2 p Fstats R2 p
oligotrophic 22.14 0.39 .0.001
mesotrophic 17.36 0.16 .0.001 13.62 0.13 .0.001
eutrophic 8.48 0.26 .0.001 8.71 0.3 .0.001 2.56 0.03 .0.007
dysotrophic 10.37 0.21 .0.001 9.71 0.22 .0.001 10.23 0.1 .0.001 3.89 0.13 .0.001
doi:10.1371/journal.pone.0053516.t002
taxonomic profiles corresponded well except for USC and Streptophyta, which were not detected by microscopy and Euglenophyta, which was not detected by NGS. In RI, only Dinophyta, Heterokonta, Cryptophyta and Chlorophyta were detected by both methods; whereas the other phyla were only detected by NGS.
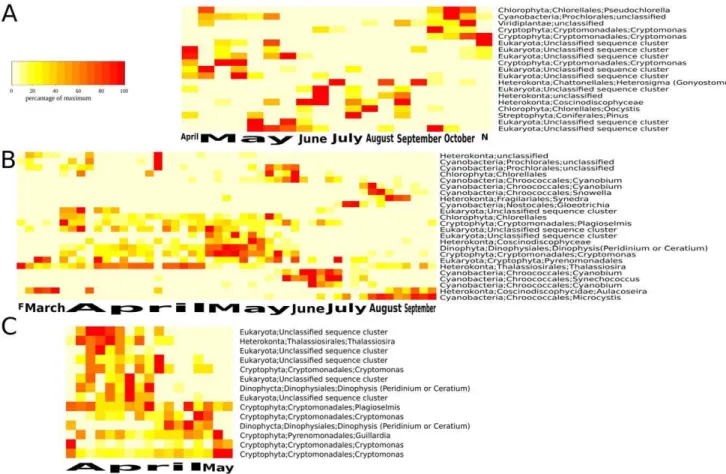
Looking at the dynamics in greater detail revealed further discrepancies but also correspondence between microscopy and NGS data. In AM, high abundance of Cryptophyta belonging to the genusCryptomonaswas observed from early spring to the late summer in the NGS data (Figure 5). An increase in the proportion of diatoms (Heterokonta) during late summer and their high abundance in late autumn was observed, whereas Chlorophyta and Cyanobacteria were negligible in this lake. The microscopic analysis showed a different pattern. Chlorophyta and Heterokonta (especially chrysophytes) were dominant during all seasons. Most other groups, including Cyanobacteria, were scarce. Similar to the NGS, microscopy revealed that Cryptomonas sp. was an abundant taxon and present in 93% of the lake samples. The other dominate taxa in the microscopy dataset were (in order of their abundance)
Oocystis sp, Scourfieldia cordiformis (Chlorophyta), Chrysococcus sp.,
Pseudopedinella sp., Monomastix sp. (Heterokonta), Koliella longiseta,
Monoraphidium sp., Chlamydomonas sp. (Chlorophyta), Rhabdoderma
sp. (Cyanobacteria), Uroglena sp., Mallomonas lychenensis, (Hetero-konta) andGymnodiniumsp. (Dinophyta). Note also that the NGS approach was able to pick up sequences from pollen of the tree
Pinus(Figure 5a). Pollen were commonly found but not counted in phytoplankton analyses based on microscopy.
For ER, the NGS data showed that the succession started with a
Cryptomonasbloom after ice-off immediately followed by a diatom bloom in spring (Figure 5b). Later during the season, aGloeotrichia
bloom was observed in July followed by a Microcyctis bloom in autumn. NGS data also indicated a high proportion of various putative single celled picocyanobacteria during the decline of the spring peak (June/July; Figure 5), which was overlooked in the microscopic analyses. Otherwise the NGS patterns were con-firmed by the microscopy data as: Heterokonta were important in spring (mainly diatoms); bloom forming Cyanobacteria dominated in summer and autumn; Cryptophyta and chrysophytes (Hetero-konta) were abundant groups throughout the year. The most abundant taxa based on microscopy were Aphanocapsa sp. (Cyanobacteria). Other abundant Cyanobacteria wereAphanocapsa elachistaandCoelosphaerium kuetzingianum. Unidentified chrysophytes were also abundant as wereChrysococcussp.,Aulacoseira granulata var. angustissimaandA. islandica,Asterionella formosaandDinobryonsp. all from the group Heterokonta. Cryptomonassp. andRhodomonas sp. were abundant cryptophytes, and Chrysochromulina parvafrom the
group Haptokonta were also among the most abundant taxa in this lake.
For RI, the peak ofChlamydomonas sp. under ice, as shown by NGS (Figure 5c), was also confirmed by microscopy. Chlamydomo-nas sp. was then replaced by Cryptophyta (Rhodomonas minuta,
Cryptomonassp.) and Chrysophyta (Synurasp., Chrysococcussp.) and later in April by Haptophyta (Chrysochromulina parva) which form the spring maximum of biomass, as demonstrated by microscopy. The end of the sampling period was characterized by decreasing phytoplankton biomass dominated mostly by Cryptophyta. These complex patterns in Cryptophyta are reflected in the NGS data even though taxonomic assignments did not entirely correspond with that invoked by microscopic identification. Unidentified flagellates accounted for 0.3–17% of the total phytoplankton biomass, which could possibly be linked to the high presence of USC in RI as revealed by NGS.
Discussion
Phytoplankton as primary producers, are directly using nutri-ents as a resource and are therefore early responders to environmental changes, making them especially suitable as eutrophication indicators. Our massive NGS dataset from 46 lakes revealed a clear separation of the phytoplankton communi-ties from lakes of different trophy suggesting that this metric has potential as a tool for water quality status assessments. Thus, providing the means to efficiently monitor one of the main environmental problems in surface waters; eutrophication. Pico-phytoplankton are particularly useful as early indicators of increase in phosphorus concentration [36,37] for marine as well as freshwater systems [38]. These small and often fragile organisms could be tracked and taxonomically highly resolved using the NGS based approach. It is also encouraging that seasonal patterns revealed by NGS data resembled well-described patterns from microscopy based observations in the three lakes where we had time series data (Table 3). Potential toxic cyanobacterial genera such as Gloeotrichia, Microcystis and Plankthotrix were resolved and tracked over time (Figure 5). To further track the frequency and intensity of toxic algal blooms, frequent sampling is imperative and this seems feasible with NGS based approaches.
A critical view on the method
Rarefaction curves clearly show that our sampling efforts only scratched the surface of the phytoplankton diversity present in most studied systems. Increasing sampling efforts can provide a deeper insight into these communities, but this is limited by the actual proportion of phytoplankton 16S rRNA genes in the total pool of amplified 16S rRNAs in a sample. As visualized in Table 3.Results from Procrustes superimposition and Mantel’s test to test for correspondence among methods.
mantel’s test procrustes superimposition
Testing 454 data against R p R p
AM biovolumes 0.259 ,0.013 0.851 ,0.012
AM abundances 0.26 ,0.007 0.89 ,0.005
ER biovolumes 0.268 ,0.001 0.756 ,0.001
ER abundances 0.532 ,0.001 0.842 ,0.001
RI biovolumes 0.083 0.289 0.617 0.371
RI abundances 0.654 ,0.001 0.922 ,0.001
figure 1A, the ratio of phytoplankton to total reads was above 1/20 (black slope) in 64% of the samples. Meaning that a sampling effort of at least 20,000 reads per sample in our study would have resulted in 64% of our samples having 1000 or more phytoplank-ton reads. By obtaining a sequencing depth of 100,000 reads per sample, the number of samples with 1000 or more phytoplankton reads would have increased to 94% (ratio 1/100 as represented by the red line). Aiming for 20,000 reads per sample will result in 98% of the samples having at least 100 phytoplankton reads as indicated by our dataset. Exactly how many reads per sample would be needed for robust estimates of trends in community composition and diversity among samples is not known with any certainty. We expect that this will be explored to a greater extent
in coming publications, similar to other studies of bacterial diversity [39]. The importance of sampling depth when describing a community is, however, not a problem only in NGS based approaches, but is relevant also for microscopy based techniques. We expect that the potential for deep sampling is greater with NGS especially considering recent improvements in for example Illumina based sequencing technology [40].
The weaker correspondence of NGS data to microscopic biovolume estimates compared to abundances (Table 3) is likely explained by variations in the number of chloroplasts per cell (and corresponding number of 16S rRNA amplicons) since chloroplast numbers poorly reflect cell size [41,42]. Further, a difference in taxonomic composition between NGS and morphological based data cannot be avoided (Figure 4). For NGS data, biases are introduced by the DNA extraction and PCR procedures [43,44]. Underrepresentation of taxa in the microscopy samples can be because of 1) taxon-specific cell-losses during preservation or handling reported previously for protists [45]; 2) misleading or low resolution microscopic identification if cells are missing characters, for example akinetes for some Cyanobacteria, or flagella that may be lost or are hidden behind cells; 3) diatoms are almost impossible to discriminate based on morphological identifica-tions without appropriate preparation; 4) as sedimentation chambers are commonly used, small cells that do not sink fast enough will be counted to a lesser extent or missed altogether. Thus, in summary, discrepancies between the two types of methods exist. Future research should seek to optimize and standardize all steps for an objective assessment of true diversity. For instance, the underrepresentation of certain taxa in some NGS samples (lake AM) can be partly explained by prefiltration with 50mm sieves, excluding macrosized phytoplank-ton. Omitting this step is recommended in future studies.
Moreover, we are in the middle of revising the phylogeny of many phytoplankton groups. For example in diatoms [46], Cyanobacteria [47,48] and green algae [49] paraphyletic and polyphyletic groups are found based on new genetic information. Comparisons of phenotypic (morphological) and genetic analyses are also hampered by contradic-tions between morphological and gene-based classification systems.
Novel taxa and taxon resolution
Our analyses identified potential novel taxa and the lack of sequenced freshwater taxa in current databases. A BLASTn search revealed that more than 50% of the cyanobacteria and chloroplast reads in our dataset have no closely related neighbor (more than 97% similarity to a database entry) among 16S rRNA sequences from isolated phytoplankton strains (for more details see Figure 2). Many of the most abundant OTUs in our dataset were most closely related to database entries of marine phytoplankton (for example Dinophysis,
Heterosigma,Prochlorococcus) which are well represented in 16S rRNA databases. This clearly shows that our current database does not cover most freshwater phytoplankton species. Even at a cutoff of 90% similarity, 1% of the reads were not similar to any sequence entry. In addition, recent efforts to sequence the microbes of the ocean has already revealed many phytoplankton taxa that have been previously missed by microscopy [9,50,51] and our study suggests that the same is most likely true also for lakes as indicated by the detection of USC. Barcoding of the cultured and characterized freshwater taxa have to be expanded before we can compare results from environmental surveys and can be sure about the existence of novel species or even phyla that have been missed so far.
Phylogenetic analysis also shows that taxonomic resolution provided by the 16S rRNA gene of chloroplasts can at best provides classification to the genus level. Another marker gene that has been used as a pre-marker for protists is the 18S rRNA gene [52] which provides superior resolution compared to the 16S rRNA gene of the plastids but at the cost of missing out on Cyanobacteria [8,53]. We therefore suggest a Figure 4. Boxplot showing ratios in taxonomic composition (at
phylum level) as revealed by next generation sequencing (NGS) vs. microscopy.Plots show the ratio between relative reads numbers and biovolumes (as determined by microscopy) for each phylum. (AM) Alinen Mustajarvi, (ER) Lake Erken, and (RI) Rimov Reservoir. A ratio above zero indicates that a specific phylum is preferentially detected by NGS whereas a ratio below zero indicates an over representation in the biovolume data relative to NGS. The part of the plot indicated in grey represents the area where the ratio is the result of that a phylum was only detected by either method. doi:10.1371/journal.pone.0053516.g004
hierachical approach by first targeting the variable region V3–V4 of the 16S rRNA gene as exemplified by this study. This reveals bacterial and most eukaryotic organisms with plastids using a single analysis and can then be coupled to a method with higher taxonomic resolution and deeper sampling of the eukaryotic (protist) diversity such as a 18S rRNA gene based second step analysis [54,55]. Specific groups of protists can then be targeted with more specific markers providing high (maybe equal to species) resolution.
Outlook
There is a need for improvement in environmental monitoring, both because of international regulations and because of public concern about blooms of toxic or nuisance algae and other environmental pressures. Our analyses suggest that NGS-based characterization of 16S rRNA genes hold great promise as tools for phytoplankton monitoring as it allows the simultaneous monitoring of bacteria and most eukaryotes with plastids in a high-throughput, reproducible and cost-efficient manner. Still, many challenges lay ahead before NGS based methods can be implemented in monitoring programs. Furthermore, NGS based approaches will of course only be semi-quantitative. Barcoding initiatives and thorough systematics using both genetic and morphological information will be required to improve sequence databases and existing taxonomic frameworks for tracking phytoplankton groups and monitor phytoplankton communities by NGS facilitated approaches. The use of alternative marker genes but also multiplexing need to be explored to improve taxonomic resolution. Most importantly, taxonomists and
molec-ular biologists must come together and move the field forward to fully embrace and exploit NGS technologies for phytoplankton ecology and the quality management of inland waters.
Supporting Information
Table S1 Metadata of 259 lakes available to this study including 139 samples used in the analyses of this study.
(XLS)
Table S2 List of taxa found from Lakes Alinen Mustaja¨rvi (AM), Erken (ER) and Rˇ ı´mov (RI) when analyzing phytoplankton samples by microscopy.
(DOC)
Acknowledgments
We are grateful to Ester Eckert, Thomas Posch, Ramiro Logares, Sami Taipale, Ina Severin, Jurg B. Logue and Jerome Comte for help with sampling, and for providing additional data for some of the lakes. We thank E. Zapomeˇlova´ and Minna Hiltunen for counting phytoplankton in RI and AM, respectively. We also want to thank the Uppsala Multidisciplinary Center for Advanced Computational Science (UPPMAX) for help with data storage and analysis.
Author Contributions
Contributed data: ESL JP KS PZ SB SP YY. Conceived and designed the experiments: AE. Analyzed the data: AE SD CR. Wrote the paper: AE SD SB ESL.
Figure 5. Heatmap showing temporal dynamics of phytoplankton taxa in dystrophic Lake Alinen Mustaja¨rvi (A), mesotrophic Lake Erken (B), and mesotrophic reservoir Rimov (C) as revealed by next generation sequencing.Colors indicate the abundance of each taxon at each time point in relation to its maximum abundance in the respective time-series.
References
1. Malone TC (1971) The relative importance of nanoplankton and netplankton as primary products in tropical oceanic and neritic phytoplankton communities. Limnol Oceanogr 16: 633–639.
2. Arrigo KR (2005) Marine microorganisms and global nutrient cycles. Nature 437: 349–355.
3. Sommer U (1985) Comparison between steady-state and non-steady state competition – experiments with natural phytoplankton. Limnol Oceangr 30: 335–346.
4. Paerl HW, Huisman J (2008) Climate - Blooms like it hot. Science 420: 57–58. 5. Posch T, Ko¨ster O, Salcher MM, Pernthaler J (2012) Harmful filamentous cyanobacteria favoured by reduced water turnover with lake warming. Nature Climate Change 8: doi:101038/nclimate1581.
6. Medlin LK, Metfies K, Mehl H, Wiltshire K, Valentin K (2006) Picoeukaryotic plankton diversity at the Helgoland time series site as assessed by three molecular methods. Microb Ecol 52: 53–71.
7. Galluzzi L, Penna A, Bertozzini E, Vila M, Garce´s E, et al. (2004) Development of a real-time PCR assay for rapid detection and quantification of Alexandrium minutum (a dinoflagellate). Appl Environ Microbiol 70: 1199–1206. 8. Joo S, Lee S-R, Park S (2010) Monitoring of phytoplankton community structure
using terminal restriction fragment length polymorphism (T-RFLP). J Microbiol Meth 81: 61–68.
9. Treusch AH, Demir-Hilton E, Vergin KL, Worden AZ, Carlson CA, et al. (2012) Phytoplankton distribution patterns in the northwestern Sargasso Sea revealed by small subunit rRNA genes from plastids. ISME J 6: 481–492. 10. Sogin ML, Morrison HG, Huber JA, Welch MD, Huse SM, et al. (2006)
Microbial diversity in the deep sea and the underexplored ‘‘rare biosphere’’. Proc Natl Acad Sci U S A 32: 12115–12120.
11. Andersson AF, Riemann L, Bertilsson S (2010) Pyrosequencing reveals contrasting seasonal dynamics of taxa within Baltic Sea bacterioplankton communities. ISME J 4: 171–181.
12. Moon-van der Staay SY, De Wachter R, Vaulot D (2001) Oceanic 18S rDNA sequences from picoplankton reveal unsuspected eukaryotic diversity. Nature 409: 607–610.
13. Herlemann DPR, Labrenz M, Jurgens K, Bertilsson S, Waniek JJ, et al. (2011) Transitions in bacterial communities along the 2000 km salinity gradient of the Baltic Sea. ISME J 5: 1571–1579.
14. Logares R, Lindstro¨m ES, Langenheder S, Logue JB, Paterson H, et al. (2012) Biogeography of bacterial communities exposed to long-term environmental change. The ISME journal.
15. Eiler A, Heinrich F, Bertilsson S (2011) Coherent dynamics and association networks among lake bacterioplankton taxa. ISME J 6: 330–342.
16. Logue JB, Langenheder S, Andersson AF, Bertilsson S, Drakare S, et al. (2012) Freshwater bacterioplankton richness in oligotrophic lakes depends on nutrient availability rather than on species-area relationships. ISME J 6:1127–1136. 17. Peura S, Eiler A, Bertilsson S, Nykanen H, Tiirola M, et al. (2012) Distinct and
diverse anaerobic bacterial communities in boreal lakes dominated by candidate division OD1. ISME J 6: 1640–1652.
18. Galand PE, Casamayor EO, Kirchman DL, Potvin M, Lovejoy C (2009) Unique archaeal assemblages in the Arctic Ocean unveiled by massively parallel tag sequencing. ISME J 3: 860–869.
19. Bolhuis H, Stal LJ (2011) Analysis of bacterial and archaeal diversity in coastal microbial mats using massive parallel 16S rRNA gene tag sequencing. ISME J 5: 1701–1712.
20. Stoeck T, Behke A, Christen R, Amaral-Zettler L, Rodriguez-Mora MJ, et al. (2009) Massively parallel tag sequencing reveals the composition of anaerobic marine protistan communities. BMC Biol 7: 72.
21. Lund JWG, Kipling C, Cren ED (1958) The inverted microscope method of estimating algal numbers and the statistical basis of estimations by counting. Hydrobiologia 11: 143–170.
22. Hillebrandt H, Durselen C-D, Kirschtel D, Pollingher U, Zohary T (1999) Biovolume calculation for pelagic and benthic microalgae. J Phycol 35: 403–424. 23. Griffiths RI, Whiteley AS, O’Donnell AG, Bailey MJ (2000) Rapid method for coextraction of DNA and RNA from natural environments for analysis of ribosomal DNA- and rRNA-based microbial community composition. Appl Environ Microbiol 66: 5488–5491.
24. Quince C, Lanzen A, Davenport RJ, Turnbaugh PJ (2011) Removing noise from pyrosequenced amplicons. BMC Bioinformatics 12: doi: 01186/1471-2105-12-38.
25. Wang Q, Garrity GM, Tiedje JM, Cole JR (2007) Naıve Bayesian classifier for rapid assignment of rRNA sequences into the new bacterial taxonomy. Appl Environ Microbiol 73: 5261–5267.
26. MacDonald D, Price MN, Goodrich J, Nawrocki EP, DeSanits TZ, et al. (2012) An improved Greengenes taxonomy with explicit ranks for ecological and evolutionary analyses of bacteria and archaea. ISME J 6: 610–618. 27. Schloss PD, Westcott SL, Ryabin T, Hall JR, Hartmann M, et al. (2009)
Introducing Mothur: open- source, platform-independent, community-support-ed software for describing and comparing microbial communities. Appl Environ Microbiol 75: 7537–7541.
28. Pruesse E, Quast C, Knittel K, Fuchs B, Ludwig W, et al. (2007) SILVA: a comprehensive online resource for quality checked and aligned ribosomal RNA sequence data compatible with ARB. Nucleic Acid Res 35:7188–7196.
29. Ludwig W, Strunk O, Westram R, Richter L, Meier H, et al. (2004) ARB: a software environment for sequence data. Nucleic Acids Res 32: 1363–1371. 30. Edgar CE (2010) Search and clustering orders of magnitude faster than BLAST.
Bioinformatics doi: 10.1093/bioinformatics/btq461.
31. Gilbert JA, Field D, Swift P, Newbold L, Oliver A, et al. (2009) The seasonal structure of microbial communities in the Western English Channel. Environ Microbiol 11: 3132–3139.
32. R Development Core Team (2011) R: A Language and Environment for Statistical Computing R Foundation for Statistical Computing: Vienna, pp. 2630.
33. Oksanen J, Kindt R, Legendre P, O’Hara B, Simpson GL, et al. (2008) Vegan: Community Ecology Package.
34. Olrik K, Blomqvist P, Brettum P, Cronberg G, Eloranta P (1998) Methods for quantitative assessment of phytoplankton in freshwaters, part I. Swedish EPA Report 4860, Naturva˚rdsverket Flag.
35. Martinez-Garcia M, Brazel D, Poulton NJ, Swan BK, Gomez ML, et al. (2012) Unveilingin situinteractions between marine protists and bacteria through single cell sequencing. ISME J 6: 703–707.
36. Stockner JG (1991) Autotrophic picoplankton in freshwater ecosystems: the view from the summit. Int Rev ges Hydrobiol 76: 483–492.
37. Schallenberg M, Burns CW (2001) Tests of autotrophic picoplankton as early indicators of nutrient enrichment in an ultra-oligotrophic lake. Freshwater Biol 46: 27–37.
38. Bell T, Kalff J (2001) The contribution of picophytoplankton in marine and freshwater systems of different trophic status and depth. Limnol Oceanogr 46: 1243–1248.
39. Lundin D, Severin I, Logue JB, O¨ stman O¨ , Andersson AF, et al. (2012) Which sequencing depth is sufficient to describe patterns in bacterial a and b diversity? Environ Microbiol Reports 4: 367–372.
40. Caporaso JG, Lauber CL, Walters WA, Berg-Lyons D, Lozupone CA, et al. (2011) Global patterns of 16S rRNA diversity at a depth of millions of sequences per sample. Proc Natl Acad Sci U S A 108: 4516–4522.
41. Capblancq J, Catalan J (1994) Phytoplankton: which, and how much? In Margalef, R (ed), Limnology Now: A Paradigm of Planetary Problems Elsevier Science, Amsterdam. pp. 9–36.
42. Llewellyn CA, Gibbs SW (2000) Intra-class variability in the carbon, pigment and biomineral content of prymnesiophytes and diatoms. Mar Ecol Prog Ser 193: 33–44.
43. Martin-Laurent F, Philippot L, Hallet S, Chaussod R, Germon JC, et al. (2001) DNA extraction from soils: Old bias for new microbial diversity analysis methods. Appl Environ Microbiol 67: 2354–2359.
44. Acinas SG, Sarma-Rupavtarm R, Klepac-Ceraj V, Polz MF (2005) PCR-induced sequence artifacts and bias: Insights from comparison of two 16S rRNA clone libraries constructed from the same sample. Appl Environ Microbiol 71:8966–8969.
45. Ngando TS, Groliere CA (1991) Effets quantitatifs des Fixateurs sur la Conservation des Cille´s Planctoniques d’Eau Douce. Arch Protist 140: 109–120. 46. Theriot EC, Ashworth M, Ruck E, Nakov T, Jansen RF (2010) A preliminary multigene phylogeny of the diatoms (Bacillariophyta): challenges for future research. Plant Ecol Evol 143: 278–296.
47. Gugger M, Lyra C, Henriksen P, Coute´ A, Humbert J-F, et al. (2002) Phylogenetic comparison of the cyanobacterial generaAnabaenaand Aphanizo-menom. Int J Syst Evol Microbiol 52: 1867–1880.
48. Zapomeˇlova´ E, Jezberova´ J, Hrouzek P, Hisem D, Rˇ eha´kova´ K, et al. (2009) Polyphasic characterization of three strains ofAnabaena reniformisand Aphanizo-menon aphanizomenoides(cyanobacteria) and their re-classification toSphaerospermum
gen nov (incl Anabaena kisseleviana). J Phycol 45: 1363–1373.
49. Leliaert F, Smith DR, Moreau H, Herron MD, Verbruggen H, et al. (2012) Phylogeny and molecular evolution of the green algae. Critical Reviews in Plant Science 31:1–46.
50. Diez B, Pedros-Alio C, Massana R (2001) Study of Genetic Diversity of Eukaryotic Picoplankton in Different Oceanic Regions by Small-Subunit rRNA Gene Cloning and Sequencing. Appl Environ Microbiol 67: 2932–2941. 51. Massana R, Giullou L, Diez B, Pedros-Alio C (2002) Unveiling the Organisms
behind Novel Eukaryotic Ribosomal DNA Sequences from the Ocean. Appl Environ Microbiol 68: 4554–4558.
52. Pawlowski J, Audic S, Adl S, Bass D, Belbahri L, et al. (2012). CBOL Protist Working Group: barcoding eukaryotic richness beyond the animal, plant and fungal kingdoms. PLoS Biology. 10(11): e1001419
53. Zhou F, Massana R, Not F, Marie D, Vaulot D (2005) Mapping of picoeucaryotes in marine ecosystems with quantitative PCR of the 18S rRNA gene. FEMS Microbiol Ecol 52: 79–92.
54. Zimmermann J, Jahn R, Gemeinholzer B (2011) Barcoding diatoms: evaluation of the V4 subregion on the 18S rRNA gene, including new primers and protocols. Org Divers Evol DOI 10.1007/s13127-011-0050-6
55. Logares R, Audic S, Santini S, Pernice MC, de Vargas C, et al. (2012) Diversity patterns and activity of uncultured marine heterotrophic flagellates unveiled with pyrosequencing. ISME J 6: 1823–1833.