Building a Robust Tumor Profiling Program:
Synergy between Next-Generation
Sequencing and Targeted Single-Gene
Testing
Matthew C. Hiemenz1☯¤a, Stephan Kadauke2☯¤b, David B. Lieberman1, David B. Roth1, Jianhua Zhao1, Christopher D. Watt1, Robert D. Daber1¤a‡
, Jennifer J. D. Morrissette1‡*
1Center for Personalized Diagnostics, Department of Pathology and Laboratory Medicine, Hospital of the University of Pennsylvania, Philadelphia, Pennsylvania, United States of America,2Medical Scientist Training Program, Perelman School of Medicine at the University of Pennsylvania, Philadelphia, Pennsylvania, United States of America
☯These authors contributed equally to this work.
¤a Current address: BioReference Laboratories, Elmwood Park, New Jersey, United States of America ¤b Current address: Department of Pathology, Massachusetts General Hospital, Boston, Massachusetts, United States of America
‡These authors also contributed equally to this work
Abstract
Next-generation sequencing (NGS) is a powerful platform for identifying cancer mutations. Routine clinical adoption of NGS requires optimized quality control metrics to ensure accu-rate results. To assess the robustness of our clinical NGS pipeline, we analyzed the results of 304 solid tumor and hematologic malignancy specimens tested simultaneously by NGS
and one or more targeted single-gene tests (EGFR,KRAS,BRAF,NPM1,FLT3, andJAK2).
For samples that passed our validated tumor percentage and DNA quality and quantity thresholds, there was perfect concordance between NGS and targeted single-gene tests
with the exception of twoFLT3internal tandem duplications that fell below the stringent
pre-established reporting threshold but were readily detected by manual inspection. In addition, NGS identified clinically significant mutations not covered by single-gene tests. These find-ings confirm NGS as a reliable platform for routine clinical use when appropriate quality con-trol metrics, such as tumor percentage and DNA quality cutoffs, are in place. Based on our findings, we suggest a simple workflow that should facilitate adoption of clinical oncologic NGS services at other institutions.
Introduction
The advance of next-generation sequencing (NGS) is a cornerstone of a recent development in molecular pathology, variably referred to as“personalized,” “precision,”or“individualized” medicine. Much of the focus of clinical NGS has been on oncology, as there are clear OPEN ACCESS
Citation:Hiemenz MC, Kadauke S, Lieberman DB, Roth DB, Zhao J, Watt CD, et al. (2016) Building a Robust Tumor Profiling Program: Synergy between Next-Generation Sequencing and Targeted Single-Gene Testing. PLoS ONE 11(4): e0152851. doi:10.1371/journal.pone.0152851
Editor:Bibekanand Mallick, National Institute of Technology, Rourkela, INDIA
Received:February 13, 2015
Accepted:March 21, 2016
Published:April 4, 2016
Copyright:© 2016 Hiemenz et al. This is an open access article distributed under the terms of the
Creative Commons Attribution License, which permits unrestricted use, distribution, and reproduction in any medium, provided the original author and source are credited.
Data Availability Statement:Raw deep sequencing cannot be provided because these data are derived from patient samples. Because of the Minimum Necessary Requirement of the HIPAA Privacy Rule these data may not be deposited into a public repository. A Supporting Information File accompanying the submission contains the de-identified results and interpretations of all clinical NGS tests included in our analysis next to the results of single-gene testing of the same specimen.
diagnostic, prognostic, and therapeutic implications for a multitude of genomic mutations in both solid and liquid malignancies. For example, in non-small cell lung cancers, activating mutations of theEGFRgene predict therapeutic response to tyrosine kinase inhibitors (TKI) such as erlotinib, gefitinib, and afatinib [1–3]. The KRAS protein acts downstream of EGFR, and thus mutations of theKRASgene predict resistance to TKI [2,4–6]. In metastatic mela-noma,BRAFV600 mutations predict response to dabrafenib, vemurafenib, and trametinib [7].
Mutations of theFLT3andNPM1genes affect the prognosis of karyotypically normal acute myeloid leukemia and aid in the decision whether or not to pursue hematopoietic stem cell transplantation [8]. In addition, activating mutations ofJAK2, which encodes a tyrosine kinase essential for cytokine and growth factor signaling, are found in a large proportion of patients with myeloproliferative neoplasms [9]. Ruxolitinib is a JAK1/JAK2 inhibitor approved for the treatment of myelofibrosis [10], and additional JAK2 inhibitors are in clinical development [11].
Detection of mutations inEGFR,KRAS,BRAF,FLT3,NPM1, andJAK2is most commonly
accomplished by targeted tests that are designed to detect one or at most a small number of mutations in a single gene. However, NGS is gaining momentum as a complementary test for a number of reasons. Firstly, clinical trials for targeted cancer therapies rely on detection of mutations that are frequently not covered by existing targeted tests. In contrast to the laborious and lengthy process of validating and implementing a new molecular assay testing for one or a few mutations, NGS greatly simplifies the task of providing coverage of one of more additional mutations of interest. Secondly, targeted tests can provide misleading results. For example, the widely used FDA-approved cobas1EGFRMutation Test only detects exon 19 deletion and
L858R mutations, which together only comprise the mutations found in 85% ofEGFR-mutated lung cancers [12]. In a significant proportion of cases, this test fails to identify therapeutically targetable mutations. Thirdly, targeted tests may fail to detect the very mutation they are designed to detect. Our group has recently reported a striking failure of two separate single-gene tests for theBRAFgene to detect a V600E mutation in a melanoma specimen [13]. The mutation was clearly demonstrated by concurrent NGS analysis. Finally, as has recently become apparent, tumors frequently harbor mutations that are therapeutically targetable but are not typically seen in that tumor type. Due to its massively parallel nature, NGS is very well-suited for detecting mutations in unexpected genes. One study reported a three-fold increased yield of clinically actionable mutations with NGS as compared to traditional molecular approaches targeting mutation hotspots [14].
Multiple recent studies have investigated the potential utility of NGS for detection of clini-cally actionable cancer mutations with encouraging results [14–25]. With the exception of one study [21], all demonstrated excellent performance of NGS on various platforms as measured by detection of point mutations and small insertions and deletions (indels). In many cases, additional potentially important variants were uncovered by NGS. All of the aforementioned studies were designed to validate clinical NGS pipelines that were not yet in clinical practice. As a consequence, they enrolled selected samples from previously examined specimens. With the exception of one commercially-sponsored study [14], in all cases a very limited number of samples was re-examined (range 13–61), often from only a single tissue type. While these important contributions confirm the potential usefulness of clinical NGS, they do not address the important question whether a well-validated NGS pipeline performs at an acceptable level in day-to-day clinical practice. Here we present a summative analysis of mutation results and quality control metrics obtained during the first year (March 2013 through March 2014) of clinical solid and liquid malignancy NGS carried out at the Center for Personalized Diagnostics at the University of Pennsylvania Health System. More than 900 specimens were submitted and processed during this time frame. We report that using our validated molecular and Competing Interests:The authors have declared
bioinformatics pipeline [26] with pre-determined tumor percentage and DNA quality cutoffs, we achieved excellent NGS data quality as determined by virtually perfect concordance between NGS and targeted single-gene tests for various genes in a large number of solid and liquid malignancy specimens.
Materials and Methods
Specimen Characteristics and Processing
Over the course of the study duration, 938 liquid and solid tumor specimens were submitted to the Center for Personalized Diagnostics (Table 1). Specimens were eligible for NGS if they passed the tumor percentage, DNA quality, and DNA quantity thresholds that had been determined at the time of the validation of the NGS assay, which preceded the study period. Briefly, specimens with
<10% tumor were not eligible for NGS, because sequencing of samples with lower tumor
percent-ages frequently yielded changes that were represented in fewer than five unique reads, making it difficult to distinguish true variants from sequencing artifacts. For similar reasons, DNA quality and quantity were judged to be insufficient, and the specimen was ineligible for NGS, if the DNA concentration was<1 ng/μL; the DNA concentration was<5 ng/μL with>20% DNA degraded;
the DNA concentration was<50 ng/μL with>45% DNA degraded; or DNA degradation was >60%. Degraded DNA was defined as the proportion of DNA under 1000 bp in length.
To determine the tumor percentage and volume of solid tumors, hematoxylin- and eosin-stained tissue specimens were evaluated by an anatomic pathologist, and the region with the highest tumor burden was marked. Genomic DNA was extracted from fresh bone marrow or peripheral blood using the Gentra Puregene Cell Kit (Qiagen, Netherlands). For formalin-fixed, paraffin-embedded (FFPE) specimens, tissues were macro-dissected from 5μM or 10μM
slides. Scrapings were dewaxed with Qiagen Deparaffinization Solution and purified with Gen-tra Puregene Tissue reagents following the manufacturer’s protocol (Qiagen, Netherlands). DNA quantification was performed using the Qubit Broad Range assay following manufactur-er’s protocols (Life Technologies, CA). Agilent Genomic TapeScreens were used following manufacturer’s protocols to assess the degree of DNA degradation (Agilent, CA).
Targeted Molecular Testing
EGFR,KRAS, andBRAFAssays. The mutational status ofEGFRexons 19 and 21 was determined using a laboratory-developed test (LDT) as previously described [27]. Briefly,
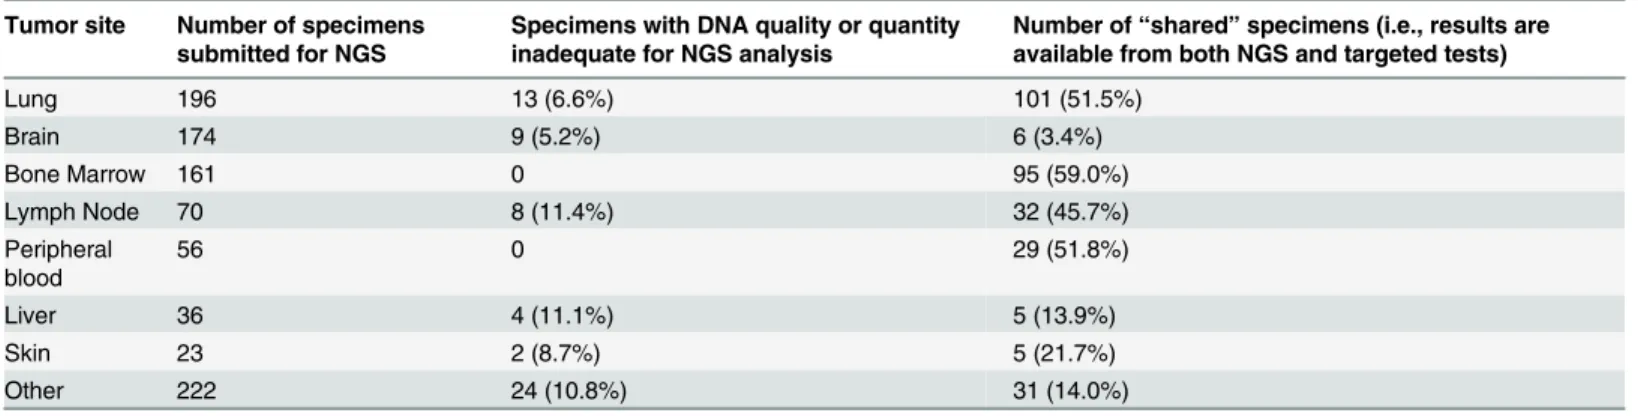
Table 1. Characteristics of Specimens by Tumor Site.
Tumor site Number of specimens submitted for NGS
Specimens with DNA quality or quantity inadequate for NGS analysis
Number of“shared”specimens (i.e., results are available from both NGS and targeted tests)
Lung 196 13 (6.6%) 101 (51.5%)
Brain 174 9 (5.2%) 6 (3.4%)
Bone Marrow 161 0 95 (59.0%)
Lymph Node 70 8 (11.4%) 32 (45.7%)
Peripheral blood
56 0 29 (51.8%)
Liver 36 4 (11.1%) 5 (13.9%)
Skin 23 2 (8.7%) 5 (21.7%)
Other 222 24 (10.8%) 31 (14.0%)
Tumor site is not necessarily tissue of origin. Please note that in contrast to solid tumor specimens, all liquid specimens (bone marrow and peripheral blood) were adequate for NGS processing.
genomic DNA was extracted from FFPE tissue and amplified with primers covering two regions, one that is commonly deleted in exon 19, and a part of exon 21 that encompasses codon 858. The L858R missense mutation in exon 21 creates a newSau96I cleavage site within exon 21. The amplification products were digested withSau96I and then separated by capillary
electrophoresis.
KRASmutations in codons 12 and 13 were assayed using a LDT as previously described
[28]. Briefly, genomic DNA was extracted and amplified using primers designed to detect point mutations, hybridized to target-specific capture probes, and subjected to a bead assay (Lumina, TX).
BRAFmutations were assayed by pyrosequencing of an amplified portion of theBRAFgene
including codon 600, as previously described [29].
FLT3Assay. DNA was extracted using the QIAamp DNA Blood Mini Kit (Qiagen, Neth-erlands). Mutation analysis of theFLT3gene was performed using multiplex PCR amplifica-tion with two sets of fluorescently labeled primers. For internal tandem duplicaamplifica-tion (ITD) detection, PCR was performed with the following primers: 5’-GCA ATT TAG GTA TGA AAG CCA GC-3’(forward) and 5’-CTT TCA GCA TTT TGA CGG CAA CC-3’(reverse); forward primers were labeled with 6-carboxyfluorescin (6-FAM), and reverse primers were labeled with VIC. An internal tandem duplication (ITD) was determined to be present if a product larger than the wild-type (329 bp) product was detected by capillary electrophoresis. Detection of the D835 mutation ofFLT3(NM_004119.2: c.2503_2505) was based on the fact that this mutation
abolishes anEcoRV cleavage site. PCR was performed with the following primers: 5’-GTA AAA CGA CGG CCA GCC GCC AGG AAC GTG CTT-3’(forward) and 5’-CAG GAA ACA GCT ATG ACG ATA TCA GCC TCA CAT TGC CCC-3’(reverse); forward primers were labeled with NED at the 5’end. AfterEcoRV digestion, PCR products were analyzed by
capil-lary electrophoresis using a 3500xL Genetic Analyzer (Life Technologies, NY). A D835 point mutation was indicated by the presence of a 129 bp fragment.
NPM1Assay. Total RNA was extracted using the QIAamp RNA Blood Mini Kit (Qiagen, Netherlands), reverse transcribed, and amplified in a multiplex PCR reaction using primers designed to detect common mutations inNPM1(NM_002520.4) using the SignatureNPM1
Mutations Assay (Asuragen, TX). Labeled PCR products were hybridized to target-specific capture probes covalently bound to fluorescent microspheres in a liquid bead array followed by analysis with a Luminex 100 (Luminex, TX). Interpretation was based on the mean fluores-cence intensity (MFI) obtained from a minimum of 50 microspheres.
JAK2Assay. Genomic DNA was isolated from leukocytes using the QIAamp DNA Blood Mini Kit (Qiagen, Netherlands) and amplified using real-time PCR with primers flankingJAK2
codon 617. Allelic discrimination between the normal sequence and theJAK2V617F
(NM_004972 c.1849G>T) mutation was subsequently accomplished by simultaneous
differen-tial hybridization of two sequence-specific probes, each labeled with a different fluorescent marker (MutaScreen Assay, Qiagen, Netherlands).
Next-Generation Sequencing and Bioinformatic Analysis
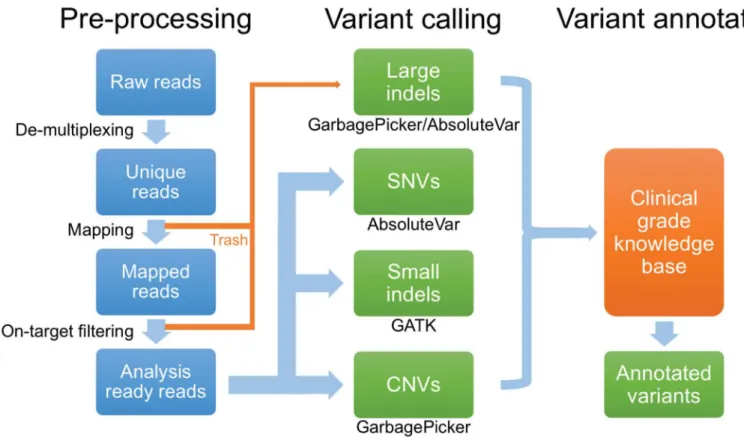
mapped to the hg19 version of the human reference genome, filtered to remove off-target and poor-quality reads (Fig 1). Using custom scripts, four types of variants were extracted: single-nucleotide variants (SNVs), small indels, copy number variants, and large indels. Vari-ants were then compared to an in-house developed knowledge base, which draws from pub-licly available sources such as PubMed, dbSNP database [30], COSMIC database [31], 1000 Genomes [32], and the Exome Variant Server (http://evs.gs.washington.edu). Using this knowledge base, variants were classified into 1 of 5 categories: disease associated mutation (DAM), likely pathogenic mutation (LPM), variants of uncertain significance (VUS), likely benign (LB), or benign (B). DAMs include mutations previously reported and associated with disease, including gain-of-function mutations in oncogenes (e.g., the canonicalKRAS
G12D mutation) and truncating mutations in known tumor suppressor genes. LPMs were classified as variants that had some evidence of disease association, such as case reports, but are not well described otherwise. Variants were classified as VUS if they had not been previ-ously reported either as a disease-associated mutation or as a normal variant on the Exome Variant Server, but whose pathogenicity could not be established with certainty. Variants were classified as LB if there was no report of association with disease and if they occurred in regions of the gene not predicted to have pathologic consequences. Variants noted on the clinical report, which are the ones included in this analysis, included the DAM, LPM and VUS (not LB or B). All reported variants were manually reviewed using the Integrative Geno-mics Viewer (IGV) [33] by at least two pathologists.
Fig 1. Next-generation sequencing data analysis pipeline.Data analysis occurs in three sequential stages, pre-processing of NGS reads, variant calling, and variant annotation. Of note, large indels are detected by an examination of reads that failed to map to target regions of the reference genome and are recovered from a pool of rejected reads (“Trash”). SNVs, single nucleotide variants. CNVs, copy number variation.
Ethics Statement
Patient data were analyzed anonymously in accordance with institutional practice guidelines. The institutional review board of the University of Pennsylvania determined this study to be exempt.
Results
Study Design and Specimen Characteristics
The University of Pennsylvania Health System began routine clinical NGS of solid tumors and hematologic malignancies in February of 2013. During validation of our NGS pipeline, we established thresholds for acceptable tumor percentage (10%) and DNA quantity and quality (seeMethodsfor details).
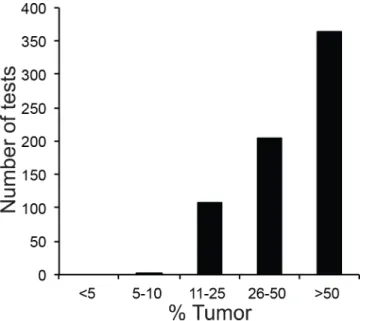
For a large number of specimens, clinicians ordered targeted single-gene tests and NGS analysis on the same specimen (Table 1): this occurred frequently with pulmonary and hematological specimens, but relatively rarely with specimens derived from other sites such as brain. We reasoned that comparing results from targeted and NGS testing of all“shared” specimens (i.e. specimens that had been analyzed by both NGS and single-gene tests) would allow us to probe the robustness of our NGS pipeline. We therefore set out to compare NGS and targeted test results in specimens that underwent NGS analysis during the first year of operation of the NGS pipeline (March 1, 2013 through March 1, 2014). During this time, 938 specimens (717 solid and 221 hematologic) were submitted for NGS analysis. While the majority of solid tumor specimens were composed of>50% tumor cells (Fig 2), a fraction of
solid tumors was not tested due to low tumor percentage. The most common tumor sites were lung, brain, bone marrow, lymph nodes, and peripheral blood (Table 1). A small frac-tion of solid tumor specimens could not be analyzed by NGS due to inadequate DNA quan-tity or quality (n= 60, 8.3%), however this was not an issue with peripheral blood and bone marrow specimens.
Fig 2. Tumor Percentage of Solid Tumor Specimens.Specimens were analyzed by next-generation sequencing (NGS) within the study period of March 1, 2013 and March 1, 2014.
Comparison of
EGFR
and
KRAS
Gene Mutations by NGS and Targeted
Testing
We were particularly interested in the performance ofEGFRtesting in our NGS assay, because
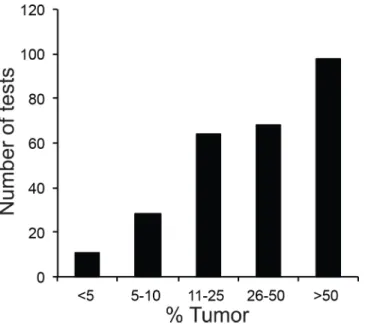
mutations in this gene may be therapeutically targetable, and because it is often challenging to analyze, as DNA degradation and low tumor percentage are frequently encountered in lung cancer specimens. SinceKRASmutations were frequently evaluated alongsideEGFRin cases of lung cancers at our institution, we also wanted to compare the performance of both methods on this gene. The tumor percentages for all specimens for which targetedEGFRmutation anal-ysis was reported during the study period (n= 283) are shown inFig 3. Approximately 10% of
the cases evaluated by targeted testing had a tumor percentage below the cutoff for NGS. We compared NGS and targeted testing in 139 specimens that had been tested forEGFR
mutations (Fig 4A) and 138 that had been tested forKRASmutations by both methods (Fig 4B). Among the shared specimens, all generated a result with the targeted single-gene methods. However, 15/139 (11%) of sharedEGFR-tested and 13/138 (9%) of sharedKRAS-tested speci-mens were excluded from NGS analysis due to insufficient DNA quality or quantity.
In the remaining specimens, all mutations detected by the targeted assays were also detected by NGS. Conversely, NGS identified a number of mutations that the targeted tests were not designed to detect. For example, our targetedEGFRmutation test only covers deletions in exon 19 and the L858R mutation in exon 21. Similarly, the targetedKRAStest only detects mutations in codons 12
and 13. In 10EGFRshared cases (6%), additional pathogenic mutations were detected by NGS. In two of these cases, the T790M mutation was found, which predicts resistance to TKI therapy [4]. Additionally, NGS detectedEGFRamplification in five cases; the predictive value of this copy number alteration in the context of TKI therapy is currently unclear. In fourKRASshared cases
(3%), NGS detected mutations in codon 61, which predict resistance to TKI therapy [34].
Comparison of
BRAF
Gene Mutations by NGS and Targeted Testing
TheBRAFsingle-gene test was performed less frequently in parallel with solid tumor NGS than theEGFRorKRAStests, because thyroid fine-needle aspiration samples, for whichBRAF
Fig 3. Tumor Percentage of Specimens Analyzed by TargetedEGFRTests.Cases were placed into 5 bins (<5%, 5–10%, 11–25%, 26–50%,>50% tumor cells in specimen).
testing was frequently ordered, were not originally validated for the NGS assay. Of 224 speci-mens that were tested with targetedBRAFtests, 38 were also analyzed by NGS (Fig 4C). Among the shared specimens, all generated a result with the targetedBRAFtest. In contrast, 8/ 38 shared cases (21%) could not be analyzed by NGS due to poor DNA quality or inadequate DNA quantity. All remaining shared specimens showed perfect concordance between NGS and targeted testing.
Comparison
FLT3
,
NPM1
, and
JAK2
Mutations by NGS and Targeted
Testing
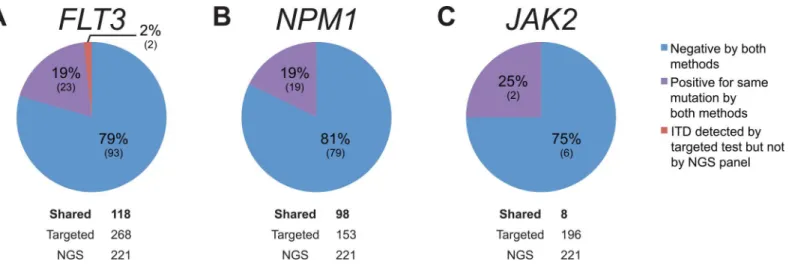
Of 221 hematologic specimens tested by NGS during the study period, 118 were also tested with theFLT3, and 98 with theNPM1targeted tests. In two cases, the targetedFLT3test
detected an internal tandem duplication (ITD) that was not automatically called by the NGS analysis pipeline (Fig 5A). However, manual review of the sequencing data demonstrated ITD mutations at allele frequencies of 1.3% and 1.6% (Fig 6A and 6C, respectively). In one of these two cases, the hematologic malignancy NGS panel additionally detected a pathogenicFLT3
D839G (c. 2516A>G) mutation (Fig 6B); this mutation was not detected by theFLT3 single-gene test that is designed to detect only ITDs and D835 mutations.
In the remainder ofFLT3shared cases, and also in allNPM1shared cases (Fig 5B), NGS and targeted tests were concordant. Additionally, a small number of specimens (n= 8) that had
been tested forJAK2mutations by both modalities were analyzed and showed complete con-cordance (Fig 5C).
Discussion
In this study, we report the properties of solid and liquid malignancy specimens processed dur-ing the first year of clinical oncologic NGS performed within the University of Pennsylvania Health System. We found that when we adhered to two predetermined quality control metrics, i.e., tumor percentage and DNA quantity and quality, we achieved excellent NGS data as deter-mined by virtually perfect concordance between NGS and targeted, single-gene testing. While a number of recent studies have confirmed the potential utility of clinical NGS for oncology Fig 4. Concordance Analysis of Solid Tumor Specimens.The specimens shown were submitted for both NGS and targeted tests forEGFR(A),KRAS (B), andBRAF(C) mutations. Note that all mutations seen by targeted testing were also found by NGS when specimens with inadequate DNA quantity and/or quality are excluded.
[14–25], there have been none, to our knowledge, that have evaluated the quality of data gener-ated during day-to-day practice at a clinical oncologic sequencing facility. Additionally, in con-trast to previous validation studies, we examined a larger number of specimens from a greater variety of tissues, and our data is therefore less subject to sample selection bias and may also more accurately reflect the expected annual case volume and distribution of tissue types encountered at a major academic medical center.
Fig 5. Concordance Analysis of Hematologic Malignancy Specimens.The specimens shown were submitted for both NGS and targeted tests forFLT3 (A),NPM1(B), andJAK2(C) mutations. Note that all samples were adequate for testing by both single-gene assays and NGS.
doi:10.1371/journal.pone.0152851.g005
Fig 6. Two Specimens with Low-Allele FrequencyFLT3Internal Tandem Duplications.In one specimen (A and B), a 24 bp internal tandem duplication (ITD) was seen in 7 out of 529 reads for an allele frequency of 1.3%. (A) Four of the reads containing insertions (purple bars) are shown using the Integrative Genomics Viewer. This specimen additionally harbored aFLT3D839G mutation in 45% of reads (B). A second specimen (C) harbored a 33 bpFLT3ITD in 12 out of 739 reads, for an allele frequency of 1.6%. Nine of the reads carrying an ITD are pictured.
Solid tumors and hematologic malignancy specimens differed considerably in their perfor-mance across the established quality control measures. We found that a sizable fraction of solid but not liquid specimens yielded DNA of insufficient quality or quantity for NGS testing. With respect to specimens tested forEGFRandKRAS(predominantly lung), this was likely largely
due to formalin fixation, which degrades DNA through cross-linking as well as other less well understood mechanisms [35]. One potential approach to reduce the number of samples that are currently rejected from NGS analysis might be to determine the amplifiability of extracted genomic DNA, for example by using the human genomic DNA quantitation and quality con-trol assay by Kapa Biosystems (Wilmington, MA).
Our study highlights the complementarity of NGS and targeted tests for mutation detection. In a number of instances, NGS detected clinically important mutations that were not captured by targeted assays. For example, theEGFRtest specifically interrogates potential exon 19
dele-tions and L858R mutadele-tions, which constitute about 85% of EGFR mutadele-tions in lung cancers [12]. In 9 shared cases,EGFRmutations were found in different regions of the gene by the NGS
assay (Fig 4A). Similarly, clinically importantKRASmutations occur in codons 12, 13, and 61, but only codons 12 and 13 were evaluated by the in-houseKRASsingle-gene test. In 4 shared
cases,KRASmutations in codon 61 were detected by NGS only.
Targeted assays generally outperformed NGS in specimens with low tumor percentage, DNA quantity, or quality. In fact, we identified actionable mutations by targeted analysis in multiple cases that were unable to be analyzed by NGS (data not shown). In two specimens, a
FLT3ITD mutation, which was not automatically called by the NGS pipeline, was readily detected by the targeted assay. WhileFLT3ITDs can be challenging to detect by NGS due to
the complex structure of the mutation [36], the problem in these two cases was that the allele frequency fell below the validated threshold for automatic detection of 4%. However, manual inspection of theFLT3exon 14 and the flanking intronic sequence using the Integrative Geno-mics Viewer (IGV) [33] clearly showed the presence of ITD mutations in both cases (Fig 6A and 6C). The detection of NGS for indel mutations, in contrast to single nucleotide variants, is not fundamentally limited by PCR artifacts and sequencing errors. Therefore, we validated our pipeline for the detection ofFLT3ITDs with allele frequencies of 1%, and we altered the indel allele frequency calling threshold specifically forFLT3ITDs. Reanalysis of the twoFLT3cases
with updated parameters, which was part of the revalidation study, revealed the expected results. These findings highlight the importance of manual review of the sequencing data.
Low tumor percentage was also limiting in solid tumor cases. Approximately 10% of speci-mens submitted forEGFRmutation testing were found to contain less than 10% tumor (Fig 3),
thereby failing tumor percentage requirements for NGS testing. All of these specimens gener-ated a result with the targeted assay. It should be noted, however, that as NGS methodologies continue to mature, the ability of NGS to detect single nucleotide variants in specimens with lower tumor percentage will improve. Rare variant detection by NGS is hampered by the high rate of amplification and sequencing errors, which can approach 1% for single nucleotide vari-ants [37]. Various approaches to increase analytic sensitivity for rare variants by NGS have recently been described, including barcoding of each DNA fragment before amplification [38–
40], barcoding of both strands of each fragment [41], and generation of multiple linked tandem copies of each DNA fragment by rolling circle amplification [42]. In particular, the latter method has been shown to improve sensitivity of rare variant detection by more than 100-fold without introducing excessive computational inefficiency.
that were not assessed. Of note, our NGS pipeline produced excellent results for the challenging genesEGFRandFLT3. We therefore expect that most other genes covered by our cancer panels
generate NGS data of similarly high quality. Second, not all specimens that were submitted for NGS analysis were also tested by single-gene methods. For example, only 3.4% of brain tumor specimens submitted for NGS were at the same time examined by targeted tests, and therefore our conclusions may not necessarily extend to all tumors at this time. Additionally, the speci-mens tested did not contain the entire spectrum of mutations that can be evaluated by our tar-geted tests. Finally, our findings may not be generalizable to other platforms, especially those that utilize more complex gene panels.
Recently issued recommendations for validation and quality control of clinical NGS data [43] include monitoring of quality metrics (e.g., sequencing quality scores, depth of coverage, uniformity of coverage, mapping quality), proficiency testing, and confirmation of actionable results by independent methods. Multiple studies that appeared after these recommendations were published have established that particularly for solid tumors, tumor percentage and DNA quality are important additional metrics [14,22,23], and we found this as well in our validation studies (not shown). Proficiency testing for cancer NGS is not yet available but is currently being developed by the College of American Pathologists (CAP).
A proposed requirement to confirm actionable mutations by independent molecular meth-ods [43] has been called into question [23]. Since single-gene tests such as Sanger sequencing may not have inherently greater sensitivity than a well-scaled NGS pipeline [15,44], verification by these methods might not improve the accuracy of test results. Accordingly, very recent
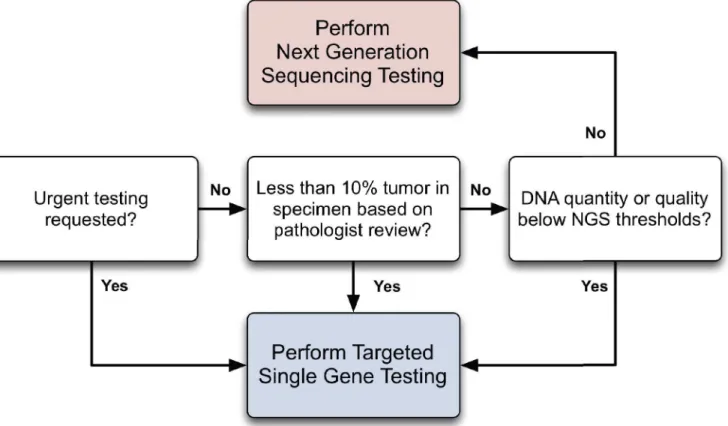
Fig 7. Proposed Workflow for NGS and Single-Gene Assays.Three main decision points are highlighted. Specimens requiring an urgent turnaround time are routed directly for single-gene testing (possibly followed by NGS). Additionally, single-gene testing is performed on samples with less than 10% tumor or DNA inadequate for NGS (i.e., degraded or low quantity). In samples not meeting any of the above criteria, NGS is performed instead of single-gene testing. NGS results do not require confirmation by single-gene testing.
guidelines by the College of American Pathologists leave the decision when and how to per-form confirmatory testing of NGS results to the clinical laboratory [44]. OurEGFRsingle-gene
test had greater analytical sensitivity than NGS, detecting mutations in samples with well under 10% tumor. However, our finding that within pre-defined tumor percentage and DNA quality cutoffs NGS showed perfect concordance confirms the notion that it is unnecessary to confirm each actionable mutation detected via NGS by a gene test. In addition, single-gene tests frequently do not cover important disease-associated mutations and in some instances fail to detect the very mutations they target [13].
Based on these considerations, we propose a workflow that integrates NGS as an adjunct diagnostic modality for solid and liquid neoplasms (Fig 7). The typical turn-around time of the NGS assay at the time of the study was around 7–10 days from receipt in the sequencing facility to the time the final report was signed out in the electronic medical record. Turnaround is gen-erally faster for targeted tests, and thus it is advantageous to perform targeted tests, perhaps in addition to NGS, in clinically urgent situations. Specimens with low tumor percentage or DNA quantity or quality should be subjected to targeted tests that we found to be more analytically sensitive than NGS. On the other hand, when DNA quality and quantity is adequate and a turnaround time of 7–10 days is acceptable, NGS holds clear advantages, including increased clinical sensitivity within targeted genes of interest and additional information from other cov-ered genes on the panel. In these cases, our data suggest that targeted tests may be safely omitted.
Supporting Information
S1 File. Raw Data for Comparison Analysis.
(XLSX)
Acknowledgments
We thank Daniel Desloover for comments on the manuscript.
Author Contributions
Conceived and designed the experiments: MCH DBR SK CDW RDD JJDM. Performed the experiments: MCH SK. Analyzed the data: MCH SK. Contributed reagents/materials/analysis tools: MCH SK DL JZ CDW RDD JJDM. Wrote the paper: MCH SK JZ CDW RDD JJDM.
References
1. Shepherd FA, Rodrigues Pereira J, Ciuleanu T, Tan EH, Hirsh V, Thongprasert S, et al. Erlotinib in pre-viously treated non-small-cell lung cancer. N Engl J Med. 2005; 353: 123–132. doi:10.1056/
NEJMoa050753PMID:16014882
2. Jackman DM, Miller VA, Cioffredi L-A, Yeap BY, Jänne PA, Riely GJ, et al. Impact of epidermal growth factor receptor and KRAS mutations on clinical outcomes in previously untreated non–small cell lung cancer patients: results of an online tumor registry of clinical trials. Clin Cancer Res. AACR; 2009; 15: 5267–5273. doi:10.1158/1078-0432.CCR-09-0888PMID:19671843
3. West H, Lilenbaum R, Harpole D, Wozniak A, Sequist L. Molecular analysis-based treatment strategies for the management of non-small cell lung cancer. J Thorac Oncol. 2009; 4: S1029–39. doi:10.1097/ JTO.0b013e3181b27170PMID:19704347
4. Pao W, Wang TY, Riely GJ, Miller VA, Pan Q, Ladanyi M, et al. KRAS mutations and primary resistance of lung adenocarcinomas to gefitinib or erlotinib. PLoS Med. Public Library of Science; 2005; 2: e17. doi:10.1371/journal.pmed.0020017
non-small-cell lung cancer treated with chemotherapy alone and in combination with erlotinib. J Clin Oncol. 2005; 23: 5900–5909. doi:10.1200/JCO.2005.02.857PMID:16043828
6. Massarelli E, Varella-Garcia M, Tang X, Xavier AC, Ozburn NC, Liu DD, et al. KRAS mutation is an important predictor of resistance to therapy with epidermal growth factor receptor tyrosine kinase inhibi-tors in non-small-cell lung cancer. Clin Cancer Res. 2007; 13: 2890–2896. doi:10.1158/1078-0432. CCR-06-3043PMID:17504988
7. Sosman JA, Kim KB, Schuchter L, Gonzalez R, Pavlick AC, Weber JS, et al. Survival in BRAF V600-mutant advanced melanoma treated with vemurafenib. N Engl J Med. 2012; 366: 707–714. doi:10. 1056/NEJMoa1112302PMID:22356324
8. Schlenk RF, Döhner K, Krauter J, Fröhling S, Corbacioglu A, Bullinger L, et al. Mutations and treatment outcome in cytogenetically normal acute myeloid leukemia. N Engl J Med. 2008; 358: 1909–1918. doi: 10.1056/NEJMoa074306PMID:18450602
9. Kralovics R, Passamonti F, Buser AS, Teo S-S, Tiedt R, Passweg JR, et al. A gain-of-function mutation of JAK2 in myeloproliferative disorders. N Engl J Med. 2005; 352: 1779–1790. doi:10.1056/
NEJMoa051113PMID:15858187
10. Mesa RA, Yasothan U, Kirkpatrick P. Ruxolitinib. Nat Rev Drug Discov. Nature Publishing Group; 2012; 11: 103–104. doi:10.1038/nrd3652PMID:22293561
11. Gowin K, Mesa R. Emerging therapies for the treatment of chronic Philadelphia chromosome-negative myeloproliferative neoplasm-associated myelofibrosis. Expert Opin Investig Drugs. 2013; 22: 1603–
1611. doi:10.1517/13543784.2013.832199PMID:24066969
12. Lindeman NI, Cagle PT, Beasley MB, Chitale DA, Dacic S, Giaccone G, et al. Molecular testing guide-line for selection of lung cancer patients for EGFR and ALK tyrosine kinase inhibitors: guideguide-line from the College of American Pathologists, International Association for the Study of Lung Cancer, and Association for Molecular Pathology. The Journal of molecular diagnostics: JMD. 2013. pp. 415–453. doi:10.1016/j.jmoldx.2013.03.001
13. Wilson MA, Morrissette JJD, McGettigan S, Roth D, Elder D, Schuchter LM, et al. What you are missing could matter: a rare, complex BRAF mutation affecting codons 599, 600, and 601 uncovered by next generation sequencing. Cancer Genet. 2014; 207: 272–275. doi:10.1016/j.cancergen.2014.06.022 PMID:25178945
14. Frampton GM, Fichtenholtz A, Otto GA, Wang K, Downing SR, He J, et al. Development and validation of a clinical cancer genomic profiling test based on massively parallel DNA sequencing. Nat Biotechnol. 2013; 31: 1023–1031. doi:10.1038/nbt.2696PMID:24142049
15. Hadd AG, Houghton J, Choudhary A, Sah S, Chen L, Marko AC, et al. Targeted, high-depth, next-gen-eration sequencing of cancer genes in formalin-fixed, paraffin-embedded and fine-needle aspiration tumor specimens. J Mol Diagn. 2013; 15: 234–247. doi:10.1016/j.jmoldx.2012.11.006PMID: 23321017
16. Grossmann V, Roller A, Klein H-U, Weissmann S, Kern W, Haferlach C, et al. Robustness of amplicon deep sequencing underlines its utility in clinical applications. J Mol Diagn. 2013; 15: 473–484. doi:10. 1016/j.jmoldx.2013.03.003PMID:23680131
17. Singh RR, Patel KP, Routbort MJ, Reddy NG, Barkoh BA, Handal B, et al. Clinical validation of a next-generation sequencing screen for mutational hotspots in 46 cancer-related genes. J Mol Diagn. 2013; 15: 607–622. doi:10.1016/j.jmoldx.2013.05.003PMID:23810757
18. Spencer DH, Sehn JK, Abel HJ, Watson MA, Pfeifer JD, Duncavage EJ. Comparison of clinical targeted next-generation sequence data from formalin-fixed and fresh-frozen tissue specimens. J Mol Diagn. 2013; 15: 623–633. doi:10.1016/j.jmoldx.2013.05.004PMID:23810758
19. Beadling C, Neff TL, Heinrich MC, Rhodes K, Thornton M, Leamon J, et al. Combining highly multi-plexed PCR with semiconductor-based sequencing for rapid cancer genotyping. J Mol Diagn. 2013; 15: 171–176. doi:10.1016/j.jmoldx.2012.09.003PMID:23274167
20. Kanagal-Shamanna R, Portier BP, Singh RR, Routbort MJ, Aldape KD, Handal BA, et al. Next-genera-tion sequencing-based multi-gene mutaNext-genera-tion profiling of solid tumors using fine needle aspiraNext-genera-tion sam-ples: promises and challenges for routine clinical diagnostics. Mod Pathol. 2014; 27: 314–327. doi:10. 1038/modpathol.2013.122PMID:23907151
21. McCourt CM, McArt DG, Mills K, Catherwood MA, Maxwell P, Waugh DJ, et al. Validation of next gener-ation sequencing technologies in comparison to current diagnostic gold standards for BRAF, EGFR and KRAS mutational analysis. PLoS ONE. Public Library of Science; 2013; 8: e69604. doi:10.1371/ journal.pone.0069604PMID:23922754
23. Cottrell CE, Al-Kateb H, Bredemeyer AJ, Duncavage EJ, Spencer DH, Abel HJ, et al. Validation of a next-generation sequencing assay for clinical molecular oncology. J Mol Diagn. 2014; 16: 89–105. doi: 10.1016/j.jmoldx.2013.10.002PMID:24211365
24. Nikiforova MN, Wald AI, Roy S, Durso MB, Nikiforov YE. Targeted next-generation sequencing panel (ThyroSeq) for detection of mutations in thyroid cancer. J Clin Endocrinol Metab. 2013; 98: E1852–60. doi:10.1210/jc.2013-2292PMID:23979959
25. Pritchard CC, Salipante SJ, Koehler K, Smith C, Scroggins S, Wood B, et al. Validation and implemen-tation of targeted capture and sequencing for the detection of actionable muimplemen-tation, copy number varia-tion, and gene rearrangement in clinical cancer specimens. J Mol Diagn. 2014; 16: 56–67. doi:10. 1016/j.jmoldx.2013.08.004PMID:24189654
26. Daber R, Sukhadia S, Morrissette JJD. Understanding the limitations of next generation sequencing informatics, an approach to clinical pipeline validation using artificial data sets. Cancer Genet. 2013; 206: 441–448. doi:10.1016/j.cancergen.2013.11.005PMID:24528889
27. Aisner DL, Deshpande C, Baloch Z, Watt CD, Litzky LA, Malhotra B, et al. Evaluation of EGFR mutation status in cytology specimens: an institutional experience. Diagn Cytopathol. 2013; 41: 316–323. doi: 10.1002/dc.21851PMID:22102479
28. Bauml J, Mick R, Zhang Y, Watt CD, Vachani A, Aggarwal C, et al. Determinants of survival in advanced non—small-cell lung cancer in the era of targeted therapies. Clin Lung Cancer. 2013; 14: 581–591. doi:10.1016/j.cllc.2013.05.002PMID:23827517
29. Frank R, Baloch ZW, Gentile C, Watt CD, LiVolsi VA. Multifocal Fibrosing Thyroiditis and Its Association with Papillary Thyroid Carcinoma Using BRAF Pyrosequencing. Endocr Pathol. 2013; 25: 236–240. doi:10.1007/s12022-013-9289-0
30. Smigielski EM, Sirotkin K, Ward M, Sherry ST. dbSNP: a database of single nucleotide polymorphisms. Nucleic Acids Res. 2000; 28: 352–355. doi:10.1007/s10549-007-9613-9PMID:10592272
31. Forbes S, Clements J, Dawson E, Bamford S, Webb T, Dogan A, et al. COSMIC 2005. Br J Cancer. 2006; 94: 318–322. doi:10.1038/sj.bjc.6602928PMID:16421597
32. 1000 Genomes Project Consortium, Abecasis GR, Altshuler D, Auton A, Brooks LD, Durbin RM, et al. A map of human genome variation from population-scale sequencing. Nature. 2010; 467: 1061–1073. doi:10.1038/nature09534PMID:20981092
33. Robinson JT, Thorvaldsdóttir H, Winckler W, Guttman M, Lander ES, Getz G, et al. Integrative geno-mics viewer. Nat Biotechnol. 2011; 29: 24–26. doi:10.1038/nbt.1754PMID:21221095
34. Roberts PJ, Stinchcombe TE. KRAS mutation: should we test for it, and does it matter? J Clin Oncol. 2013; 31: 1112–1121. doi:10.1200/JCO.2012.43.0454PMID:23401440
35. Srinivasan M, Sedmak D, Jewell S. Effect of fixatives and tissue processing on the content and integrity of nucleic acids. Am J Pathol. 2002; 161: 1961–1971. doi:10.1016/S0002-9440(10)64472-0PMID: 12466110
36. Spencer DH, Abel HJ, Lockwood CM, Payton JE, Szankasi P, Kelley TW, et al. Detection of FLT3 inter-nal tandem duplication in targeted, short-read-length, next-generation sequencing data. J Mol Diagn. 2013; 15: 81–93. doi:10.1016/j.jmoldx.2012.08.001PMID:23159595
37. Loman NJ, Misra RV, Dallman TJ, Constantinidou C, Gharbia SE, Wain J, et al. Performance compari-son of benchtop high-throughput sequencing platforms. Nat Biotechnol. 2012; 30: 434–439. doi:10. 1038/nbt.2198PMID:22522955
38. Kinde I, Wu J, Papadopoulos N, Kinzler KW, Vogelstein B. Detection and quantification of rare muta-tions with massively parallel sequencing. Proc Natl Acad Sci USA. 2011; 108: 9530–9535. doi:10. 1073/pnas.1105422108PMID:21586637
39. Casbon JA, Osborne RJ, Brenner S, Lichtenstein CP. A method for counting PCR template molecules with application to next-generation sequencing. Nucleic Acids Res. 2011; 39: e81–e81. doi:10.1093/ nar/gkr217PMID:21490082
40. Hiatt JB, Patwardhan RP, Turner EH, Lee C, Shendure J. Parallel, tag-directed assembly of locally derived short sequence reads. Nat Methods. 2010; 7: 119–122. doi:10.1038/nmeth.1416PMID: 20081835
41. Schmitt MW, Kennedy SR, Salk JJ, Fox EJ, Hiatt JB, Loeb LA. Detection of ultra-rare mutations by next-generation sequencing. Proc Natl Acad Sci USA. 2012; 109: 14508–14513. doi:10.1073/pnas. 1208715109PMID:22853953
43. Gargis AS, Kalman L, Berry MW, Bick DP, Dimmock DP, Hambuch T, et al. Assuring the quality of next-generation sequencing in clinical laboratory practice. Nat Biotechnol. 2012; 30: 1033–1036. doi: 10.1038/nbt.2403PMID:23138292
44. Aziz N, Zhao Q, Bry L, Driscoll DK, Funke B, Gibson JS, et al. College of American Pathologists' labora-tory standards for next-generation sequencing clinical tests. Arch Pathol Lab Med. 2015; 139: 481–