www.atmos-chem-phys.net/10/6969/2010/ doi:10.5194/acp-10-6969-2010
© Author(s) 2010. CC Attribution 3.0 License.
Chemistry
and Physics
Oxidative capacity of the Mexico City atmosphere – Part 1: A
radical source perspective
R. Volkamer1,2,3, P. Sheehy1,4, L. T. Molina1,4, and M. J. Molina1,2
1Department of Earth, Atmospheric and Planetary Sciences, Massachussetts Institute of Technology, Cambridge, MA, USA 2Department of Chemistry and Biochemistry, University of California, San Diego, La Jolla, CA, USA
3Department of Chemistry and Biochemistry and CIRES, University of Colorado at Boulder, Boulder, CO, USA 4Molina Center for Energy and the Environment (MCE2), La Jolla, CA, USA
Received: 27 March 2007 – Published in Atmos. Chem. Phys. Discuss.: 18 April 2007 Revised: 5 March 2010 – Accepted: 23 April 2010 – Published: 30 July 2010
Abstract. A detailed analysis of OH, HO2 and RO2 rad-ical sources is presented for the near field photochemrad-ical regime inside the Mexico City Metropolitan Area (MCMA). During spring of 2003 (MCMA-2003 field campaign) an ex-tensive set of measurements was collected to quantify time-resolved ROx (sum of OH, HO2, RO2) radical production rates from day- and nighttime radical sources. The Master Chemical Mechanism (MCMv3.1) was constrained by mea-surements of (1) concentration time-profiles of photosensi-tive radical precursors, i.e., nitrous acid (HONO), formalde-hyde (HCHO), ozone (O3), glyoxal (CHOCHO), and other oxygenated volatile organic compounds (OVOCs); (2) re-spective photolysis-frequencies (J-values); (3) concentration time-profiles of alkanes, alkenes, and aromatic VOCs (103 compound are treated) and oxidants, i.e., OH- and NO3 rad-icals, O3; and (4) NO, NO2, meteorological and other pa-rameters. The ROx production rate was calculated directly from these observations; the MCM was used to estimate fur-ther ROx production from unconstrained sources, and ex-press overall ROxproduction as OH-equivalents (i.e., taking into account the propagation efficiencies of RO2 and HO2 radicals into OH radicals).
Daytime radical production is found to be about 10–25 times higher than at night; it does not track the abundance of sunlight. 12-h average daytime contributions of individual sources are: Oxygenated VOC other than HCHO about 33%;
Correspondence to:R. Volkamer ([email protected])
HCHO and O3photolysis each about 20%; O3/alkene reac-tions and HONO photolysis each about 12%, other sources
<3%. Nitryl chloride photolysis could potentially contribute ∼15% additional radicals, while NO2* + water makes – if any – a very small contribution (∼2%). The peak radical production of∼7.5 107molec cm−3s−1is found already at 10:00 a.m., i.e., more than 2.5 h before solar noon. O3/alkene reactions are indirectly responsible for∼33% of these radi-cals. Our measurements and analysis comprise a database that enables testing of the representation of radical sources and radical chain reactions in photochemical models.
1 Introduction
Air pollution is an increasingly important concern in the public health debate (Health Effects Institute, 2000). In Mexico City the number of deaths associated with anthro-pogenic air pollution is comparable to that from car accidents (Molina and Molina, 2002). Ozone (O3) and fine partic-ulate matter (PM2.5, particles with a diameter smaller than 2.5 micrometers) are integral components of photochemical smog. There is no evidence of a “safe” threshold concen-tration for O3 or PM2.5related health effects. O3is known to cause inflammation in the respiratory tract, reduce respi-ratory capacity for some people, and increase hospitalization rates related to asthma and other respiratory ailments. More recently, systematic evidence has been presented supporting premature mortality in relation to short-term O3 exposure following episodes of photochemical smog in the US (Bell et al., 2004) and Asia (PAPA, 2004). Downwind of urban ar-eas, photochemical O3leads to reduced tree-growth (Gregg et al., 2003), has adverse effects on agriculture (Fuhrer and Booker, 2003), and contributes to global warming (IPCC, 2007). Short-term exposures to high levels of PM2.5 (e.g., 500 µg/m3)caused premature mortality during the London killer smog episode in 1952 (Davis et al., 2002); more recent studies in the US, Europe, Asia, and South America have further found association of long-term exposures to PM2.5 with premature mortality at much lower levels (<50 µg/m3)
(Health Effects Institute, 2000; Pope et al., 2002). Recent progress toward identifying biological mechanisms for these effects point to the role of transition metals and pro-oxidative hydrocarbons associated with fine particulate matter (Nel, 2005). Enhanced light absorption by aerosols affects climate (Ramanathan et al., 2001) with implications for atmospheric stability and vertical air exchange, precipitation patterns, and the amount of radiation reaching the ground.
Photochemical smog is largely formed as the result of the chemical transformations of primary emissions to the at-mosphere. It has long been understood that O3 is not di-rectly emitted, but forms in the atmosphere as a result of hydrocarbon/NOx/sunlight photochemistry (Haagen-Smit et al., 1951). On the other hand, it has only recently been rec-ognized that in Mexico City and other urban areas – despite the abundance of emission sources – gas-to-particle conver-sion processes are responsible for about 60–80% of PM2.5 mass; secondary organic aerosol (SOA) originating from the gas-phase oxidation of hydrocarbons is a major component of PM2.5(Salcedo et al., 2006; Volkamer et al., 2006; Zhang et al., 2007). Free radical (i.e., OH and NO3), O3, and pho-tolysis reactions initiate the oxidation of hydrocarbons in the gas-phase, and possibly modify aerosol surfaces. The de-sign of effective policy strategies to reduce the impact of air pollution on human health, ecosystem and climate requires understanding the sources and sinks of these radicals. Mod-eling studies (Ruiz-Suarez et al., 1993; West et al., 2004; Lei et al., 2007, 2008) and experimental observations
(Arriaga-Colina et al., 2004) suggest that the photochemical process-ing of pollutants in the MCMA is either VOC limited or sup-pressed by high NOxlevels; indeed both of these chemical regimes may apply at different times (Lei et al., 2007, 2008; Stephens et al., 2008). In either case, the photochemical pro-cessing of pollutants is radical limited. This suggests that a more detailed understanding of radical sources can identify mechanisms to efficiently slow down photochemical smog formation, including O3and SOA formation in the MCMA.
The chemical mechanisms that underlie atmospheric model predictions of ozone (and fine PM2.5) are simplified representations of a rather complex chemistry of the urban atmosphere. The result of such “chemical lumping” is that atmospheric models become heavily parameterized when ad-dressing a specific target question (e.g., predicting ozone). However, the optimal parameterization is different for dif-ferent atmospheric conditions (e.g., VOC/NOxratio); once a model has been optimized, it remains a challenge to predict ozone if atmospheric conditions change. There is a hidden uncertainty in “lumped” chemistry modules that can account for errors as large as 10–60% in the predicted ozone as atmo-spheric conditions change (Carter et al., 2005; Bloss et al., 2005a, b; Stockwell et al., 2008). This chemical uncertainty is in addition to those caused by uncertainties in meteorology and emissions. It is comparable in magnitude, but often ne-glected for consideration. This paper series investigates this “hidden” uncertainty directly by means of a detailed chemi-cal model that has a minimum amount of chemichemi-cal lumping. The model explicitly represents the formation and sink re-actions of OH, HO2, and RO2radicals (in sum termed ROx radicals), and thus does not suffer from changing experimen-tal conditions. Part 1 of the series focuses on the production of ROxradicals from the reaction of closed shell molecules with sunlight (i.e., HONO, HCHO, O3, glyoxal, numerous other oxygenated VOC (OVOC)), and the dark reaction of alkenes with O3 and NO3 radicals. Most of these radical sources are constrained by observations. In Part 2 Sheehy et al. (2010) the experimental radical production rates from this work are combined with observations of HOx radicals (Shirley et al., 2006) to directly quantify (1) the amplification of radical sources from chemical radical chain reactions, and (2) to assess our current capability to predict radical chain re-actions that largely determine the oxidation capacity. Since these radicals have lifetimes on the order of few milliseconds to seconds, the comparison of measured and predicted radical concentrations systematically minimizes uncertainty from air movements and emissions, and isolates the uncertainty inher-ent in our limited understanding of oxidative chemistry.
2 Experimental
set of instrumentation to characterize radical precursor con-centrations, their respective photolysis frequencies, and oxi-dants (OH, O3, NO3)was based at a supersite located at the Centro Nacional de Investigaci´on y Capacitaci´on Ambiental (CENICA) in the central-southern part of the MCMA. An overview of typical pollutant concentrations at the CENICA site is compiled in Molina et al. (2007); campaign me-dian concentrations were 86 ppb NOx during morning rush hour, 20 ppb NOx during afternoons, median peak concen-trations of 115 ppb O3, 0.4 ppt OH, and 40 ppt HO2 shortly after noon, 120 s−1OH-reactivity (morning rush hour). Of the calculated contributions to the OH reactivity, 12% was due to NOx, 7% to CO, 4% to HCHO and 72% to VOCs (Shirley et al., 2006). The instruments that measured radical precursor molecules are described in the following sections; more than 75% of the overall rate of radical production is constrained by measurements here. A complete list of mea-surements used to constrain the MCM model as given in the Supplementary Material of Sheehy et al. (2010).
2.1 Measurement techniques
The radical precursor molecules HONO, HCHO, O3, and CHOCHO were measured by Long-Path Differential Opti-cal Absorption Spectroscopy (LP-DOAS), acetaldehyde and acetone were measured by PTR-MS (Jobson et al., 2010), and the respective photolysis frequencies for these molecules were measured by spectroradiometry as described below. Alkenes and other hydrocarbons were measured by a Fast Isoprene Sensor (FIS) and VOC canister samples (Velasco et al., 2007), open path DOAS and FTIR (see below), and PTR-MS (Jobson et al., 2010).
2.1.1 Long-Path Differential Optical Absorption Spectrometry (LP-DOAS)
Two LP-DOAS instruments were deployed on the roof-top of the CENICA building. DOAS uses unique spe-cific narrow-band (<5 nm) absorption structures in the vis-ible spectral range to separate trace gas absorptions from broadband molecule and aerosol extinction in the open at-mosphere (Platt, 1994). The DOAS#1 light path was di-rected towards an antenna tower in a south-easterly direc-tion at an average height of 16 m with a 430 m path length (total 860 m). DOAS#2 faced an array of retro reflectors at Museo Fuego Nuevo (Cerro de la Estrella) resulting in a total light-path of 4420 m and average 70 m above ground. Atmo-spheric spectra were recorded by sequentially projecting 40-nm (DOAS#1) and 80-40-nm (DOAS#2) wide wavelength in-tervals centered around 260 nm, 318 nm, 357 nm, 427 nm and 642 nm onto the 1024-element linear photodiode array detec-tor; background spectra recorded within a few minutes were subtracted to correct for stray-light from the atmosphere. The average time-resolution for a full cycle of spectra ranged be-tween 30 s–4 min (DOAS#1), and 2–15 min (DOAS#2),
de-pending on the light extinction due to ozone (DOAS#1), NO2 and aerosols (DOAS#1 and DOAS#2).
DOAS#1 measured O3, NO2, SO2, HONO, HCHO, ben-zene, toluene, m-xylene, p-xylene, mono-substituted alkyl-benzenes (C2 and higher), phenol, p-cresol, and benzalde-hyde by observing unique specific ro-vibronic absorption structures distributed over several hundred wavelength chan-nels simultaneously. Naphthalene and styrene were also measured for the first time with DOAS in the atmosphere (Volkamer et al., 2004). Reference spectra of aromatic com-pounds were recorded by introducing quartz-cuvettes filled with vapor into the light beam, and these spectra were cali-brated by using absorption cross-section spectra taken from the literature (Etzkorn et al., 1999). Absorptions of atmo-spheric oxygen were eliminated using the interpolation ap-proach of Volkamer et al. (1998). In brief, saturation of molecular absorption lines of oxygen in the Herzberg I-III bands were modeled in high-resolution using line parame-ters from Fally et al. (2000), Jenouvrier et al. (1999) and Me-rienne et al. (2000, 2001), and oxygen column densities of 3.7×10¹⁷molecules cm−2 and 4.1×10¹⁷molecules cm−2 to bracket the effect of density variations on oxygen column densities. The collision induced absorption of oxygen in the Wulf bands was fitted using the literature spectra from Bernath et al. (1998). For ozone, temperature dependent ab-sorption cross-sections (Bass and Paur, 1981) for 293 K and 313 K were convoluted to match the spectral resolution of the instruments, and fitted simultaneously with other trace-gas reference spectra and a fifth order polynomial high-pass filter to account for broadband molecule and aerosol ex-tinction using non-linear least squares fitting routines (Stutz et al., 1996; Fayt et al., 2001). The mean detection lim-its of species measured by DOAS#1 were: 1.3 ppbv (O3), 1.5 ppbv (NO2), 0.26 ppbv (SO2), 0.5 ppbv (HONO), 5 ppbv (HCHO), 1 ppbv (benzene, toluene, m-xylene), 0.3 ppbv (p-xylene), 1.8 ppbv (ethylbenzene-equivalents), 0.5 ppbv (styrene), 0.06 ppbv (phenol, p-cresol), 0.2 ppbv (benzalde-hyde), and 0.08 ppbv (naphthalene).
Table 1. The percentage contributions of individual sources to OHnew(bold numbers). Individual molecules are differentiated by their
source (italic numbers, add up to 100% for any given source); for “other OVOC” sources for OHnew from HO2 and RO2radicals are
differentiated (italic numbers), and differentiated by molecular functional groups (small roman numbers, add up to 100% in the HO2and
RO2sub categories).
contribution to6OHnew
03:00 07:00 09:00 11:00 13:00 15:00 20:00 06:00–18:00 (avg) 20:00–04:00 (avg)
Measured
HONO – 42.1 21.8 7.4 3.9 1.1 – 11.8 –
PSSa – 53–98 91–99 45–86 53–92 50–94 – 80–90 –
Dark + othera – ≤47 ≤9 ≤55 ≤47 ≤50 – ≤20 –
O3 – – 4.0 21.7 36.4 29.7 – 19.2 –
HCHO – 4.4 20.3 23.5 20.7 18.3 – 19.4 –
Primaryb,c – 60.5 40.0 11.9 0.1 6.2 – 28.6 – Otherb,c – 39.5 60.0 88.1 99.9 93.8 – 71.4 – CH3CHO – 0.1 0.5 0.8 1.0 1.4 – 0.8 –
CHOCHO – 0.1 0.7 1.0 1.1 0.8 – 0.8 –
CH3COCH3 – 0.1 0.2 0.3 0.4 0.4 – 0.3 –
O3+alkenes 81.9 22.6 16.6 9.2 4.1 10.5 78.7 12.0 84.7
→OHc 55.3 48.2 50.6 52.7 53.3 53.6 55.1 51.9 53.2
→HOc2 8.2 6.6 9.0 12.1 12.5 11.7 9.6 10.2 8.1
→ROc2 36.5 45.2 40.4 35.2 34.2 34.7 35.4 37.9 38.7
NO2* – 2.1 4.3 1.6 0.8 1.3 – 2.1 –
Modeled
ROOH – 1.0 1.7 1.2 1.6 2.5 – 0.9 –
→OH – 4.3 4.9 23.3 62.6 70.6 – 62.6 –
→RO2 – 95.7 95.1 76.7 37.4 29.4 – 37.4 –
other OVOC – 25.1 28.9 31.0 27.6 29.6 – 30.3 –
→HOc2 – 51.1 56.1 60.3 60.7 61.1 – 57.6 –
carbonyls – 83.8 69.7 68.7 67.9 70.6 – 69.7 –
RCHO – 2.7 10.6 18.8 22.5 16.8 – 16.4 –
EPOX – 12.2 17.5 9.8 7.2 10.8 – 11.6 –
Ketones – – 0.2 0.5 0.8 0.6 – 0.5 –
MISC – 1.3 2.1 2.5 1.4 1.0 – 1.7 –
→ROc2 – 47.8 42.2 38.8 38.7 38.2 – 42.4 –
carbonyls – 94.2 85.7 81.3 80.5 84.8 – 83.5 –
RCHO – 1.6 7.2 11.8 12.1 8.4 – 9.7 –
Ketones – 0.3 1.7 3.7 5.2 4.4 – 3.4 –
Misc – 2.3 1.6 1.0 0.7 0.5 – 1.0 –
NO3+VOC 18.1 0.2 1.1 2.1 1.9 3.8 21.3 2.2 15.3
Sum (%) 100.0 97.8 100.0 99.8 99.5 99.5 100.0 99.9 100.0
6OHnew(ppb h−1) 0.48 1.95 10.53 12.68 8.55 4.11 0.77 6.45 0.48 aPSS: photostationary state HONO; dark+other: unaccounted HONO sources. Numbers indicate relative contributions to6OH
newfrom
HONO;bPrimary: emission-related HCHO; other: photochemical and background HCHO (Garcia et al., 2006);cNumbers indicate relative contributions to6OHnewfor a specific sub category of sources.
FWHM), and fitted using the Windoas and MFC software packages (Gomer et al., 1993; Fayt and van Roozendael, 2001). The trace-gas concentrations reported here rely on the following calibrations, with values in parentheses indicat-ing mean detection limits for species measured by DOAS#2: HONO (190 pptv) (Stutz et al., 2000), CHOCHO (150 pptv) (Volkamer et al., 2005b), NO3(5 pptv) (Sander et al., 2006), O3(DOAS#1: 1.3 ppbv; DOAS#2: 5 ppbv) (Bass and Paur, 1981), and SO2 (150 pptv) (Vandaele et al., 1994). For
HCHO (1 ppbv) the cross-section by Cantrell et al. (1990) was used for spectra evaluation; the concentrations were multiplied by 1.22 to reflect the results from cross-calibration of ultraviolet and infrared spectral parameters of HCHO (Volkamer et al., 20051). For NO2 (430 pptv), reference spectra were recorded by placing a 2-cm long quartz-cuvette 1Volkamer et al., 2005, CP26 at http://www.colorado.edu/
into the light beam, which was filled previously with a mix-ture of approximately 1% NO2/N2to atmospheric pressure. The HONO/NO2 ratio was determined from simultaneous fitting of resolution-adjusted literature cross-sections and any HONO contamination of the cuvette was corrected by sub-tracting an appropriately scaled HONO spectrum from the cuvette spectrum. This approach eliminates the possibility of HONO contaminated NO2reference spectra; we success-fully used it in cross-comparisons of the DOAS and LOPAP techniques (Kleffmann et al., 2006). NO2 concentrations were scaled to match the average of various NO2 reference spectra as determined by Orphal (2003). Trace-gas con-centrations that were evaluated in different spectral ranges (HONO, NO2, HCHO and O3)were found to be indepen-dent of the spectral range used for evaluation (within error limits).
2.1.2 Proton-Transfer-Reaction Mass-Spectrometry (PTR-MS)
Acetaldehyde (CH3CHO) and acetone (CH3COCH3)were measured by a PTR-MS (Jobson et al., 2010), which was co-located with the DOAS instruments at the CENICA roof-top, about 16 m above the ground. The PTR-MS sensitiv-ity was determined with a multi-component compressed gas standard from Apel-Reimer Environmental (Denver, USA) containing acetaldehyde and acetone, among other hydrocar-bons. The standard had a stated accuracy of±5% for oxy-genated species, better than 5% for hydrocarbons, and multi-point calibrations were performed every couple of days. Ad-ditional measurements of alkenes by a Fast Isoprene Sensor, supplemented by gas-chromatography (GC-FID) analysis of canister samples are described in detail elsewhere (Velasco et al., 2007).
2.1.3 Spectroradiometry
Photolysis frequencies of HONO (JHONO), HCHO (JHCHO), CH3CHO (JCH3CHO), O3 (JO3), CHOCHO (JCHOCHO),
CH3COCH3 (JCH3COCH3)and other trace gases were
mea-sured by spectroradiometry. The spectroradiometer was mounted on top of the measurement cabin with a clear field of view and measured solar actinic flux spectra from 280 nm to 450 nm with a spectral band pass of 1 nm. The step width was set to 2 nm below 320 nm, and 5 nm above. The radia-tion from the upper hemisphere was collected by a diffuser-optic with almost uniform sensitivity for all angles of inci-dence within a solid angle of 2πsr. A double monochro-mator (Bentham DMc 150) equipped with a tunable grat-ing (2400 grooves/mm) was used for wavelength dispersion and a photomultiplier for photon detection. The actinic flux calibration of the spectroradiometer was performed before and after the campaign at the Forschungszentrum Juelich in Germany using certified irradiance standards as described in Kraus et al. (2000). Unless otherwise noted, the
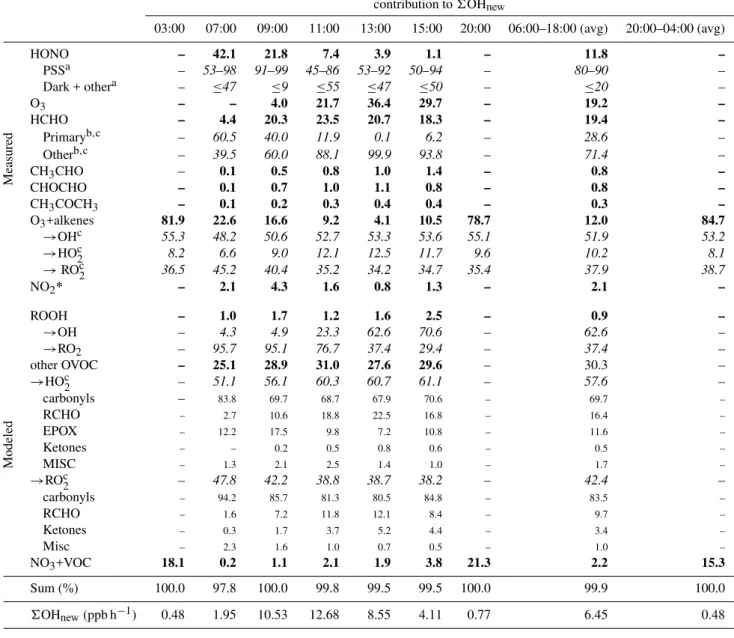
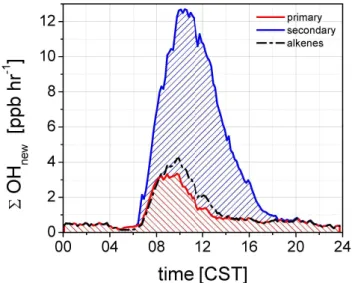
ab-Fig. 1.Diurnal profiles of new ROxradical formation from different
sources. The categories marked with a star (*) indicate that the reactants are not constrained by measurements. The bottom graph shows the contribution of each ROxspecies to6OHnew, accounting
for their respective conversion factors.
sorption cross-sections used to calculate photolysis frequen-cies were the same as described above; for O3, the section at 295 K was employed; for HONO the current cross-section recommendation (Sander et al., 2006) was multiplied by 1.43 in order to match recent absolute measurements of
JHONO (Wall et al., 2006); for CH3CHO and CH3COCH3 the spectrum and quantum yield data for radical produc-ing channels were taken from Sander et al. (2006). Re-sultant J-values were multiplied by 1.08 (surface albedo) to account for the upwelling portion of the photon actinic flux. The overall uncertainties for the photolysis channels are 25% for (O3→O1D, CHOCHO→radicals), and 15% for (HONO→OH, HCHO, CH3CHO, CH3COCH3→radicals). 2.2 Radical production rate calculations
protocols developed by Saunders et al. (2003) and Jenkin et al. (2003), and has recently been updated for aromatic oxida-tion schemes (Bloss et al., 2005a, b). MCM, a near-explicit mechanism comprising 135 VOCs and more than 13 500 re-actions, is ideally suited to test ROx radical production be-cause it contains limited chemical lumping. This enables (1) accounting of individual radical production and loss path-ways; and (2) expression of ROxradical production rates in terms of equivalent OH radical production rates as defined by Eq. (1):
6OHnew=P (OH)+γHO2·P (HO2)+γRO2·γRO·P (RO2) (1)
where P-values represent the rate of production of OH, HO2 and RO2radicals from closed shell molecules, and gamma values represent the efficiency to propagate RO2 and HO2 radicals into OH radicals;γHO2,γRO2, andγROare defined in
Eqs. (6–8) in Sheehy et al. (2010), and are calculated by the MCM as a function of changing experimental conditions, i.e., NO, NO3, HO2, RO2concentrations, and VOC speciation.
The box-model was constrained by median time-profiles of the above radical precursor concentrations, J-values, ox-idant concentrations (OH, HO2, O3, NO3), and concentra-tions of radical sinks, i.e., 103 VOCs, NO, NO2, SO2, CO (Sheehy et al., 2010, Supplementary Information). The OH reactivity of the constrained model reproduced well the di-urnal variations of OH-reactivity observations (Shirley et al., 2006), and were generally somewhat lower (see Part 2). The loss mechanisms of secondary species formed via the oxida-tion of hydrocarbons include reacoxida-tion with OH radicals, NO3 radicals, O3, sunlight, and dilution. The dilution term was estimated in two ways: (1) using CO as a tracer for dilution in the rising planetary boundary layer (PBL) and pollution export from the MCMA (Garcia et al., 2006), and negligi-ble dilution during the night (this method lead to chemical accumulation of oxidation products in the code and is con-sidered a lower limit for dilution); (2) to overcome chemical accumulation in the afternoon and at night, additional dilu-tion was calculated to match predicdilu-tions of photochemical HCHO with observations (see Sect. 2.4).
HONO photolysis is calculated as the absolute radical flux from HONO photolysis rather than reflecting net-production (i.e., HONO photolysis flux minus the flux from the OH+NO recombination reaction). We feel this is justified because even a negative net radical flux from HONO could still have a positive effect on photochemical radical cycling and ozone formation. This is because the fate of an OH radical is de-termined primarily by VOC reactions, and only a small por-tion reacts with NO; a newly formed OH radical thus adds efficiently to the production of RO2 and HO2 that recycle OH multiple times before they are removed, and add to the formation of ozone. The net rate of ozone formation due to HONO can hence still be positive, even though the net-production of OH from HONO might be negative. Account-ing for HONO on a net-flux basis would not account for this
chemical amplification of radical fluxes from HONO. We ac-counted for HONO on an absolute flux basis for two reasons: (1) this definition does justice to the true role of HONO to jump start photochemistry during morning hours; and (2) this definition allows us to quantitatively define the concept of “chain length” as the amplification of radical source fluxes (this paper) to radical recycling fluxes (Part 2, Sheehy et al., 2010). It turns out that an OH radical that is produced in the early morning hours is re-cycled about 3–4 times before it is removed by radical sink processes.
In principle, a similar argument could be made for the radical source from the thermal decomposition of Peroxy Acetyl Nitrate (PAN). We have calculated the radical pro-duction from PAN, and find that in this urban environment much more PAN is formed than dissociates, to the point that even accounting for chemical amplification of PAN for-mation is almost exclusively a net radical sink in the near field chemical regime inside the MCMA; hence we have not considered PAN as a radical source. OH radical pro-duction rates from the reaction NO2*+H2O→OH+HONO was calculated as P(OH)NO2∗=NO2·J(NO2*)·q, where J(NO2*) is the non-destructive excitation rate of NO2, de-termined from our spectroradiometer data, andq=0.001·
kH2O·[H2O]/(kH2O·[H2O]+kO2·[O2]+kN2·[N2]) is the
frac-tion of NO2* collisions with water and air molecules that leads to HONO and OH as products; rate constant val-ues arekH2O = 1.7 ×10
−10molec cm−3s−1,k
O2 = 3.0 ×
10−11molec cm−3s−1, kN2 = 2.7× 10
−11molec cm−3s−1 (Li et al., 2008, P. Wine, personal communication, 2007). Notably the OH radical production from further photolysis of any HONO that may form from NO2* is accounted among the OH source from HONO.
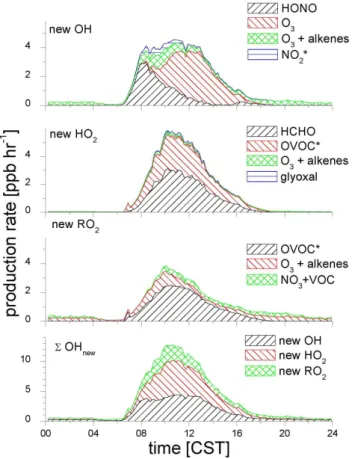
Fig. 2. Spectral proof for the detection of NO3radicals in Mex-ico City (29 April 2003, 01:17 a.m. CST). The atmospheric spec-trum (blue line) has been corrected for NO2, and water absorptions, and shown with an accordingly scaled NO3-reference spectrum (red
line) from our previous work.
NO3-depleted air masses. As reactive unsaturated VOCs are expected to be depleted in O3- and NO3-rich air, this as-sumption is compatible with an upper limit estimate of the role of NO3radicals as a source for ROxradicals at the roof-top level. These uncertainties were minimized by constrain-ing the box-model with data collected at roof-top level (also DOAS#1 height). Finally, the sensitivity of the model to-wards statistical artifacts was tested by constraining with (1) average, and (2) median time-profiles of the above measure-ments; the results agreed within 10% at daytime, whereas larger differences were observed at night (see Sect. 3.3). Un-less otherwise noted the results are reported from the model constrained by the median time series data.
2.3 Characterization of horizontal and vertical gradients
A possible complication in constraining the MCM model might arise from the fact that measurements used to constrain the model are conducted over extended spatial scales (LP-DOAS, FTIR) and in the form of highly localized “point” measurements (e.g., PTR-MS). The direct comparison of radical fluxes inferred from these measurements is based on the assumption that the air mass is well mixed. This assumption is tested below, and appears to be justified for the following reasons. Spatial gradients are expected to be strongest for primary pollutants (e.g., CO) and somewhat less pronounced for secondary pollutants (e.g., O3). Sam-pled concentrations of CO and O3at comparable heights by point and line-averaging techniques at the CENICA super-site show excellent agreement (Dunlea et al., 2006). Fur-ther, concentrations of several species that were probed by
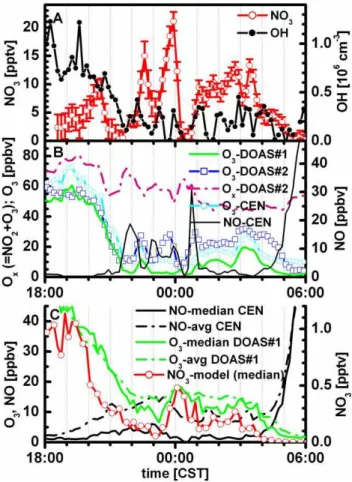
Fig. 3. Nighttime concentration-time profiles of NO3radicals and OH radicals during the night from 25 to 26 April 2003(A), O3
(from two LP-DOAS and a point sensor), Ox(sum of O3and NO2)
and NO(B). Panel C compares average and median nighttime O3
and NO concentrations, and shows NO3radical predictions from
the median model. The nighttime OH concentration tends to follow the time trace of O3better than that of NO3radicals.
both open-path DOAS instruments facing in different direc-tions, spanning different spatial scales and sampling at differ-ent mean heights show excelldiffer-ent agreemdiffer-ent during the day (within measurement precision). For example, HONO was measured by two LP-DOAS instruments at 16 m and 70 m above ground, and vertical gradients are observed at night-time and in the early morning. However, the data from both instruments have converged to within measurement precision already 1.5 h after sunrise (06:00 a.m. CST), as illustrated for HONO in Fig. 4. During the daytime, which is the primary focus of this study, the air mass is thus considered to be well mixed.
Fig. 4.Measured (red, black) and calculated (green, blue) HONO concentrations. Shown are campaign-averaged data(a, c)and data averaged over cold-surge events(b, d). The top two graphs show that varying OH within uncertainty (lower limit) improves the model measurement agreement in the early morning. The bottom two graphs show that model predicted HONO is systematically higher than the observations during mid- morning; an additional HONO sink is needed. Use of a higher value ofJHONOaccording to Wall et al. (2006) improves the
agreement between measured and modeled HONO concentrations significantly.
this inhomogeneity (see Figs. 3 and 4). Significant vertical gradients are observed for HONO and ozone. In an attempt to minimize the effect of vertical gradients on the prediction of secondary sources we chose to interpolate vertical gradi-ents in oxidants to assure that constraints to the MCM model are at a comparable height (OH, O3, NO3). For the most precise measurements of low O3concentrations, we use di-rect measurements from DOAS#1 (for a discussion of possi-ble interference issues with indirect techniques see Dunlea et al., 2006). NO3radical concentrations at higher altitudes are adjusted here to roof level (Sect. 2.2). Figure 3a illustrates the significant variability in NO3concentrations in our line-averaged detection of several kilometers spatial scale. Pe-riods of steeply rising NO concentrations are followed by periods when essentially no NO3 is observed. Also shown are the O3 concentrations measured by both LP-DOAS and a point-sensor, the sum of NO2and O3(Ox, from DOAS#2), and NO during that night (Fig. 3b). The good agreement in the relative variation between the point-sensor and DOAS#1, which are located at comparable altitudes, illustrates that at night the air mass is relatively homogeneous over horizontal spatial scales on the order of few 430 m. The 5–10 ppbv off-set in the point sensor is probably not real, as is discussed in Dunlea et al. (2006).
Implications of nighttime inhomogeneities for the MCM model
2.4 Source apportionment of photochemical HCHO calculations
We attempted to identify the relevance of different classes of VOC to the photochemical production of HCHO. We used the above-mentioned box model, without the HCHO constraint, to predict the rate of HCHO production from hydrocarbon oxidation chemistry during mid-morning con-ditions. The model was initiated using a constrained VOC split as given in the Supplementary Information of Sheehy et al. (2010), and oxidant and light conditions were kept constant: [OH]=0.18 pptv, [O3]=55 ppbv and
JNO2=5×10
−3s−1. The fate of peroxy radicals is about 90% determined by reactions with NO in our model, which is con-sistent with the modeling of field data at peak photochemical productivity during mid-morning hours (see Fig. 6 in Sheehy et al., 2010). In a first set of model runs, the contributions from individual VOC classes as HCHO precursors were cal-culated by tracking the rate of HCHO production and vary-ing the VOC split; only a svary-ingle VOC class was set to non-zero, while the other VOC concentrations were set to zero. Second, to determine the relative contribution of individual oxidants, the rate of HCHO production was calculated with only that oxidant i.e., OH, O3, NO3; the other oxidant con-centrations were set to zero; identical sets of VOC and ki-netic parameters were used. Third, to calculate the percent-age of HCHO production as a first or higher generation VOC oxidation product, the yield of photochemical HCHO was compared after 10 min and several hours of oxidation (see Volkamer et al. (2001) for details on the argument). Only a small increase in the rate of HCHO production was observed over extended oxidation times, indicating that some HCHO is indeed produced as a higher generation oxidation prod-uct from OVOC oxidation, but this fraction is rather small (16%). Most HCHO predicted from the MCM is thus formed as a first generation oxidation product. For most VOCs that are constrained in the model from the MCMA-2003 dataset, the formation of HCHO has been studied in the laboratory. The chemical pathways represented in the MCM are thus largely based on experimental constraints, and only a mi-nor portion of predicted HCHO is expected to be formed from pathways that might be subjected to the more uncer-tain structure-reactivity relationships that (to a larger extent) underlie the MCM representation of OVOC oxidation.
Sensitivity studies using the flexible top MCM box model revealed that predicted HCHO accumulated to unrealistic concentrations later in the day. This prompted us to inves-tigate whether the cause of this overestimation in the af-ternoon was due to uncertain chemical pathways that form HCHO in the model, or to an underestimate of pollution ex-port (dilution). Photochemical sources from HCHO turned out to be well constrained (see above, and also Sect. 3.5). It was concluded to adjust the dilution sink of HCHO in the model to bring predicted HCHO in the later day into agree-ment with the photo- chemically formed portion of observed
HCHO (Sect. 3.5). We used a modified Eq. (1) in Garcia et al. (2006) to calculate the photochemically formed portion of ambient HCHO: [HCHO]phot=[HCHO]meas−0.0015·[CO], where the latter term represents a scaled tracer for HCHO emissions according to results from Garcia et al. (2006). The additional dilution reduced the afternoon HCHO by a factor of about 2.
2.5 Source apportionment of HONO calculations
The sources of HONO investigated include photo-stationary-state HONO (PSS-HONO; under equilibrium conditions PSS-HONO=k·OH·NO/JHONO), dark sources from the OH+NO recombination reaction, heterogeneous formation on urban surfaces, or aerosols, and photochemical sources. The MCM model is constrained by measurements of OH, NO, JHONO, dilution, and we used the model to calcu-late PSS-HONO. Nighttime OH only explained a small in-crease in HONO concentrations over the course of a night, and an additional HONO source was parameterized as a NO2→HONO conversion rate to match the HONO produc-tion between 08:00 p.m. to 04:00 a.m.; this “dark-HONO” source was then applied throughout the day.
We employed the box model in the following three sce-narios: inputs are constrained based on (1) campaign aver-age concentration time-profiles, and (2) median concentra-tion time-profiles. In an addiconcentra-tional model scenario (3), only data from “cold-surge” days were averaged (de Foy et al., 2005), which are characterized by the highest relative hu-midity and the lowest PBL height. The highest daytime HONO concentrations are expected during such “cold-surge” events, as HONO concentrations have been shown to corre-late with relative humidity (Stutz et al., 2004). For each of the three model scenarios, the sensitivity of the model output was tested by varying the OH concentration within measure-ment uncertainty (offset of 0.01 pptv was subtracted), vary-ing the dilution case, and varyvary-ingJHONO within twice the experimental uncertainty (multiplication of J-value based on (Stutz et al., 2000) by 1.43 reproduces our observations, and is in general agreement with recent direct measurements of
JHONOby Wall et al. (2006) that indicate scaling by a factor of 1.28). Any photochemical sources are evaluated as the dif-ference to model predicted and “observed” daytime HONO. The model generally predicted HONO concentrations that were consistent with measured concentrations in the morn-ing.
2.6 Radical production from oxygenated VOC (OVOC) photolysis
neutral in terms of radical production, since in principle the radical that is consumed by initiating the oxidation leads to the formation of another radical (i.e., a RO2radical). On the other hand, OVOC photolysis converts a closed shell OVOC molecule into two radicals and is an efficient radical source. The model was constrained using measurements ofJ(NO2) and the other photolysis parameters were parameterized rel-ative toJ(NO2) in the model.
In Table 1 the production of OH, HO2 and RO2 from OVOC photolysis is tracked using the constrained MCM model (for details see Part 2), and summed for a number of compound classes, i.e., aldehydes, multifunctional car-bonyls, epoxides, ketones, and other miscellaneous OVOC. Aldehydes (RCHO in Table 1) are counted as the reaction of (multifunctional) carbonyls with only one end standing bonyl group. The photolysis happens at the end-standing car-bonyl group (associated with J-values 11, 15, and 17 in the MCM code). This group does not include HCHO, which is constrained in the model, and represented separately in Ta-ble 1 (see above). Carbonyls are counted as the flux from more complex molecules, which typically have 2 or 3 car-bonyl groups, and photolysis is associated with J-values 4, 34, and 35 in MCM. This group includes dicarbonyls other than glyoxal, which is constrained in the MCM and repre-sented separately in Table 1. Epoxides (EPOX) are charac-terized as compounds with more than one functional group; however, photolysis occurs at the epoxy functional group (note that both dicarbonyls and epoxides are associated with J-value 4 in the MCM, and our lumping actually considers the structure of the molecule as a means to differentiate the lumping). Ketones (KETO) are grouped as compounds that generally have more than one functional group; however, the photolysis occurs at the ketone group. This group is associ-ated with J-value 22 in the MCM code. Other miscellaneous OVOC (MISC) are compounds that photolyze with J-values 18 and 19. Hydroperoxides (ROOH) are lumped as the flux from reactions that photolyze with a J-value 41.
The radical fluxes from OVOC are taken from the MCM model that applied the increased dilution rate scaled from photochemical HCHO (Sect. 2.4) to all other predicted OVOCs.
3 Results and discussion
3.1 OH-equivalent ROxradical production rates
The calculated production for new ROx from the HOx -constrained box model is shown in Fig. 1. The total radi-cal production rates presented in the bottom panel are shown as OH-equivalents, termed 6OHnew, and account for the conversion factors in the radical propagation steps, i.e., RO2→OH and HO2→OH, as described in more detail in Part 2 (Sheehy et al., 2010). Figure 1 is accompanied by Ta-ble 1, which shows the percent contribution to6OHnewfrom
various sources at selected times throughout the day, as well as day and nighttime averages. Pathways with an insignifi-cant contribution are not shown.
The daytime 6OHnew around noon is about 25 times larger than at night. A distinct diurnal pattern is observed. Radical production rates are high already shortly after sun-rise (2 ppb h−1, or 1.1×10⁷molec cm−3s−1 at 07:00 a.m.), predominantly due to the production of OH radicals. The production rates continue to rise and reach a plateau in the mid-morning (13 ppb h−1, or 6.9×10⁷molec cm−3s−1 at 10:00 a.m.). Sustained radical production persists at high level until about 12:30 p.m. and begins to decrease afterwards. A continuous decrease in radical production is observed during afternoon hours until about 06:00 p.m. (1.0 ppb h−1, or 5.4×10⁶molec cm−3s−1 at 06:00 p.m.). Radical production rates remain flat until the early morning hours. The decrease in OH, HO2, and RO2radical produc-tion rates during afternoon hours coincides with decreasing O3concentrations due to pollution export from the MCMA, and reflects the strong coupling between the abundance of secondary pollutants and photochemical activity.
The 12-h daytime average 6OHnew (6.5 ppb h−1, or 3.5×10⁷molec cm−3s−1) is equally attributable to OH and HO2 sources (both about 40%), while RO2 sources con-tribute about 20%. The photolysis of secondary OVOC other than HCHO accounts for about 33% of6OHnew. 6OHnew from other OVOC is 60% due to new HO2formation, and 40% due to new RO2formation. O3and HCHO are the most important single molecule radical sources in the MCMA, and are equally important (20% each). The O3/alkene source adds nearly 15%, with new OH- and RO2 production con-tributing about equal amounts. HONO contributes about 12% over this average period, and is more important in the morning. Our model estimates an average daytime NO3 rad-ical concentration of about 0.6 pptv and about 1 pptv around noon. Daytime NO3radical reactions make a very small con-tribution to daytime6OHnew, reflecting high NO concentra-tions, and the fact that radical production rates from other sources are comparably large.
and alkenes could account on average for about half of night-time6OHnew. However, such scaled NO3concentrations do not account for the rapid NO3 sink reaction with NO (see Sect. 3.3, and Fig. 3), and the actual6OHnewfrom NO3at roof-top-level is likely much lower. In the near field chemical regime at roof-top-level, the NO3/alkene source is a minor pathway for6OHnewat night.
3.2 Production of OH, HO2, and RO2radicals
3.2.1 Sources for OH radicals
The production of OH radicals from sources is high (4 ppb h−1, or 2.1×10⁷molec cm−3s−1) about two hours af-ter sunrise, and near constant throughout the morning. It starts to decrease after noontime (12:00 p.m. CST), and is at least an order of magnitude lower at night. The predom-inant daytime OH radical sources are: (1) the photolysis of HONO, (2) the photolysis of O3, and (3) the O3/alkene reac-tions. In the early morning hours, the photolysis of HONO dominates the formation of OH radicals. As photochemical O3accumulates, the photolysis of O3becomes a dominant source of OH in the late morning and throughout most of the day, accounting for about 80% at peak ozone levels. It is noteworthy that small but “non-zero” O3 concentrations in the presence of high alkene concentrations during early hours, and unmeasured products from nighttime processing of VOCs present a significant source for OH radicals other than HONO in the early morning. Few ppb of O3 coexist with several 10 ppb of NO shortly after sunrise, and con-tribute about 20% to OH production, illustrating how small changes in ozone may have a significant effect on OH radi-cal production rates at this time of day. Difficulties with the exact quantification of low O3levels exist for indirect tech-niques, which are widely used in current air quality monitor-ing networks (see discussion in Dunlea et al., 2006). An ad-ditional uncertainty exists in the speciation of alkenes, which can be affected during sample storage (Atkinson et al., 1984; Jenkin et al., 2005). OH production from O3/alkenes is the only significant gas-phase non-photolytic source of OH dur-ing the day and at night.
3.2.2 Sources for HO2radicals
The production of HO2radicals is smaller than that of OH shortly after sunrise, and continuously increases to reach val-ues around 5.8 ppb h−1(or 3.1×10⁷molec cm−3s−1) around noontime. As in the case of OH, it starts to decrease after noon. New HO2is only a significant radical source during the day; the new HO2 production is at least two orders of magnitude lower at night. The predominant daytime sources for HO2are (1) the photolysis of HCHO, and (2) the photol-ysis of other secondary OVOCs. HCHO photolphotol-ysis accounts for more than half, the sum of other OVOCs for about 45% of the midday HO2production. The photolysis of CH3CHO
and O3/alkene reactions contribute less than 2% new HO2 radicals throughout the day. During the night the only signif-icant HO2radical source is from O3/alkene reactions. 3.2.3 Sources for RO2radicals
The diurnal profile of RO2 radical production is qual-itatively similar to that of HO2 radicals, though peak values around noontime are smaller (3.8 ppb h−1, or 2.0×10⁷molec cm−3s−1at 10:00 a.m.). Also, the new RO2 production rate is about an order of magnitude lower at night, compared to peak daytime production. The predom-inant daytime sources for RO2 are the photolysis of sec-ondary OVOCs, accounting for nearly 78% of new RO2 rad-ical production at midday, and about 66% on a 12-h day-time average basis. Some minor additional RO2is produced from O3/alkene reactions and reactions of NO3with alkenes, phenol- and furanone-type products of the OH-radical initi-ated oxidation of aromatic hydrocarbons. While these reac-tions only account for a minor source of RO2radicals, they provide an interesting link between the ROxand NOxcycles (see Sect. 3.3).
3.3 Direct observations of NO3radicals
NO3 radicals were detected during all nights that measure-ments were attempted. The spectral proof of the successful detection is presented in Fig. 2. The highest optical density of NO3radical absorption was 9.6×10⁻³, corresponding to a concentration of (9.6±1.1)×108mole cm−3or (50±6) pptv. The nighttime concentration-time profile varied between in-dividual nights. Typically, detectable concentrations were observed during events that lasted 1–3 h. The NO3 con-centrations typically peaked around midnight (±2 h), some-times also later in the evening, and varied between 10 and 50 pptv. The nighttime average NO3 mixing ratio for all nights (19:00–04:00) is about 7 pptv (at DOAS#2 heights). No NO3 was detected during the afternoon hours and the early evening prior to sunset, and concentrations were be-low the detection limit during early morning hours. To our knowledge this is the first direct detection of NO3radicals in the urban core of a megacity.
information about the processing of primary pollutants at night. Freshly emitted PAHs are collocated in plumes that contain elevated NO, which rapidly destroys NO3 radicals: NO3+NO→NO2. This is corroborated in Fig. 3, where ele-vated NO3concentrations tend to correlate with elevated O3, while air masses with higher NO2 (lower O3)tend to con-tain virtually no NO3. We conclude that even though NO3 radical concentrations of 50 ppt are observed, this should not be taken as evidence that primary pollutants, like PAHs, are easily processed by NO3radicals at night.
3.3.1 Does NO3contribute to nighttime OH?
Nighttime OH radical concentrations are currently not well understood and subject to ongoing debate. As shown in Fig. 3, the nighttime OH concentration correlates better with O3 than with NO3 in the early evening. This is true also, though to a lesser extent, in the later night hours. However, a conclusion on whether O3or NO3control the nighttime OH concentration is complicated by the fact that both gases tend to be correlated. From the discussion presented in Sect. 3.1, it is likely that NO3radicals make a minor and possibly sig-nificant contribution, to nighttime OH radical concentrations already in the near field chemical regime. The occurrence of NO3 concentrations in episodes, and the lack of co-located open-path NO data observed in the same air mass as NO3, makes it difficult to compare with a median model. Like NO, NO3radicals facilitate the cycling of RO2and HO2into OH. It is noteworthy that the propagation efficiency of RO2into OH radicals is controlled by NO in our model; NO3 reac-tions are negligible in all cases studied. Different condireac-tions are expected in the intermediate and far-field photochemical regime, i.e., NO3enriched air masses at altitudes of several hundred meters above ground, and in the O3-rich city plume downwind of the MCMA. In similar air masses, NO3 con-centrations of several hundred pptv have been observed (von Friedeburg et al., 2002; Brown et al., 2006). Under these conditions NO is very low; the efficiency of RO2 radicals to propagate into OH radicals (RO2+NO3→RO+products; RO+O2→HO2+products; HO2+NO3→OH+products) con-versions is controlled by NO3reactions, which proceed more than an order of magnitude slower than the analogous reac-tion involving NO; NO3 competes with peroxy-radical self reactions which can terminate the radical chain. The effi-ciency for RO2→OH conversion is thus lower than in a high NO scenario such as ours. A possible exception could arise from recent findings that peroxy-radical self reactions prop-agate the radical chain (Hasson et al., 2004; M. E. Jenkin, personal communication, 2006). If these reactions were con-firmed as a more general pathway, NO3reactions would gain importance as a source for nighttime OH-radical in the in-termediate and far-field chemical regime downwind of large urban centers. Our model indicates that NO3does not con-tribute much to nighttime OH production at roof level during MCMA-2003.
3.3.2 Processing of furanones by daytime NO3
We did not find evidence of NO3 radicals accumulating to measurable concentrations during the day in Mexico City. This is in contrast to Houston (Geyer et al., 2003), and New England (Brown et al., 2005), where daytime NO3 concen-trations have been observed, and form a non-negligible pro-cess for the oxidation of highly reactive VOC. This difference is the result of lower O3during afternoons, and likely also significant NO3 sink reactions in Mexico City. In contrast to Houston, biogenic VOC concentrations are much lower in Mexico City (quantified as<5% of OH-reactivity during MCMA-2003 in Volkamer et al., 2006).
However, the daytime NO3radical concentration is on the order of 0.5–1 ppt in our model. NO3 reactions with an-thropogenic alkenes, phenol-type and furanone-type prod-ucts from aromatic hydrocarbon oxidation contribute about 26%, 36%, and 15% of the daytime RO2sources from NO3 -reactions, respectively. These reactions account in sum for about 7% of the daytime NO3-sink reactions, and thus can compete with rapid NO3 photolysis and NO reactions for NO3 radicals. The NO3 production rate at 100 ppb O3 and 10 ppb NO2 is about 1.3×10⁷molec cm−3, and the overall flux through NO3+VOC reactions is ca. 106molec cm−3s−1. Daytime NO3-reactions with furanones account for some 5– 15% of the furanone lifetime in our model. The relevance of daytime NO3-reactions, previously noted only for phe-nols (Kurtenbach et al., 2002), is highlighted here also for furanone-type compounds.
3.3.3 N2O5uptake to aerosol: a likely source for nitryl chloride in the MCMA
Ox(sum of NO2 and O3)is found to decrease at a rate of 2.1 ppb h−1at night, see Fig. 3. This loss of Oxis attributed to the combination of various factors: (1) Ox to NOy con-version processes, such as N2O5hydrolysis on aerosols and ground surfaces, (2) dry deposition of Oxor NOy, and possi-bly also (3) pollution export from the MCMA.
is efficiently converted into ClNO2 (Behnke et al., 1997; Roberts et al., 2008). Based on this rough estimate we at-tribute a significant, though likely not major portion of the observed Oxlosses (on the order of 10%, or 2–3 ppb) to the formation of ClNO2.
3.4 Source and sink considerations of HONO
HONO is heterogeneously formed at night, and is an impor-tant radical source in the early morning (Platt et al., 1980), yet our understanding of the HONO sources remains in-complete. The constrained MCM model is found to pre-dict HONO surprisingly well. The measured HONO profiles from DOAS#1 and DOAS#2 are compared with HONO pre-dictions in Fig. 4. Regardless of the meteorological condi-tions, PSS-HONO accounts for at least half of the HONO concentrations at 07:00 a.m., and virtually all HONO at 09:00 a.m. Figure 4 demonstrates that a small OH con-centration in the presence of high morning NO concentra-tions account for ppbv-levels of HONO at 08:00 a.m. Few previous studies had simultaneous and collocated OH, NO, HONO and JHONO measurements available; the interpre-tation of most HONO as being a radical reservoir is fully consistent with the error bars presented in Fig. 3 of Mar-tinez et al. (2003). Additional HONO formation from dark sources, like the heterogeneous NO2 conversion on urban surfaces (see, e.g., Arens et al., 2001; Ramazan et al., 2006 and references therein) do appear to contribute significant amounts of HONO only before 08:00 a.m. Thereafter PSS-HONO (and a minor contribution from dark PSS-HONO sources) account for essentially all of the observed HONO. Around solar noon the PSS and dark sources can account for some (35±15) pptv; these model results are robust for different meteorological conditions and independent of relative hu-midity. This is of the same order of magnitude as the up-per limit HONO concentration that can be inferred from the DOAS#2 detection limit. Statistical averaging of DOAS#2 data yields (58±76) pptv and (21±76) pptv HONO on a cam-paign average and median basis; error bars correspond to one-sigma standard-deviation among individual days around solar noon. An independent quantification of daytime HONO concentrations in Mexico City remains desirable. However, it is noteworthy that photo-induced processes (included in “dark+other” HONO sources in Table 1) appear to contribute – if any – only very minor amounts to ambient HONO con-centrations in Mexico City. For example, a photochemical HONO source of 5×10¹⁰molec cm−2s−1 from the ground (Stemmler et al., 2006), diluted in a PBL of 3 km height (typ-ical for Mexico City), corresponds to a HONO mixing ratio of only 4.3 pptv around noon.
The characterization of daytime HONO sources in the ur-ban atmosphere – if attempted in the future – suffers from the need to subtract a large steady-state HONO concentra-tion. This steady-state HONO can only be quantified at the precision with which the reaction rate constant of OH with
NO is known, i.e., 20% (Sander et al., 2006); in our estimate the largest uncertainty is the absolute uncertainty in OH mea-surements. For example, in order to quantify a photo-induced HONO concentration of 25 pptv on top of a 25 pptv PSS-HONO background with 25% uncertainty, the absolute pre-cision of OH measurements needs to be 15% or better; such measurements are currently very difficult to achieve. High precision measurements of HONO (Kleffmann et al., 2006), NO, andJHONOare necessary – though unlikely to be limit-ing – for efforts to quantify excess HONO over PSS-HONO in the urban atmosphere.
Faster than expected HONO photolysis?
We observe a significant delay in the decrease of HONO in the model ifJHONOis based on the value listed in Sander et al. (2006). Notably, by 09:00 a.m. the contribution of dark HONO sources makes a very small contribution (<10%, see Table 1), and HONO concentrations between two DOAS in-struments agree well. This indicates that uncertain scaling of dark HONO sources and vertical gradients do not appear to limit our measurement-model comparison at 09:00 a.m. The difference between measured and modeled HONO concen-trations persists for several hours in the morning (see inset of Fig. 4) until HONO concentrations fall to values close to the detection limit. Model predicted HONO exceeds the observations by about 70% at 09:00 a.m., when uncertainty in PSS-HONO production rate is on the order of ∼40% and uncertainty in the HONO measurements by DOAS#2 is ∼35%. Model predicted HONO and observed HONO are only marginally in agreement. The over-prediction of HONO in the model indicates that a HONO sink is missing in the model. By scaling our JHONO by 1.43 we observe good agreement between the model and measurements through-out the day (see Fig. 4, lower panels); scaling by 1.22 brings the predicted HONO into marginal agreement with DOAS#2 error bars.
3.5 Source apportionment of HCHO
The observed formaldehyde concentrations in the MCMA are a result of emissions, photochemistry, and an unknown background source, which is generally small (1–2 ppb) and appears to be related to a VOC chemical source (Garcia et al., 2006). The atmospheric lifetime of HCHO in the MCMA is on the order of 1–2 h; sustained and elevated concentra-tions of HCHO in the MCMA are thus an indicator that HCHO is constantly formed from these sources throughout the day. Garcia et al. (2006) demonstrated that on a 24-h av-erage basis, up to 70% of observed HCHO in the MCMA is photochemically produced. Measured ambient HCHO, and the portion from photochemical and background sources are compared with the MCM predictions in Fig. 5. The lower limit nighttime OH concentration leads to accumulation of several ppb of HCHO (not shown), consistent with the in-terpretation of “background HCHO” from a chemical source (Garcia et al., 2006). Directly emitted HCHO is more rele-vant during morning hours, and photochemical sources are the most significant about 2 h after sunrise. Direct HCHO emissions are important to help jump start photochemistry (Lei et al., 2009), but become less important to sustain ozone and SOA formation in the mid-morning and later when pho-tochemical sources of HCHO dominate.
MCM was used to characterize photochemical HCHO pro-duction in terms of: (1) the relative contribution of HCHO sources by VOC class (i.e., alkanes, alkenes, aromatics, OVOCs); (2) the relative contribution of oxidants, i.e., OH, O3, and NO3; and (3) the portion of HCHO formed as a first vs. second (and higher) generation oxidation product. The results of the HCHO source apportionment modeling are shown in Fig. 6. On a daily average basis, we find that an overwhelming majority of the photochemical HCHO pro-duction proceeds from reactions that yield HCHO as a first generation oxidation product. The oxidation of alkenes is the major VOC precursor, and OH is the predominant oxi-dant that leads to the formation of photochemical HCHO in the MCMA. The O3/alkene source, while significant, only accounts for some 17% of the photochemical HCHO pro-duction. The aromatic species make a smaller contribution, and are largely responsible for secondary HCHO production. NO3 radical initiated oxidation of VOCs and photolysis re-actions are insignificant compared to other sources of HCHO in the MCMA.
3.6 Comparison of Mexico City with other case studies
Detailed studies for radical production are available for com-parison from Los Angeles (Griffin et al., 2004), Nashville (Martinez et al., 2003), Pabsthum downwind of Berlin (Al-icke et al., 2003), New York City (NYC; Ren et al., 2003), Milan (Alicke et al., 2002), Birmingham (Emmerson et al., 2005), Chelmsford downwind of London (Emmerson et al., 2007), rural environments (Zhou et al., 2002; Kleffmann et
Fig. 5.HCHO observations (black line) are compared to the portion of HCHO produced from photochemical sources and background sources (blue line, shaded blue area), and from emissions (shaded gray area); the dotted lines represent the upper and lower limits of subtracting out emissions sources according to the procedure de-scribed by Garcia et al. (2006). Modeled HCHO concentrations (red line) are shown in which dilution was adjusted to match the blue line (after 10:00 a.m., see Sect. 2.2).
al., 2005; Acker et al., 2006) and the free troposphere (Singh et al., 1995; Arnold et al., 2004).
3.6.1 Timing of radical production
It is generally expected that the radical production rate during summer follows the abundance of sunlight and peaks around the time of lowest solar zenith angle (solar noon). Such cor-relations are indeed observed in NYC, Nashville, rural en-vironments and also during cleaner days in Pabsthum and Milan, while peak radical production is shifted towards early afternoon hours in Los Angeles. There is only limited in-formation given about the timing of radical production in Birmingham and Chelmsford, though the choice of averag-ing times in the presentation of the results from those stud-ies (11:00 a.m.–03:00 p.m., centered around solar noon), and the relative importance of photolytic sources may be indica-tive of such correlation during summertime. Alternaindica-tively, a radical pulse from HONO in the early morning, decreas-ing radical production rate in the mid-morndecreas-ing, followed by a local maximum radical production rate around solar noon have been observed during individual days in Milan and Pab-sthum.
efficiently exported from the MCMA. The absence of both a morning peak and a mid-morning dip in the radical pro-duction rate is attributed to the particularly high rate from secondary sources (all formed as a result of photochemi-cal processing of pollutants): photolysis of HCHO, O3, and other OVOCs in sum contribute about 75% of the radical pro-duction rate around 11:00 a.m., and 85% around 01:00 p.m. In other words, whatever radical source starts the process-ing of pollutants gets amplified by further radical production from secondary pollutants; the surrounding mountains trap secondary pollutants within the basin during mid-morning. Results from the MILAGRO/MCMA-2006 campaign (Du-santer et al., 2009; Molina et al., 2010) are generally con-sistent with our earlier findings. Our analysis highlights two phenomena: (1) the importance of radical sources that start the photochemical processing in the early morning; and (2) the non-linear feedbacks between meteorology (i.e., pollu-tion export) and photochemical activity in the MCMA. These feedbacks have not been previously quantified at the radical level (i.e., radical production rates).
3.6.2 Absolute radical source strength
The overall radical production rate during MCMA-2003, as well as during the MILAGRO/MCMA-2006 field campaign (Dusanter et al., 2009) tends to be higher than in other urban environments, and on a routine basis is comparable to that found during a photochemical smog episode in Los Angeles in 1993 (Griffin et al., 2004). The radical production rate av-eraged over a 4-h time window centred near its peak is about 1.7 times higher than in Milan, 2 times that observed in Birm-ingham during summertime, 2.7 times that in Chelmsford, and 3 times higher than in Birmingham during wintertime. It is 3.3 times higher than in NYC and Nashville, 3.5 times higher than in Pabsthum, and 7–10 times than in rural envi-ronments. This comparison highlights the unique chemical activity of the Mexico City atmosphere.
Furthermore, the 24-h average HOxradical production rate in the upper troposphere – 2.3×10⁴molec cm−3s−1(Singh et al., 1995; Arnold et al., 2004) – is two to three orders of magnitude lower than in the MCMA. Recently, higher than expected concentrations of oxygenated hydrocarbons have been measured in the free troposphere (Kwan et al., 2006). Interestingly, new HOxproduction rates from CH3CHO and CH3COCH3 in Mexico City are comparable to those in the free troposphere, about 5×10⁵and 104molec cm−3s−1 re-spectively (11 km height, solar zenith angle SZA=15 degrees, [CH3CHO]=200 pptv, [CH3COCH3]=500 pptv). While O3 or HCHO photolysis are important radical sources in both of these very different compartments of the atmosphere, the higher-than-expected concentrations of CH3CHO in the free troposphere coupled with faster photolysis at higher altitude lead to HOx production rates that compare or even exceed that from O3or HCHO photolysis, emphasizing the role of other radical sources than ozone at high altitude (Frost et al.,
Fig. 6.Source apportionment of photochemical HCHO production.
(a)The precursors of HCHO are separated by VOC class. (b)The effect of different oxidants is assessed.(c)The time scale of HCHO production is assessed in terms of oxidation step. An overwhelming majority of HCHO is formed as a first generation oxidation product from VOC oxidation; HCHO formation as second- and higher gen-eration oxidation products makes only a minor contribution.
1999). The relevance of the polluted urban atmosphere as a source for oxidized hydrocarbons is expected to increase in the future.
3.6.3 Relative importance of different radical sources
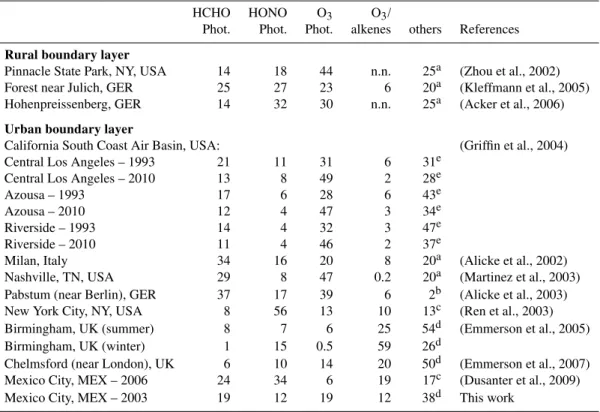
The average daytime contribution to radical production rates from different sources in the MCMA is compared to other urban influenced environments in Table 2. While OVOC appear to be the most important radical source, the relative importance of other sources is fairly homogeneous (see also Table 1, and Sects. 3.1 and 3.7). This is different from pre-viously studied atmospheres, in which typically one radical source dominates: HONO in NYC; HCHO in Milan; O3in the South Coast Air Basin in California (2010 scenario), and in Nashville, O3/alkene reactions in Birmingham during win-tertime, secondary OVOC in the South Coast Air Basin (1993 scenario), and in Birmingham and Chelmsford during sum-mertime. Downwind of Berlin, in Pabsthum, O3and HCHO photolysis are both particularly important. Despite the con-siderable variability among different urban polluted, and be-tween urban and rural atmospheres, some generalizations can be drawn.
HONO photolysis
Table 2.Comparison of the relative importance of radical sources in Mexico City with other urban and rural atmospheres (daytime average HOxradical production rates).
HCHO HONO O3 O3/
Phot. Phot. Phot. alkenes others References
Rural boundary layer
Pinnacle State Park, NY, USA 14 18 44 n.n. 25a (Zhou et al., 2002) Forest near Julich, GER 25 27 23 6 20a (Kleffmann et al., 2005) Hohenpreissenberg, GER 14 32 30 n.n. 25a (Acker et al., 2006)
Urban boundary layer
California South Coast Air Basin, USA: (Griffin et al., 2004) Central Los Angeles – 1993 21 11 31 6 31e
Central Los Angeles – 2010 13 8 49 2 28e Azousa – 1993 17 6 28 6 43e Azousa – 2010 12 4 47 3 34e Riverside – 1993 14 4 32 3 47e Riverside – 2010 11 4 46 2 37e
Milan, Italy 34 16 20 8 20a (Alicke et al., 2002) Nashville, TN, USA 29 8 47 0.2 20a (Martinez et al., 2003) Pabstum (near Berlin), GER 37 17 39 6 2b (Alicke et al., 2003) New York City, NY, USA 8 56 13 10 13c (Ren et al., 2003) Birmingham, UK (summer) 8 7 6 25 54d (Emmerson et al., 2005) Birmingham, UK (winter) 1 15 0.5 59 26d
Chelmsford (near London), UK 6 10 14 20 50d (Emmerson et al., 2007) Mexico City, MEX – 2006 24 34 6 19 17c (Dusanter et al., 2009) Mexico City, MEX – 2003 19 12 19 12 38d This work
ano number; value assumed for normalization and comparison purposes; bonly selected carbonyls measured; lower limit number;
cestimated using RACM;
destimated using MCMv3.1 (mostly photolysis of OVOC);
eestimated using CIT air quality model (mostly photolysis of OVOC).
afternoon, the contribution from HONO to the overall radical production was low during MCMA-2003. Different results were obtained for HONO during the MILAGRO/MCMA-2006 field campaign, where in another part of town HONO was found to be tendentially higher, and much higher in episodes (Dusanter et al., 2009). During some episodes day-time HONO was significant, and during those episodes the contribution from daytime HONO can have a significant im-pact on the overall radical production (Li et al., 2010). How-ever, results from MCMA-2003 and MILAGRO/MCMA-2006 show consistently that daytime HONO is not a routine occurrence in the MCMA, and the cause and frequency at which daytime HONO episodes occur are currently not well established.
Recently, significant daytime HONO concentrations in ru-ral and forested environments indicate the presence of addi-tional daytime HONO sources that are up to 64 times greater than the night time sources, and comparable to other sources like HCHO and O3-photolysis (Zhou et al., 2002; Kleff-mann et al., 2005; Acker et al., 2006). The only labora-tory study that could thus far present convincing evidence
city. Between NYC and the MCMA, differences exist in the types of available surface areas, the availability of sunlight in street-canyons, the vertical mixing-height and horizontal dispersion of pollutants. A direct confirmation of the HONO levels in NYC remains desirable. It is further noteworthy that our study identifies that secondary OVOC contribute about equal to radical production than HONO already shortly after sunrise.
HCHO-photolysis
The contribution from this source is highly variable. Com-pared to other urban environments, it is lower in the MCMA than downwind of Milan, Berlin and Nashville, but higher than in NYC, Birmingham and downwind of London. HCHO is an important radical source in the MCMA. About 70% of the average daytime radical production rate from HCHO is attributed to HCHO that forms from secondary sources (hydrocarbon photochemistry) (Garcia et al., 2006; Lei et al., 2009).
HCHO is emitted in significant amounts as part of ve-hicle exhaust in the MCMA (Zavala et al., 2006; Garcia et al., 2006). Conversely, targeted reductions of primary HCHO sources present an opportunity to slow down the rate of hydrocarbon oxidation. While primary HCHO only ac-counts for about 30% of the average daytime radical produc-tion rate from HCHO-photolysis, the contribuproduc-tion peaks at around 09:00 a.m., when the net-radical production rate from other sources is either no longer (HONO), or not yet (O3) efficient. Primary HCHO sources contribute about 10% of the overall net-production of radicals before 10:00 a.m., and contribute significantly to the formation of those secondary species which sustain the exceptionally high6OHnewin the mid-morning. Reductions in primary HCHO sources can thus be expected to yield additional benefits from reducing the production rate of secondary species. Such amplification of benefits may however be out-weighed by parameters such as cycling chain length (Sheehy et al., 2010), which is highest in the early morning hours and decreasing towards the mid-morning, when primary HCHO contributes most to6OHnew. From a radical source perspective, the potential benefits of targeted primary HCHO reductions to reduce peak concen-trations of secondary species like O3 and SOA warrant fu-ture investigation. It is important that fufu-ture research on this subject includes the development of models that adequately represent radical sources other than HCHO.
O3-photolysis
The contribution from this source exceeds 30% only in semi-polluted and rural environments; it is generally below or close to 20% in more polluted environments, like Milan, NYC, and – interestingly – the MCMA. Despite frequent O3concentrations that exceed 100 ppbv in the MCMA, its 2220 m elevation above sea level, and tropical latitude, the
daily average contribution from O3photolysis is not higher than that observed in other polluted atmospheres. This re-flects efficient venting of the MCMA during afternoons (de Foy et al., 2006), and the abundance of other radical sources. The moderate contribution from O3 photolysis in the urban atmosphere also means that any correlation of OH radical concentrations withJO3 is rather a reflection of the fact that
85% of radical production is light-induced. Any such cor-relation should not be mistaken as evidence that O3indeed controls OH radical concentrations in the urban atmosphere.
O3/alkene reactions
A markedly different contribution from O3/alkene sources is observed compared to previous studies. Alkenes directly contribute to6OHnew by reacting with ozone. They con-tribute further indirectly to 6OHnew as the oxidation of alkenes by OH as the predominant source for photochem-ical HCHO in Mexico City (see Sect. 3.5); photochemphotochem-ical sources are also the predominant source of ambient HCHO during the day (Garcia et al., 2006). In addition, O3/alkene reactions essentially can explain most of the OH radical ob-servations at night (see Fig. 3 in Sheehy et al., 2010), lead-ing to the nighttime accumulation of secondary pollutants that produce radicals from secondary OVOC photolysis in the early morning hours. Further, the storage of nighttime OH-radicals in the form of PSS-HONO makes an important contribution to morning HONO levels. Photolysis of PSS-HONO, other OVOC and O3/alkene reactions in sum are re-sponsible for about 75% of the radical production rate one hour after sunrise. Notably, the three studies that employed a detailed chemical mechanism to study radical sources (Em-merson et al., 2005, 2007; this work) yield the highest esti-mates for the contribution from O3/alkene reactions; lumped chemical codes seem to give lower estimates of O3/alkene sources (see Table 2). O3/alkene reactions make an important radical source during winter in Birmingham (Emmerson et al., 2005). The combined radical production rate attributable to alkene reactions exceeds that from any other source in the early morning in Mexico City. Notably, in the MCMA, the sum of the direct and indirect contributions of O3/alkene re-actions to6OHnew (on average about 30%) is at least five times higher compared to the relative abundance of alkenes on a ppbC basis (i.e., 3–6% ppbC at CENICA; see Velasco et al., 2007).
Photolysis of secondary OVOC