ACPD
11, 16553–16584, 2011Photochemical production of ozone in Beijing during the 2008 Olympic Games
C. C.-K. Chou et al.
Title Page
Abstract Introduction
Conclusions References
Tables Figures
◭ ◮
◭ ◮
Back Close
Full Screen / Esc
Printer-friendly Version
Interactive Discussion
Discussion
P
a
per
|
Dis
cussion
P
a
per
|
Discussion
P
a
per
|
Discussio
n
P
a
per
|
Atmos. Chem. Phys. Discuss., 11, 16553–16584, 2011 www.atmos-chem-phys-discuss.net/11/16553/2011/ doi:10.5194/acpd-11-16553-2011
© Author(s) 2011. CC Attribution 3.0 License.
Atmospheric Chemistry and Physics Discussions
This discussion paper is/has been under review for the journal Atmospheric Chemistry and Physics (ACP). Please refer to the corresponding final paper in ACP if available.
Photochemical production of ozone in
Beijing during the 2008 Olympic Games
C. C.-K. Chou1, C.-Y. Tsai1, C.-C. Chang1, P.-H. Lin2, S. C. Liu1, and T. Zhu3
1
Research Center for Environmental Changes, Academia Sinica, Taipei 11529, Taiwan
2
Department of Atmospheric Sciences, National Taiwan University, Taipei 10617, Taiwan
3
College of Environmental Sciences and Engineering, Peking University, Beijing 100871, China
Received: 3 May 2011 – Accepted: 29 May 2011 – Published: 10 June 2011
Correspondence to: C. C.-K. Chou ([email protected])
Published by Copernicus Publications on behalf of the European Geosciences Union.
ACPD
11, 16553–16584, 2011Photochemical production of ozone in Beijing during the 2008 Olympic Games
C. C.-K. Chou et al.
Title Page
Abstract Introduction
Conclusions References
Tables Figures
◭ ◮
◭ ◮
Back Close
Full Screen / Esc
Printer-friendly Version
Interactive Discussion
Discussion
P
a
per
|
Dis
cussion
P
a
per
|
Discussion
P
a
per
|
Discussio
n
P
a
per
Abstract
As a part of the CAREBeijing-2008 campaign, observations of O3, oxides of nitrogen
(NOx and NOy), CO, and hydrocarbons (NMHCs) were carried out at the air quality
observatory of the Peking University in Beijing, China during August 2008, including the period of the 29th Summer Olympic Games. The measurements were compared
5
to those of the CAREBeijing-2006 campaign to evaluate the effectiveness of the air pol-lution control measures, which were conducted for improving the air quality in Beijing during the Olympics. The results indicate that significant reduction in the emissions of primary air pollutants had been achieved; the monthly averages of NOx, NOy, CO,
and NMHCs reduced by 42.2, 56.5, 27.8, and 49.7 %, respectively. In contrast to the
10
primary pollutants, the averaged mixing ratio of O3increased by 42.2 %. Nevertheless, it was revealed that the ambient levels of total oxidants (Ox=O3+NO2+1.5NOz) and
NOzreduced by 21.3 and 77.4 %, respectively. The contradictions between O3and Ox
were further examined in two case studies. Ozone production rates of 30–70 ppbv hr−1 and OPEx of∼8 mole mole−1were observed on a clear-sky day in spite of the reduced
15
levels of precursors. In that case, it was found that the concentrations of O3increased with the increasing NO2/NO ratio, whereas the NOz concentrations leveled offwhen
NO2/NO>8. Consequently, the ratio of O3 to NOz increased to above 10, indicating
the shift from VOC-sensitive regime to NOx-sensitive regime. However, in the other case, it was found that the O3 production was inhibited significantly due to substantial
20
reduction in the ambient levels of NMHCs. According to the observations, it was sug-gested that the O3/Ox production rates in Beijing should have been reduced for the
reduction in the emissions of precursors during the Olympic period; however, the night-time O3 levels were increased for decline in the NO-O3 titration, and the midday O3
peak levels were elevated for the shift in the photochemical regime and the inhibition
25
ACPD
11, 16553–16584, 2011Photochemical production of ozone in Beijing during the 2008 Olympic Games
C. C.-K. Chou et al.
Title Page
Abstract Introduction
Conclusions References
Tables Figures
◭ ◮
◭ ◮
Back Close
Full Screen / Esc
Printer-friendly Version
Interactive Discussion
Discussion
P
a
per
|
Dis
cussion
P
a
per
|
Discussion
P
a
per
|
Discussio
n
P
a
per
|
1 Introduction
Urbanization is undergoing worldwide, particularly in the developing countries. The in-tensive human activities in urban areas unavoidably result in substantial emissions of air pollutants. The anthropogenic compounds can react in the atmosphere and, con-sequently, lead to the formation and accumulation of secondary pollutants and cause
5
further deterioration of air quality. Exposure to the air pollutants has been identified as one of the major health risks of the residents in mega-cities (Molina et al., 2004).
Beijing is among the 15 megacities in the world. The economic development has brought up the number of vehicles, factories, as well as power plants in the Beijing metropolitan area during the last two decades. As a result, Beijing has suffered from
10
serious air pollution (Wang et al., 2006; An et al., 2007). Being the host city of the 29th Summer Olympic Games, the Beijing government setup rather aggressive action plans to reduce the emissions of air pollutants in Beijing and its surrounding areas dur-ing the Olympic period. In particular, the traffics were restricted temporarily to reduce the vehicular exhausts within the Beijing City (Wang et al., 2009b). Emission
inven-15
tory studies indicated that the traffic emissions of volatile organic compounds (VOCs), carbon monoxide (CO), nitrogen oxides (NOx), and particulate matters (PM10) were
re-duced by∼50 % from their respective normal levels in Beijing (Zhou et al., 2010; Wang et al., 2010c). The estimates of NOx reduction are consistent with previous reports based on satellite observations, which indicated a reduction of∼40–60 % in the
col-20
umn density of NO2over Beijing during the Olympic Games (Mijling et al., 2009; Witte
et al., 2009). Besides, the reductions in the vehicular emissions of the other air pol-lutants have also been validated by a series of ground-based observations (Liu et al., 2009; Wang et al., 2009a,b, 2010a,b). Evidently, the air pollution control measures had successfully reduced the ambient levels of the primary air pollutants in Beijing during
25
the Olympic Games.
In contrast to the substantial reduction of the primary air pollutants, the mitigation of ozone (O3) in Beijing during the Olympic period was not as expected. Observations at
ACPD
11, 16553–16584, 2011Photochemical production of ozone in Beijing during the 2008 Olympic Games
C. C.-K. Chou et al.
Title Page
Abstract Introduction
Conclusions References
Tables Figures
◭ ◮
◭ ◮
Back Close
Full Screen / Esc
Printer-friendly Version
Interactive Discussion
Discussion
P
a
per
|
Dis
cussion
P
a
per
|
Discussion
P
a
per
|
Discussio
n
P
a
per
a rural site showed that the monthly averaged mixing ratio of O3 for August 2008 was reduced by∼20 %, compared to the same month of 2006–2007 (Wang et al., 2009a). However, comparing the observations in Beijing downtown for periods before and after the traffic control indicated an increase of 16 % in the mixing ratio of O3 (Wang et al., 2010b). The increases in the O3mixing ratio were not consistent with the decreases in
5
the emissions of precursors, i.e. NOx and VOCs. In particular, the ozone formation
po-tentials (OFPs) of the non-methane hydrocarbons (NMHCs) had been reduced by 48 % (Wang et al., 2010a). Wang and Xie (2009) attributed the inconsistency to the reduced NO-O3titration for the reduction in NOxemissions. Wang et al. (2009a) suggested that
the high O3 episodes in Beijing during August 2008 were mostly meteorology-driven.
10
Wang et al. (2010b) argued that the transport of photochemical plumes from the sur-rounding areas to Beijing was the major contributor of the “peaks” of O3 in Beijing
downtown. To date, the high O3 levels in Beijing during the Olympics are still an open
issue.
The “Campaign for Air Quality Research in Beijing and Surrounding Region – 2008”
15
(CAREBeijing-2008) is an intensive experiment for investigating the air quality in Beijing during the Olympic period and evaluating the effectiveness of the air pollution control measures. Furthermore, given that the O3-precursors relationship was established
mostly on theories and/or chamber studies. The air quality control program for the Bei-jing Olympics provided a unique opportunity to examine the response of ambient O3
20
level to a drastic reduction in the emissions of precursors. In this study, the measure-ments of O3 and its precursors carried out at the observatory on the campus of the
Peking University are presented. The measurements are compared with those con-ducted in the summer of 2006, i.e. CAREBeijing-2006, to show the air quality effects due to the control measures. Moreover, the data are analyzed in terms of
photochem-25
ACPD
11, 16553–16584, 2011Photochemical production of ozone in Beijing during the 2008 Olympic Games
C. C.-K. Chou et al.
Title Page
Abstract Introduction
Conclusions References
Tables Figures
◭ ◮
◭ ◮
Back Close
Full Screen / Esc
Printer-friendly Version
Interactive Discussion
Discussion
P
a
per
|
Dis
cussion
P
a
per
|
Discussion
P
a
per
|
Discussio
n
P
a
per
|
2 Experimental methods
To investigate the air quality and atmospheric chemistry of Beijing, an intensive obser-vatory was setup on the campus of the Peking University (PKU) during the CareBeijing-2008. The detailed geographic characteristics of this site have been presented in other papers of this special issue (e.g., Wang et al., 2010a) and, therefore, are not described
5
here. A comprehensive set of instrument was installed at the PKU station to measure the concentrations of major air pollutants, with emphases upon ozone and aerosols. However, only the instruments relevant directly to this study will be outlined in the fol-lowings.
The measurements of nitric oxide (NO), nitrogen dioxide (NO2), and total reactive
10
nitrogen (NOy) were carried out concurrently with a time resolution of 1 min. NO was
measured using a chemiluminescence detector (Model 42C-TL, Thermo Scientific). NO2was measured with a system consisting of a chemiluminescence detector (Model CLD 88p, ECO Physics) and a photolytic converter (Model PLC 860, ECO Physics). The efficiency of the converter kept at ∼66 % throughout the campaign, which was
15
determined with gas titration method. A NOyconverter (ECO Physics) was employed to reduce the NOy species to NO with CO on the surface of a gold tube at 300◦C.
Then, the second CLD 88p detector was used for quantification of NOy. The efficiency
of this converter was∼100 %, which was checked by HNO3measurement in laboratory
before the field experiment and is consistent with the literatures (e.g., Fehsenfeld et al.,
20
1987). Daily calibration of the chemiluminescence detectors was accomplished using 0.5–200 ppbv NO, which was generated by dilution of 10 ppmv standard NO (Scott Specialty Gases, USA) with NO-free air from an in-situ zero-gas generator (Model PAG003, ECO Physics). The detection limits of the instruments were estimated by 3 times the standard deviation of the signals of zero-air measurements, which were 0.3,
25
0.1, and 0.3 ppbv for NO, NO2, and NOy, respectively.
For in-situ measurement of hydrocarbons (65 species, as listed in Table 1), am-bient air was analyzed by an automated GC/MS/FID (Varian CP-3800 and Saturn
ACPD
11, 16553–16584, 2011Photochemical production of ozone in Beijing during the 2008 Olympic Games
C. C.-K. Chou et al.
Title Page
Abstract Introduction
Conclusions References
Tables Figures
◭ ◮
◭ ◮
Back Close
Full Screen / Esc
Printer-friendly Version
Interactive Discussion
Discussion
P
a
per
|
Dis
cussion
P
a
per
|
Discussion
P
a
per
|
Discussio
n
P
a
per
2200 MS) system using dual-columns and dual-detectors to simultaneously analyze both low- and high-boiling point non-methane hydrocarbons (NMHCs). This system is an upgrade of the one as described by Chang et al. (2003). A built-in cryo-trap packed with fine glass beads was cooled with liquid nitrogen to −170◦C. Air sample was drawn from the sample inlet through the cryo-trap at a rate of 12 ml min−1 for
5
20 min, which gave an aliquot of 240 ml air sample. Desorption was made by flash heating the trap to 85◦C, and a stream of ultra-high purity helium (99.9999 %) was used to flush the trapped hydrocarbons to the columns. A glass Y-splitter was used to divide the flow into two streams for the following two columns, i.e. a PLOT column (Chrompack; 30 m×0.32 mm; df=5.0 µm) connected to FID for separation and
de-10
tection of C2-C4 compounds, and a DB-1 column (J&W; 60 m×0.32 mm; df=1.0 µm) connected to MS for the separation and detection of C5–C11 compounds. The GC oven starts at−15◦C for 1.5 min, ramps to 0◦C at 10◦C,min−1, to 140◦C at 5◦C min−1, to 180◦C at 20◦C min−1
, and ends at 180◦C for 9.5 min.
In addition to the NO/NO2/NOy and NMHCs instruments for this intensive
experi-15
ment, the PKU observatory was equipped with a general air quality station. All the instruments were calibrated regularly at the mid-night of each day during the cam-paign. The data of CO and O3from the station will be included in the following analysis
and discussion. Besides, the total short-wave irradiance, SWI, (0.3–3.0 µm) was mea-sured using an Eppley precision spectral pyranometers (PSP). The PSP sampled data
20
per second and were subsequently averaged to 1-min resolution.
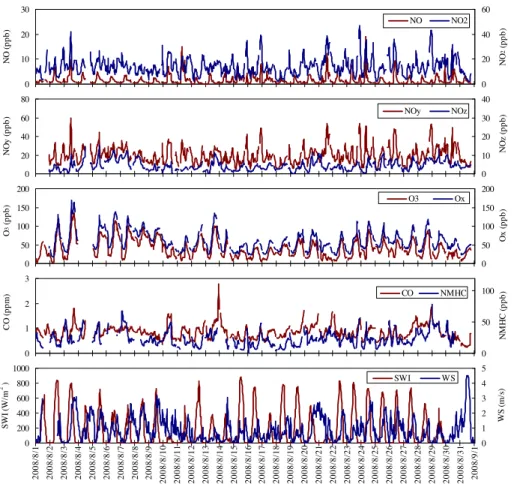
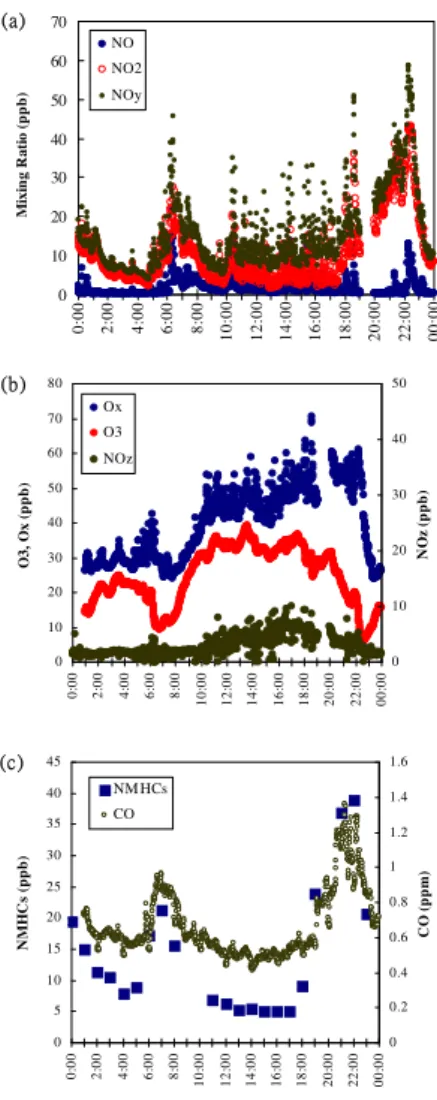
3 Results and discussion 3.1 Overview of the time series
Figure 1 illustrates the time series of the hourly averaged concentrations of the respec-tive species (NO, NO2, NOy, NOz, O3, Ox, CO, and NMHCs) measured at the PKU
25
ACPD
11, 16553–16584, 2011Photochemical production of ozone in Beijing during the 2008 Olympic Games
C. C.-K. Chou et al.
Title Page
Abstract Introduction
Conclusions References
Tables Figures
◭ ◮
◭ ◮
Back Close
Full Screen / Esc
Printer-friendly Version
Interactive Discussion
Discussion
P
a
per
|
Dis
cussion
P
a
per
|
Discussion
P
a
per
|
Discussio
n
P
a
per
|
NOx(NOy-NOx), which are the oxidation products of NOx. Note that the “total oxidant” (Ox) is defined following Levy et al. (1985),
Ox=O3+O(3P)+O(1D)+0.5 OH+0.5 HO2+H2O2+NO2+2 NO3+3 N2O5
+1.5 HNO3. (1)
Given that the mixing ratios of radicals, oxygen atoms, H2O2and N2O5are rather low
5
in the atmosphere, the right hand side of Eq. (1) is dominated by O3, NO2, and HNO3. Further, because HNO3 is usually the predominant component of NOz in an urban
area, the concentration of Oxwas estimated by [O3+NO2+1.5NOz] in this study.
In the first week of August 2008, just before the Olympic Games, Beijing experienced an episode of high O3/Ox. The hourly [O3] and [Ox] reached their respective maxima,
10
135 and 169 ppbv, at 12:00 (local time=GMT+08:00) on 3 August. The maximal levels of NOx, NOy, and NMHCs were observed at 11:00, i.e. 1 h prior to the peaks of O3and Ox. Note that there was another O3/Ox peak occurred at 17:00 on 3 August, implying
the coupling influences of transport and in-situ photochemical production of ozone. This case will be analyzed and discussed in more details later on. The mixing ratio of
15
O3declined gradually since 6 August and remained below 100 ppbv, in spite of the daily
NOx/NOy spikes, during the Olympic Games. Apparently, the emission of NOxdid not
contribute efficiently to the formation of O3in Beijing during the Olympics. The reduced photochemical activity was also indicated by the absence of NOz peaks, as shown
in the NOz time series. The mitigation of O3/Ox during the Beijing Olympic Games
20
has been attributed to the weather conditions and/or the reduction in the emissions of precursors (Wang, et al., 2009a, 2010b). However, it was revealed from the time series that the production of O3 was not enhanced significantly on some days (e.g., 15–16
August) with strong solar flux and substantial precursors. Thus the mechanisms for the observed reduction in Ox need to be studied furthermore.
25
ACPD
11, 16553–16584, 2011Photochemical production of ozone in Beijing during the 2008 Olympic Games
C. C.-K. Chou et al.
Title Page
Abstract Introduction
Conclusions References
Tables Figures
◭ ◮
◭ ◮
Back Close
Full Screen / Esc
Printer-friendly Version
Interactive Discussion
Discussion
P
a
per
|
Dis
cussion
P
a
per
|
Discussion
P
a
per
|
Discussio
n
P
a
per
3.2 Effectiveness of the emission control measures
To examine the effectiveness of the emission control measures upon the air quality in Beijing, the ambient levels of nitrogen oxides, O3, Ox, NMHCs, and CO measured in
this study were compared to the measurements made during the CAREBeijing-2006 campaign, i.e. 12 August–9 September 2006 (Chou et al., 2009). Table 2 tabulates
5
the averages of the measurements for August 2008 and CAREBeijing-2006, respec-tively, and the differences are interpreted as the effectiveness of the emission con-trol measures. In general, according to the observations, the reduction in the levels of primary pollutants was very significant; NOx, NOy, NMHCs, and CO mixing ratios
were reduced by 42.2, 56.5, 49.7, and 27.8 %, respectively. This is consistent with
10
the results of previous modeling as well as observation studies (e.g., Wang et al., 2009b, 2010a,b,c). However, the averaged level of O3increased from 28.2±27.2 ppbv
to 40.1±25.1 ppbv, or by 42 %. Meanwhile, the sum of O3 and NO2 mixing ratios
increased from 48.2±24.5 ppbv to 53.9±25.0 ppbv (11.8 %), which means reduced titration effect between O3 and NO for the reduction in NOx emission can explain only
15
partly the increases in ambient O3. It is underlined that the averaged level of Ox de-creased from 76.6±28.7 ppbv to 60.3±26.9 ppbv, which is equivalent to a reduction of 21 %. Among the components of Ox, the mixing ratios of NOz decreased most
signif-icantly. The campaign average of NOz concentration decreased from 19.0±6.3 ppbv to 4.3±2.7 ppbv, i.e. 77.4 %. The major cause of the drastic decreases in NOzis most
20
likely the reduction in NOx emissions. Nevertheless, it could also be a result of
en-hanced wet deposition in the August 2008. It is worth noting that the present study is the first report showing the consistency between the levels of Ox and it precursors
and indicating the changes in the composition of oxidant in Beijing during the 2008 Olympics.
25
ACPD
11, 16553–16584, 2011Photochemical production of ozone in Beijing during the 2008 Olympic Games
C. C.-K. Chou et al.
Title Page
Abstract Introduction
Conclusions References
Tables Figures
◭ ◮
◭ ◮
Back Close
Full Screen / Esc
Printer-friendly Version
Interactive Discussion
Discussion
P
a
per
|
Dis
cussion
P
a
per
|
Discussion
P
a
per
|
Discussio
n
P
a
per
|
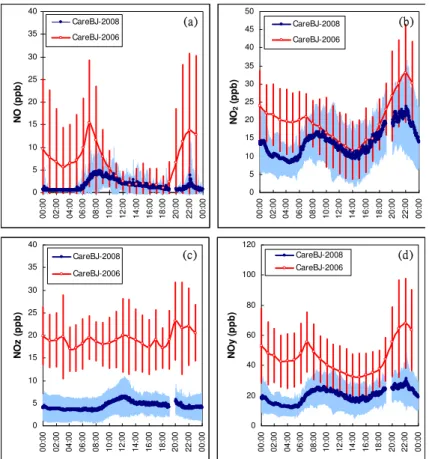
respectively, for the CAREBeijing-2006 and CAREBeijing-2008. The most striking fea-tures are that the reduction in NO and NO2 occurred in the morning and evening but
not as significantly during the midday, whereas the reduction in NOzpersisted
through-out the whole day. Chou et al. (2009) indicated the conversion of freshly emitted NOx to NOzin the morning during CAREBeijing-2006. In this context, the diminution of the
5
morning rush-hour emissions of NOxcould contribute most directly to the reduction of
NOz. This hypothesis has been validated with the observations of this study. However, the persisted levels of NO and NO2during midday were not agreeing with the emission
control measures. Figure 2e,f displays the diurnal variations of the other two major primary pollutants, CO and NMHCs. In contrast to NOx, the mitigation of air pollution
10
was quite evident in the figures. Indeed, the reduction in traffics and relevant pollutants’ emissions has been validated by on-road measurements (Wang et al., 2009b). Thus the persisted levels of NO and NO2 during midday is inferred to be a result of
pho-tochemical dynamics. This inference will be examined in the following case studies. Figure 2g,h depicts the diurnal patterns for O3 and Ox, respectively. The mixing ratio
15
of O3 was higher during the 2008 campaign, whereas Ox was higher in 2006. The
differences in O3were much larger in nighttime than in daytime, indicating the changes in the NO-O3 titration due to emission reduction. The mixing ratios and the increasing
rate of O3from morning to noontime are comparable in the two campaigns; meanwhile
the Oxof 2008 campaign kept slightly lower than in the 2006 campaign. However, the
20
mixing ratio of O3kept increasing in the early afternoon of 2008 and resulted in
signif-icantly higher daily maximum than in 2006, disagreeing with the behavior of Ox. The
inconsistency between O3and Oximplies that the increasing O3in early afternoon was not only caused by enhancement in O3production, but also likely a result of changes
in the partition among the components of Ox.
25
3.3 Ozone production efficiency of NOx: case studies
Despite of the prolonged rainy events in Beijing during August 2008, there were still some days of clear skies in-between the rains (as shown in Fig. 1), which allow in-depth
ACPD
11, 16553–16584, 2011Photochemical production of ozone in Beijing during the 2008 Olympic Games
C. C.-K. Chou et al.
Title Page
Abstract Introduction
Conclusions References
Tables Figures
◭ ◮
◭ ◮
Back Close
Full Screen / Esc
Printer-friendly Version
Interactive Discussion
Discussion
P
a
per
|
Dis
cussion
P
a
per
|
Discussion
P
a
per
|
Discussio
n
P
a
per
analysis upon the photochemical reactions. Two distinct cases will be presented in the followings. The case of 3 August is a high O3 episode, whereas the O3 mixing ratio was leveling offat 30–40 ppbv in the daytime of 15 August.
3.3.1 Case 1: 3 August 2008
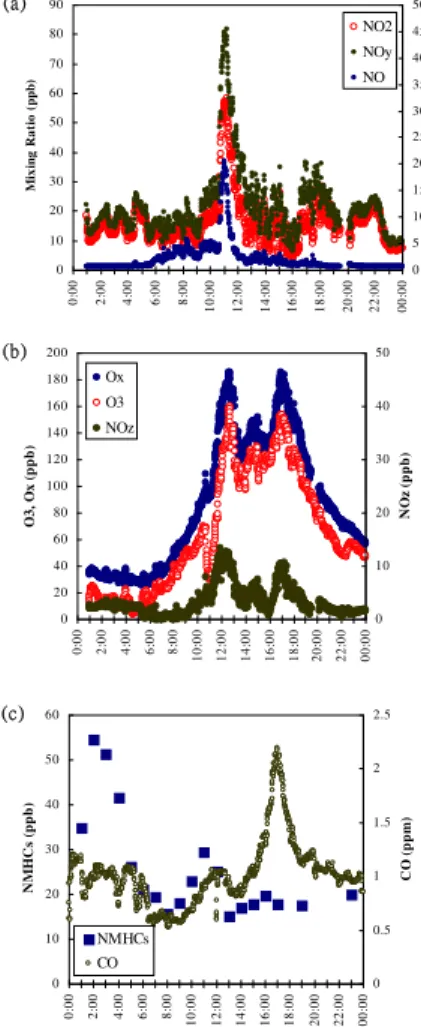
Figure 3a–e illustrates the mixing ratios of trace gases and the meteorological
param-5
eters measured at the PKU observatory on 3 August 2008. As indicated by the solar flux, it was a rather clear day. Advection of air mass was inhibited until the nocturnal boundary layer got broken in the morning and, then, southerly flows were prevailing throughout the day. The common NOx/NOy peaks for morning rush hours in an urban area were diminished significantly, as comparing to the measurements of
CAREBeijing-10
2006 (Chou et al., 2009). Nevertheless, the freshly emitted NO was still noticeable. The mixing ratios of O3, Ox, and NOz increased drastically from ∼09:00 to ∼12:00. Note the spikes of NO/NO2/NOypeaking at∼11:00, which resulted in the titration dip in O3.
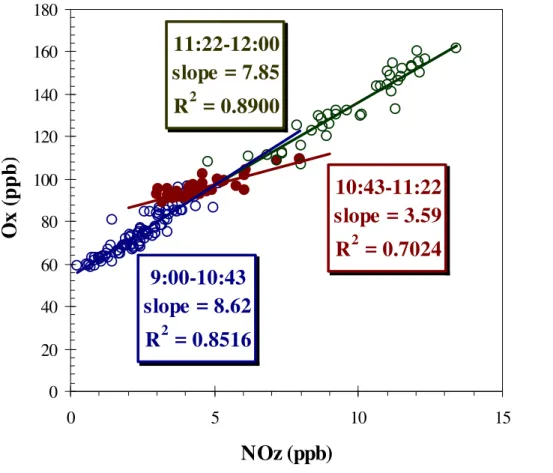
The causes of the event are not clear yet, but most likely due to some local activities. Figure 4 analyzes the data in terms of ozone production efficiency of NOx (OPEx) to
15
examine the perturbation of the NOx spike upon the O3 production. It was revealed
that the OPEx decreased from 8.6 before the NOxspike to 3.6 during the episode and,
in turn, bound up to 7.9 mole mole−1 after the event. Obviously, the NOx injected into
the atmosphere was converted to NOz efficiently during the episode. The enhanced NOx-NOzconversion should have increased the consumption of radicals and, thereby,
20
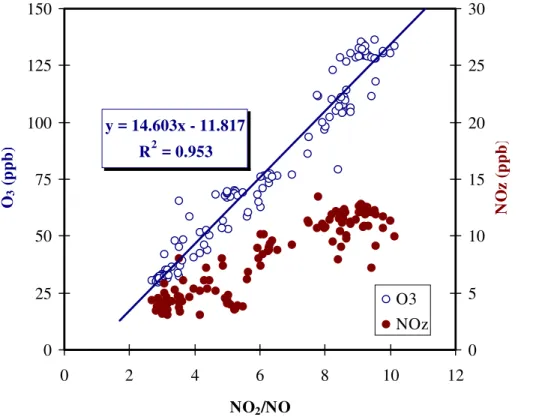
retarded the ozone production. Figure 5 shows that the 1-min mixing ratios of O3
(10:30–12:30) correlate linearly with the corresponding ratio of NO2to NO, being con-sistent with the photo-stationary state relation. This consistency allows approximation of the ozone production rate (PO3) following the photo-stationary state equation (Frost
et al., 1998),
25
ACPD
11, 16553–16584, 2011Photochemical production of ozone in Beijing during the 2008 Olympic Games
C. C.-K. Chou et al.
Title Page
Abstract Introduction
Conclusions References
Tables Figures
◭ ◮
◭ ◮
Back Close
Full Screen / Esc
Printer-friendly Version
Interactive Discussion
Discussion
P
a
per
|
Dis
cussion
P
a
per
|
Discussion
P
a
per
|
Discussio
n
P
a
per
|
Without direct measurement of the photolysis rates of NO2, jNO2, the values of jNO2
were estimated being 0.008 s−1
for noontime (11:30–12:30) and 0.007 s−1
for late morning (10:30–11:30). The rate constantkNOO3was calculated following Demore et al.
(1997),
kO3−NO=2.0×10⁻¹²exp
−1400
T
. (3)
5
The calculation indicated that the 5-min averaged PO3 was 30.7±9.2 ppb hr− 1
for 10:31–10:35, and increased to 75.8±20.1 ppb hr−1 at noon time (12:26–12:30). The values ofPO3 are significantly higher than those observed in the US urban areas by
a factor of 3–7 (Kleinman et al., 2002), and are comparable with recent observation in the Mexico City (Wood et al., 2009). Note that the range ofPO3 is comparable with
10
that observed in Beijing during the summer of 2006 (Lu et al., 2010). Such a high
PO3 explains, at least partly, the high ozone levels observed in August 2008. The
cor-relation between the NOz concentration and the ratio of NO2 to NO is also shown in
Fig. 5. Along with the photochemical evolution of the air mass, it was revealed that the ambient level of NOz increased with NO2/NO ratio until NO2/NO>8, whereas the
15
mixing ratio of O3 kept increasing. Consequently, the ratio of O3 to NOz increased to
be above 10, indicating that the O3 production shifted from VOC-sensitive regime to NOx-sensitive regime (Sillman, 1995). Moreover, the leveling-offof NOz suggests that
the consumption of NOxwas getting limited. As a result, the fraction of NOxin NOywas
significantly higher than that observed in CAREBeijing-2006 (Chou et al., 2009). Thus,
20
in spite of the substantial reduction in NOx emissions in Beijing during the Olympic
period, particularly during the morning rush hours, the ambient levels of NO and NO2
were not reduced as well during the midday.
As shown in Fig. 3b, there was a second Ox peak occurred in the late afternoon
of 3 August. As a result, the daily maximum 8-h mean of O3 reached 119.2 ppbv
25
for the period from 12:00–20:00 LST. The mixing ratios of NOy and NOz increased
ACPD
11, 16553–16584, 2011Photochemical production of ozone in Beijing during the 2008 Olympic Games
C. C.-K. Chou et al.
Title Page
Abstract Introduction
Conclusions References
Tables Figures
◭ ◮
◭ ◮
Back Close
Full Screen / Esc
Printer-friendly Version
Interactive Discussion
Discussion
P
a
per
|
Dis
cussion
P
a
per
|
Discussion
P
a
per
|
Discussio
n
P
a
per
a strong CO peak but without significant changes in the NMHCs. The declined solar flux at that time excluded the possibility of strong in-situ photochemical production of O3. Thus, the most probable cause of the late afternoon episode is transport of
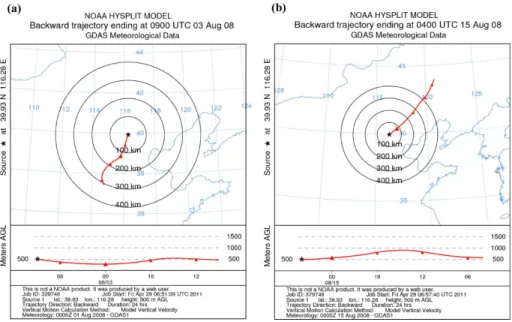
aged air mass from surrounding urban areas, where the emissions of CO were not controlled as did in Beijing. Figure 6 illustrates the 24-h backward trajectory of the
5
surface air mass arriving in Beijing at 17:00, which suggests that the photochemically-aged plume was associated with moderate southwesterly flows (∼300 km day−1). The influences of the southerly transported polluted air mass on the air quality in Beijing have been discussed in previous studies (e.g., An et al., 2007; Wang et al., 2010b). The point underlined in this case study is that the coupling of in-situ photochemical ozone
10
production during midday and the transport of ozone plumes in the late afternoon could further impact the air quality, particularly in terms of the “8-h-mean” O3guideline (WHO,
2006).
3.3.2 Case 2: 15 August 2008
Figure 7a–e shows the measurements of trace gases and meteorological parameters
15
on 15 August 2008. Note that the northerly winds were prevailing and, as a result, the transport of polluted air mass from the southern North China Plains to Beijing was prevented. Despite of the rains in early morning, the skies were very clear during the daytime. However, in contrast to the previous case, the mixing ratio of O3 was
kept at 30–40 ppbv during the daytime. The observed O3 leveling-off suggests that
20
the production and loss rates of ozone were comparable with each other. The major sinks of O3in the boundary layer include dry deposition and photolysis. With general
conditions in urban areas, it was estimated that the maximum loss rate of O3could be
around 10 ppb hr−1 only (Wood et al., 2009; Lu et al., 2010). Given the strong solar flux and substantial emissions of NOx, photolysis of NO2 and production of OH are
25
ACPD
11, 16553–16584, 2011Photochemical production of ozone in Beijing during the 2008 Olympic Games
C. C.-K. Chou et al.
Title Page
Abstract Introduction
Conclusions References
Tables Figures
◭ ◮
◭ ◮
Back Close
Full Screen / Esc
Printer-friendly Version
Interactive Discussion
Discussion
P
a
per
|
Dis
cussion
P
a
per
|
Discussion
P
a
per
|
Discussio
n
P
a
per
|
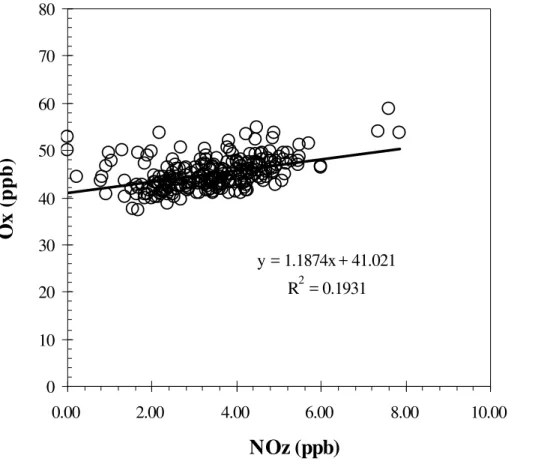
On 15 August, the mixing ratio of NOz was increasing from∼0 to∼10 ppbv during the daytime (as shown in Fig. 7b), implying that a substantial amount of OH radicals was consumed by reacting with NO2. Figure 8 illustrates the correlation between NOz
and Oxand gives an averaged OPEx of 1.2 mole mole− 1
for 10:00–14:00. Such a low OPEx suggests that the photochemical chain length of NOx was very short and NOx
5
was the major terminator of radicals. Given that the reaction between NO2 and OH is
the primary sink of NOx in the boundary layer, it was inferred from the low OPEx that
the O3 production was retarded by the consumption of OH for NO2 oxidation. How-ever, the high-end estimates of the consumption rates of OH due to reacting with NO2 were around 3 ppb hr−
1
, which were calculated based on observed NO2
con-10
centrations, using kNO2OH = 9×10− 12
cm3s−1 (Donahue et al., 1997) and assuming [OH]=1×107cm−3. That is evidently not enough to explain the O3 leveling-off.
Fig-ure 7c shows that the mixing ratio of NMHCs was only 6.1 ppbv for the major pho-tochemical time slot, i.e. 11:00–13:00, on 15 August. Comparing to 23.2 ppbv on 3 August, the concentration of NMHCs was reduced by 74 %. Meanwhile, the total
OH-15
reactivity of CO and the measured NMHCs decreased from 9.3 to 4.8 s−1, or by∼50 %. The reduction in OH-reactivity of NMHCs will certainly inhibit the production of organic peroxy radicals (RO2). Considering the recycling of OH through the reactions of per-oxy radicals and NO (Hofzumahaus et al., 2009), the effects of the reduction in the OH-reactivity of NMHCs upon the O3 production could have been amplified to a
cer-20
tain degree in this case.
3.3.3 Implications of the case studies
The two distinct cases discussed above demonstrate the responses of ozone produc-tion to the changes in the precursor levels, and provide important clues for further studies on the control strategy of urban ozone pollution. In the first case (3 August),
25
the ozone production was found being shifting from VOC-sensitive regime in late morn-ing to NOx-sensitive regime in early afternoon. Thus, the ozone production was first
ACPD
11, 16553–16584, 2011Photochemical production of ozone in Beijing during the 2008 Olympic Games
C. C.-K. Chou et al.
Title Page
Abstract Introduction
Conclusions References
Tables Figures
◭ ◮
◭ ◮
Back Close
Full Screen / Esc
Printer-friendly Version
Interactive Discussion
Discussion
P
a
per
|
Dis
cussion
P
a
per
|
Discussion
P
a
per
|
Discussio
n
P
a
per
fueled by the substantial emissions of VOCs and, then, that shift could have inhibited the consumption of NOx and allowed the further increases of the O3 mixing ratio in
the early afternoon. Such a scenario could be responsible, at least partly, for the for-mation of high ozone episodes in Beijing, and should be considered and analyzed in more details in further modeling work. On the contrary, in case without the shift in the
5
photochemical regime (i.e., 15 August), the photochemical production of O3 declined
substantially for the reduced OH-reactivity of VOCs during the midday. This also ex-plains the extremely low OPEx observed in Beijing on 15 August 2008. In this context, reduction in the emissions of VOCs should be most helpful to the mitigation of ozone pollution in Beijing.
10
4 Conclusions
During August 2008, including the period of the 29th Summer Olympic Games, an intensive atmospheric chemistry experiment was conducted at the air quality observa-tory of the Peking University in Beijing, China. The measurements were compared with the results of the CAREBeijing-2006, which was carried out in the summer of 2006, to
15
infer the emission reduction in the Olympic month. Moreover, the measurements of the oxides of nitrogen were analyzed and discussed in details with implications for the photochemical ozone production in Beijing.
The monthly means of NO, NO2, NOx, NOy, and NOz for August 2008 are 1.6± 1.9, 13.7±7.2, 15.2±8.2, 19.7±9.0, and 4.3±2.7 ppbv, respectively. Comapring to
20
the measurements made in the summer of 2006, the overall reductions in NOx/NOy
are 42.2/56.5 %. Besides, the observations showed that the ambient levels of CO and NMHCs reduced by 27.8 % and 49.7 %, respectively, agreeing with the reduction in NOx and NOy. Thus, in line with previous modeling and observation studies, it
was concluded that the emissions of primary air pollutants in Beijing were controlled
25
ACPD
11, 16553–16584, 2011Photochemical production of ozone in Beijing during the 2008 Olympic Games
C. C.-K. Chou et al.
Title Page
Abstract Introduction
Conclusions References
Tables Figures
◭ ◮
◭ ◮
Back Close
Full Screen / Esc
Printer-friendly Version
Interactive Discussion
Discussion
P
a
per
|
Dis
cussion
P
a
per
|
Discussion
P
a
per
|
Discussio
n
P
a
per
|
40.1±25.1 ppbv for August 2008, which equals to an increase of 42.2 %. The sum of O3
and NO2increased by 11.8 %, which means the reduced NO-O3titration cannot explain
the contradictions between O3and its precursors well. Nevertheless, the levels of total
oxidants (Ox=O3+NO2+1.5NOz) indeed reduced by 21.3 %, as the mixing ratio of NOz decreased by 77.4 %. There are two major implications of this finding. First,
5
the production of O3 and Ox should have been mitigated for the air pollution control
measures that reduced the emissions of O3 precursors substantially. The observed increases in O3 were resulted by the reduced NO-O3 titration and the declined NOz
production. In addition, correctly defining the Ox by inclusion of NOz is critical to the
analysis of O3/Oxchemistry in an urban area with intensive NOxemissions like Beijing.
10
The photochemical responses of O3/Ox to the reduction of the precursors were ex-amined in two case studies with clear skies. On 3 August, 2008, the hourly aver-ages of O3and Oxreached their respective maxima, 135 and 169 ppbv, at 12:00 (local
time=GMT+08:00). An ozone production rate of 75.8 ppbv hr−1 was estimated for the midday, implying that the precursors were still enough to sustain the O3
forma-15
tion although the emissions were reduced significantly. During the course of O3/Ox production and accumulation, there was an episode with spiky increases in the mix-ing ratios of CO, NMHCs, NOx as well as NOy. The observed OPEx were 8.6 and
7.9 mole mole−1before and after the spiky event, and dropped down to 3.6 mole mole−1 during the episode. The declined OPEx for increases in NOxmixing ratio suggests that
20
the NOx-NOz conversion was enhanced and the photochemical condition was shifted toward VOC-sensitive regime. However, after the event, it was found that the concen-trations of O3increased with the increasing NO2/NO ratio, whereas the NOz
concen-trations leveled offwhen NO2/NO>8. Consequently, the ratio of O3to NOzincreased to above 10, indicating the shift from VOC-sensitive regime to NOx-sensitive regime.
25
As far as our knowledge, this is the first observation showing such a back-and-forth shift of the photochemical regime of O3 production and necessitates further studies with sophisticated models. In contrast to the case of 3 August, the mixing ratios of O3 remained around 30–40 ppbv on 15 August in spite of the strong solar flux and
ACPD
11, 16553–16584, 2011Photochemical production of ozone in Beijing during the 2008 Olympic Games
C. C.-K. Chou et al.
Title Page
Abstract Introduction
Conclusions References
Tables Figures
◭ ◮
◭ ◮
Back Close
Full Screen / Esc
Printer-friendly Version
Interactive Discussion
Discussion
P
a
per
|
Dis
cussion
P
a
per
|
Discussion
P
a
per
|
Discussio
n
P
a
per
substantial emissions of NOx. An averaged OPEx of 1.2 mole mole− 1
was observed for 10:00–14:00, suggesting that the OH radicals were consumed very efficiently for the oxidation of NOx. Besides the loss of OH radicals, it was inferred that the O3production was inhibited by the extremely low level of NMHCs. The midday (11:00–13:00) mixing ratio of NMHCs was 6.1 ppbv on 15 August, comparing to 23.2 ppbv on 3 August. Thus,
5
the formation of RO2and, in turn, the recycling of OH should have been retarded. Ac-cording to the results from the case studies, it was concluded that the O3production in
Beijing should have been mitigated significantly for the reduction in NMHCs emissions in August 2008, being consistent with the results of the time series analysis.
Acknowledgement. The authors are grateful for the logistic support from the Peking Univer-10
sity during the campaign period. The authors also gratefully acknowledge the NOAA Air Re-sources Laboratory (ARL) for the provision of the HYSPLIT transport and dispersion model and/or READY website (http://www.arl.noaa.gov/ready.html) used in this publication. This work was supported by the CAREBeijing 2008 (Campaign of Atmospheric Researches in Beijing and surrounding areas in 2008) research program, and was funded by the Academia Sinica and the 15
National Science Council of Taiwan.
References
An, X., Zhu, T., Wang, Z., Li, C., and Wang, Y.: A modeling analysis of a heavy air pollution episode occurred in Beijing, Atmos. Chem. Phys., 7, 3103–3114, doi:10.5194/acp-7-3103-2007, 2007.
20
Chang, C. C., Lo, S. J., Lo, J. G., and Wang, J. L.: Analysis of methyl tert-butyl ether (MTBE) in the atmosphere and implications as an exclusive indicator of automobile exhaust, Atmos. Environ., 37, 4747–4755, 2003.
Chou, C. C. K., Tsai, C. Y., Shiu, C. J., Liu, S. C., and Zhu, T.: Measurement of NOy during Campaign of Air Quality Research in Beijing 2006 (CAREBeijing-2006): implica-25
tions for the ozone production efficiency of NOx, J. Geophys. Res.-Atmos., 114, D00G01, doi:10.1029/2008JD010446, 2009.
ACPD
11, 16553–16584, 2011Photochemical production of ozone in Beijing during the 2008 Olympic Games
C. C.-K. Chou et al.
Title Page
Abstract Introduction
Conclusions References
Tables Figures
◭ ◮
◭ ◮
Back Close
Full Screen / Esc
Printer-friendly Version
Interactive Discussion
Discussion
P
a
per
|
Dis
cussion
P
a
per
|
Discussion
P
a
per
|
Discussio
n
P
a
per
|
Ravishankara, A. R., Kolb, C. E., and Molina, M. J.: Chemical kinetics and photochemical data for use in stratospheric modeling, Jet Propul. Lab., Pasadena, CA, 1997.
Donahue, N. M., Dubey, M. K., Mohrschladt, R., Kenneth, L. D., and Anderson, J. G.: High-pressure flow study of the reactions OH+NOx→HONOx, J. Geophys. Res., 102, 6159– 6168, 1997.
5
Fehsenfeld, F. C., Dickerson, R. R., Hubler, G., Luke, W. T., Nunnermacker, L. J., Williams, E. J., Robberts, J. M., Calvert, J. G., Curran, C. M., Delany, A. C., Eubank, C. S., Fahey, D. W., Fried, A., Gandrud, B. W., Langford, A. O., Murphy, P. C., Norton, R. B., Pickering, K. E., and Ridley, B. A.: A ground-based intercomparison of NO, NOx, and NOy measurement techniques, J. Geophys. Res., 92, 14710–14722, 1987.
10
Frost, G. J., Trainer, M., Allwine, G., Buhr, M. P., Calvert, J. G., Cantrell, C. A., Fehsen-feld, F. C., Goldan, P. D., Herwehe, J., Hubler, G., Kuster, W. C., Martin, R., McMillen, R. T., Montzka, S. A., Norton, R. B., Parrish, D. D., Ridley, B. A., Shetter, R. E., Walega, J. G., Watkins, B. A., Westberg, H. H., and Williams, E. J.: Photochemical ozone production in the rural Southeastern United States during the 1990 Rural Oxidants in the Southern Environ-15
ment (ROSE) program, J. Geophys. Res., 103, 22491–22508, 1998.
Hofzumahaus, A., Rohrer, F., Lu, K., Hohn, B., Brauers, T., Chang, C.-C., Fuchs, H., Holland, F., Kita, K., Kondo, Y., Li, X., Lou, S., Shao, M., Zeng, L., Wahner, A., and Zhang, Y.: Amplified trace gas removal in the troposphere, Science, 324, 1702–1704, 2009.
Kleinman, L. I., Daum, P. H., Imre, D., Lee, Y.-N., Nunnermacker, L. J., Springston, S. R., 20
Weinstein-Lloyd, J., and Rodolph, J.: Ozone production rate and hydrocarbon reactivity in 5 urban areas: a cause of high ozone concentration in Houston, Geophys. Res. Lett., 29, 1467, doi:10.1029/2001GL014569, 2002.
Levy II, H., Mahlman, J. D., Moxim, W. J., and Liu, S. C.: Tropospheric ozone: the role of transport, J. Geophys. Res., 90, 3753–3772, 1985.
25
Liu, J. F., Mu, Y. J., Zhang, Y. J., Zhang, Z. M., Wang, X. K., Liu, Y. J., and Sun, Z. Q.: Atmo-spheric levels of BTEX compounds during the 2008 Olympic Games in the urban area of Beijing, Sci. Total Environ., 408, 109–116, 2009.
Lu, K., Zhang, Y., Su, H., Brauers, T., Chou, C. C.-K., Hofzumahaus, A., Liu, S. C., Kita, K., Kondo, Y., Shao, M., Wahner, A., Wang, J. Wang, X., and Zhu, T.: Oxidant (O3+NO2) 30
production processes and formation regimes in Beijing, J. Geophys. Res., 115, D07303, doi:10.1029/2009JD012714, 2010.
Mijling, B., van der A, R. J., Boersma, K. F., Van Roozendael, M., De Smedt, I., and
ACPD
11, 16553–16584, 2011Photochemical production of ozone in Beijing during the 2008 Olympic Games
C. C.-K. Chou et al.
Title Page
Abstract Introduction
Conclusions References
Tables Figures
◭ ◮
◭ ◮
Back Close
Full Screen / Esc
Printer-friendly Version
Interactive Discussion
Discussion
P
a
per
|
Dis
cussion
P
a
per
|
Discussion
P
a
per
|
Discussio
n
P
a
per
Kelder, H. M.: Reductions of NO2 detected from space during the 2008 Beijing Olympic Games, Geophys. Res. Lett., 36, L13801, doi:10.1029/2009GL038943, 2009.
Molina, L. T., Molina, M. J., Slott, R. S., Kolb, C. E., Gbor, P. K., Meng, F., Singh, R. B., Galvez, O., Sloan, J. J., Anderson, W. P., Tang, X., Hu, M., Xie, S., Shao, M., Zhu, T., Zhang, Y. H., Gurjar, B. R., Artaxo, P. E., Oyola, P., Gramsch, E., Hidalgo, D., and 5
Gertler, A. W.: Air quality in selected megacities, J. Air Waste Manage. Assoc., 55, 1–73, 2004.
Sillman, S.: The use of NOy, H2O2, and HNO3as indicators for ozone-NOx-hydrocarbon sensi-tivity in urban locations, J. Geophys. Res., 100, 14175–14188, 1995.
Wang, T. and Xie, S.: Assessment of traffic-related air pollution in the urban streets before and 10
during the 2008 Beijing Olympic Games traffic control period, Atmos. Environ., 43, 5682– 5690, 2009.
Wang, T., Ding, A. J., Gao, J., and Wu, W. S.: Strong ozone production in urban plumes from Beijing, China, Geophys. Res. Lett., 33, L21806, doi:10.1029/2006GL027689, 2006.
Wang, Y., Hao, J., McElroy, M. B., Munger, J. W., Ma, H., Chen, D., and Nielsen, C. P.: Ozone 15
air quality during the 2008 Beijing Olympics: effectiveness of emission restrictions, Atmos. Chem. Phys., 9, 5237–5251, doi:10.5194/acp-9-5237-2009, 2009a.
Wang, M., Zhu, T., Zheng, J., Zhang, R. Y., Zhang, S. Q., Xie, X. X., Han, Y. Q., and Li, Y.: Use of a mobile laboratory to evaluate changes in on-road air pollutants during the Beijing 2008 Summer Olympics, Atmos. Chem. Phys., 9, 8247–8263, doi:10.5194/acp-9-8247-2009, 20
2009b.
Wang, B., Shao, M., Lu, S. H., Yuan, B., Zhao, Y., Wang, M., Zhang, S. Q., and Wu, D.: Variation of ambient non-methane hydrocarbons in Beijing city in summer 2008, Atmos. Chem. Phys., 10, 5911–5923, doi:10.5194/acp-10-5911-2010, 2010a.
Wang, T., Nie, W., Gao, J., Xue, L. K., Gao, X. M., Wang, X. F., Qiu, J., Poon, C. N., Meinardi, S., 25
Blake, D., Wang, S. L., Ding, A. J., Chai, F. H., Zhang, Q. Z., and Wang, W. X.: Air quality during the 2008 Beijing Olympics: secondary pollutants and regional impact, Atmos. Chem. Phys., 10, 7603–7615, doi:10.5194/acp-10-7603-2010, 2010b.
Wang, S. X., Zhao, M., Xing, J.,Wu, Y., Zhou, Y., Lei, Y., He, K. B., Fu, L. X., Hao, J. M.: Quantifying the Air Pollutants Emission Reduction during the 2008 Olympic Games in Beijing, 30
Environ. Sci. Technol., 44(7), 2490–2496, 2010c.
ACPD
11, 16553–16584, 2011Photochemical production of ozone in Beijing during the 2008 Olympic Games
C. C.-K. Chou et al.
Title Page
Abstract Introduction
Conclusions References
Tables Figures
◭ ◮
◭ ◮
Back Close
Full Screen / Esc
Printer-friendly Version
Interactive Discussion
Discussion
P
a
per
|
Dis
cussion
P
a
per
|
Discussion
P
a
per
|
Discussio
n
P
a
per
|
Witte, J. C., Schoeberl, M. R., Douglass, A. R., Gleason, J. F., Krotkov, N. A., Gille, J. C., Pickering, K. E., and Livesey, N.: Satellite observations of changes in air quality dur-ing the 2008 Beijdur-ing Olympics and Paralympics, Geophys. Res. Lett., 36, L17803, doi:10.1029/2009GL039236, 2009.
Wood, E. C., Herndon, S. C., Onasch, T. B., Kroll, J. H., Canagaratna, M. R., Kolb, C. E., 5
Worsnop, D. R., Neuman, J. A., Seila, R., Zavala, M., and Knighton, W. B.: A case study of ozone production, nitrogen oxides, and the radical budget in Mexico City, Atmos. Chem. Phys., 9, 2499–2516, doi:10.5194/acp-9-2499-2009, 2009.
Zhou, Y., Wu, Y., Yang, L., Fu, L., He, K., Wang, S., Hao, J., Chen, J., and Li, C.: The impact of transportation control measures on emission reductions during the 2008 Olympic Games in 10
Beijing, China, Atmos. Environ., 44(3), 285–293, 2010.
ACPD
11, 16553–16584, 2011Photochemical production of ozone in Beijing during the 2008 Olympic Games
C. C.-K. Chou et al.
Title Page
Abstract Introduction
Conclusions References
Tables Figures
◭ ◮
◭ ◮
Back Close
Full Screen / Esc
Printer-friendly Version
Interactive Discussion
Discussion
P
a
per
|
Dis
cussion
P
a
per
|
Discussion
P
a
per
|
Discussio
n
P
a
per
Table 1.The NMHCs measured in this study.
1,2,3-Trimethylbenzene* Benzene* n-Butane* 1,2,4-Trimethylbenzene* Beta-pinene n-Decane* 1,3,5-Trimethylbenzene* Cis-2-butene* n-Heptane*
1-Butene* Cis-2-hexene n-Hexane*
1-Pentene* Cis-2-pentene* n-Nonane*
2,2,4-Trimethylpentane* Cyclohexane* n-Octane* 2,2-Dimthylbutane* Cyclopentane* n-Pentane* 2,3,4-Trimethylpentane Cyclopentene n-Propylbenzene*
2,3-Dimethylbutane Ethane n-Undecane*
2,3-Dimethylpentane* Ethene o-Diethylbenzene 2,4-Dimethylpentane* Ethylbenzene* o-Ethyltoluene*
2-Methyl-1-pentene Ethyne o-Xylene*
2-Methyl-2-butene Isobutane* p-Diethylbenzene* 2-Methylheptane* Isobutene p-Ethyltoluene*
2-Methylhexane* Isopentane* Propane*
2-Methylpentane* Isoprene* Propene*
3-Methyl-1-butene Isopropylbenzene* Styrene* 3-Methylheptane* m,p-Xylene* Toluene* 3-Methylhexane* m-Diethylbenzene* Trans-2-butene* 3-Methylpentane* Methylcyclohexane* Trans-2-hexene 4-Methyl-1-pentene Methylcyclopentane* Trans-2-pentene* Alpha-pinene m-Ethyltoluene*
ACPD
11, 16553–16584, 2011Photochemical production of ozone in Beijing during the 2008 Olympic Games
C. C.-K. Chou et al.
Title Page
Abstract Introduction
Conclusions References
Tables Figures
◭ ◮
◭ ◮
Back Close
Full Screen / Esc
Printer-friendly Version
Interactive Discussion
Discussion
P
a
per
|
Dis
cussion
P
a
per
|
Discussion
P
a
per
|
Discussio
n
P
a
per
|
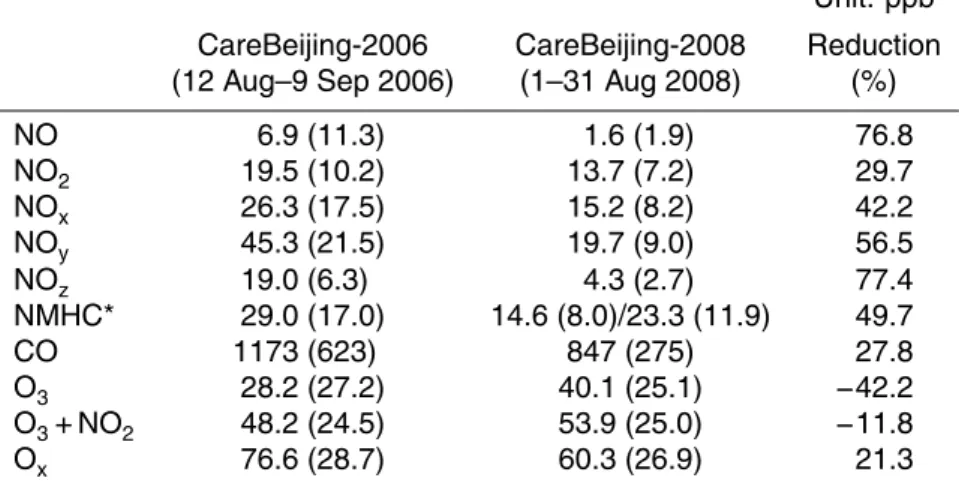
Table 2. Statistics of the ambient levels of trace gases measured in Beijing during CAREBeijing-2006 and CAREBeijing-2008. The standard deviation of each mean value is noted in the parentheses.
Unit: ppb
CareBeijing-2006 CareBeijing-2008 Reduction (12 Aug–9 Sep 2006) (1–31 Aug 2008) (%)
NO 6.9 (11.3) 1.6 (1.9) 76.8
NO2 19.5 (10.2) 13.7 (7.2) 29.7
NOx 26.3 (17.5) 15.2 (8.2) 42.2
NOy 45.3 (21.5) 19.7 (9.0) 56.5
NOz 19.0 (6.3) 4.3 (2.7) 77.4
NMHC* 29.0 (17.0) 14.6 (8.0)/23.3 (11.9) 49.7
CO 1173 (623) 847 (275) 27.8
O3 28.2 (27.2) 40.1 (25.1) −42.2
O3+NO2 48.2 (24.5) 53.9 (25.0) −11.8
Ox 76.6 (28.7) 60.3 (26.9) 21.3
* The NMHCs measurements of CAREBeijing-2008 include 65 species as listed in Table 1; among which 49 species were measured in CareBeijing-2006. The reduction ratio is based on the measurements of 49 species.
ACPD
11, 16553–16584, 2011Photochemical production of ozone in Beijing during the 2008 Olympic Games
C. C.-K. Chou et al.
Title Page Abstract Introduction Conclusions References Tables Figures ◭ ◮ ◭ ◮ Back Close
Full Screen / Esc
Printer-friendly Version Interactive Discussion Discussion P a per | Dis cussion P a per | Discussion P a per | Discussio n P a per 0 10 20 30 NO (p p b ) 0 20 40 60 NO
2 (p
p b ) NO NO2 0 20 40 60 80 N O y ( ppb ) 0 10 20 30 40 NO z (p p b ) NOy NOz 0 50 100 150 200 O
3 (
ppb) 0 50 100 150 200 O x ( ppb) O3 Ox 0 1 2 3 C O ( ppm ) 0 50 100 N M H C ( ppb) CO NMHC 0 200 400 600 800 1000 2008/ 8 /1 2008/ 8 /2 2008/ 8 /3 2008/ 8 /4 2008/ 8 /5 2008/ 8 /6 2008/ 8 /7 2008/ 8 /8 2008/ 8 /9 2 008/ 8/10 2 008/ 8/11 2 008/ 8/12 2 008/ 8/13 2 008/ 8/14 2 008/ 8/15 2 008/ 8/16 2 008/ 8/17 2 008/ 8/18 2 008/ 8/19 2 008/ 8/20 2 008/ 8/21 2 008/ 8/22 2 008/ 8/23 2 008/ 8/24 2 008/ 8/25 2 008/ 8/26 2 008/ 8/27 2 008/ 8/28 2 008/ 8/29 2 008/ 8/30 2 008/ 8/31 2008/ 9 /1 S W I (W/ m
2 )
0 1 2 3 4 5 WS (m /s ) SWI WS
ACPD
11, 16553–16584, 2011Photochemical production of ozone in Beijing during the 2008 Olympic Games
C. C.-K. Chou et al.
Title Page
Abstract Introduction
Conclusions References
Tables Figures
◭ ◮
◭ ◮
Back Close
Full Screen / Esc
Printer-friendly Version
Interactive Discussion
Discussion
P
a
per
|
Dis
cussion
P
a
per
|
Discussion
P
a
per
|
Discussio
n
P
a
per
|
0 5 10 15 20 25 30 35 40
00:00 02:00 04:00 06:00 08:00 10:00 12:00 14:00 16:00 18:00 20:00 22:00 00:00
N
O
(
ppb)
CareBJ-2008 CareBJ-2006
ʻ˴ʼ
0 5 10 15 20 25 30 35 40 45 50
00:00 02:00 04:00 06:00 08:00 10:00 12:00 14:00 16:00 18:00 20:00 22:00 00:00
NO
2
(
ppb)
CareBJ-2008 CareBJ-2006
ʻ˵ʼ
0 5 10 15 20 25 30 35 40
00:00 02:00 04:00 06:00 08:00 10:00 12:00 14:00 16:00 18:00 20:00 22:00 00:00
N
O
z
(
ppb)
CareBJ-2008
CareBJ-2006
ʻ˶ʼ
0 20 40 60 80 100 120
00:00 02:00 04:00 06:00 08:00 10:00 12:00 14:00 16:00 18:00 20:00 22:00 00:00
N
O
y
(
ppb)
CareBJ-2008 CareBJ-2006
ʻ˷ʼ
Fig. 2. Averaged diurnal variations in the mixing ratios of trace gases measured at the PKU observatory during the CAREBeijing-2006 and CAREBeijing-2008, respectively. The time res-olution of the measurements, except NMHCs, of the 2008 campaign is 1 min, whereas the results of the 2006 campaign are hourly based. The ranges of±1σare indicated by the error bars associated with the hourly means or shaded for the 1-min. data.(a)NO;(b)NO2;(c)NOz;
(d)NOy;(e)CO;(f)NMHCs;(g)O3;(h)Ox.
ACPD
11, 16553–16584, 2011Photochemical production of ozone in Beijing during the 2008 Olympic Games
C. C.-K. Chou et al.
Title Page
Abstract Introduction
Conclusions References
Tables Figures
◭ ◮
◭ ◮
Back Close
Full Screen / Esc
Printer-friendly Version
Interactive Discussion
Discussion
P
a
per
|
Dis
cussion
P
a
per
|
Discussion
P
a
per
|
Discussio
n
P
a
per
0 0.5 1 1.5 2 2.5 3
00:00 02:00 04:00 06:00 08:00 10:00 12:00 14:00 16:00 18:00 20:00 22:00 00:00
C
O
(
ppm
)
CareBJ-2008 CareBJ-2006
ʻ˸ʼ
0 10 20 30 40 50 60 70 80
0:
0
0
2:
0
0
4:
0
0
6:
0
0
8:
0
0
10:00 12:00 14:00 16:00 18:00 20:00 22:00 0:
0
0
N
M
H
C
s
(
ppb)
CareBJ-2008
CareBJ-2006
ʻ˹ʼ
0 20 40 60 80 100 120
00:00 02:00 04:00 06:00 08:00 10:00 12:00 14:00 16:00 18:00 20:00 22:00 00:00
O3
(
ppb)
CareBJ-2008 CareBJ-2006
ʻ˺ʼ
0 20 40 60 80 100 120 140 160
00:00 02:00 04:00 06:00 08:00 10:00 12:00 14:00 16:00 18:00 20:00 22:00 00:00
O
x
(
ppb)
CareBJ-2008 CareBJ-2006
ʻ˻ʼ
ACPD
11, 16553–16584, 2011Photochemical production of ozone in Beijing during the 2008 Olympic Games
C. C.-K. Chou et al.
Title Page Abstract Introduction Conclusions References Tables Figures ◭ ◮ ◭ ◮ Back Close
Full Screen / Esc
Printer-friendly Version Interactive Discussion Discussion P a per | Dis cussion P a per | Discussion P a per | Discussio n P a per | 0 10 20 30 40 50 60 70 80 90 0: 00 2: 00 4: 00 6: 00 8: 00 10: 00 12: 00 14: 00 16: 00 18: 00 20: 00 22: 00 00: 00 M ix ing R a ti o ( ppb) 0 5 10 15 20 25 30 35 40 45 50 NO2 NOy NO ʻ˴ʼ 0 20 40 60 80 100 120 140 160 180 200 0: 00 2: 00 4: 00 6: 00 8: 00 10: 00 12: 00 14: 00 16: 00 18: 00 20: 00 22: 00 00: 00 O3 , O x ( p p b ) 0 10 20 30 40 50 NO z ( p p b ) Ox O3 NOz ʻ˵ʼ 0 10 20 30 40 50 60 0: 00 2: 00 4: 00 6: 00 8: 00 10 :0 0 12 :0 0 14 :0 0 16 :0 0 18 :0 0 20 :0 0 22 :0 0 00 :0 0 NM H C s ( p p b ) 0 0.5 1 1.5 2 2.5 CO ( p pm ) NMHCs CO ʻ˶ʼ
Fig. 3. Time series of the mixing ratios of trace gases and the meteorological conditions in Beijing for 3 August 2008. (a)NO, NO2, and NOy; (b)Ox, O3, and NOz;(c)NMHCs and CO;
(d)wind speed and direction;(e)ambient temperature, RH, and SWI.
ACPD
11, 16553–16584, 2011Photochemical production of ozone in Beijing during the 2008 Olympic Games
C. C.-K. Chou et al.
Title Page Abstract Introduction Conclusions References Tables Figures ◭ ◮ ◭ ◮ Back Close
Full Screen / Esc
Printer-friendly Version Interactive Discussion Discussion P a per | Dis cussion P a per | Discussion P a per | Discussio n P a per 0 1 2 3 4 5 0: 00 2: 00 4: 00 6: 00 8: 00 10 :0 0 12 :0 0 14 :0 0 16 :0 0 18 :0 0 20 :0 0 22 :0 0 00 :0 0 WS (m/ s) 0 90 180 270 360 W D ( d eg re e) WS WD ʻ˷ʼ 0 100 200 300 400 500 600 700 800 900 1000 0: 00 2: 00 4: 00 6: 00 8: 00 10: 00 12: 00 14: 00 16: 00 18: 00 20: 00 22: 00 00: 00 SW I ( W m -2 ) 20 30 40 50 60 70 80 90 T ( o C) , R H ( % ) SWI Temp RH ʻ˸ʼ
ACPD
11, 16553–16584, 2011Photochemical production of ozone in Beijing during the 2008 Olympic Games
C. C.-K. Chou et al.
Title Page
Abstract Introduction
Conclusions References
Tables Figures
◭ ◮
◭ ◮
Back Close
Full Screen / Esc
Printer-friendly Version
Interactive Discussion
Discussion
P
a
per
|
Dis
cussion
P
a
per
|
Discussion
P
a
per
|
Discussio
n
P
a
per
|
11:22-12:00
slope = 7.85
R
2= 0.8900
10:43-11:22
slope = 3.59
R
2= 0.7024
9:00-10:43
slope = 8.62
R
2= 0.8516
0 20 40 60 80 100 120 140 160 180
0 5 10 15
NOz (ppb)
Ox
(p
p
b
)
Fig. 4. Correlation between Ox and NOz observed at the PKU observatory in the morning of 3 August 2008. The data are divided into three periods to characterize the ozone produc-tion efficiency of NOx (OPEx) before, during, and after the spiky event of primary pollutants, respectively.
ACPD
11, 16553–16584, 2011Photochemical production of ozone in Beijing during the 2008 Olympic Games
C. C.-K. Chou et al.
Title Page
Abstract Introduction
Conclusions References
Tables Figures
◭ ◮
◭ ◮
Back Close
Full Screen / Esc
Printer-friendly Version
Interactive Discussion
Discussion
P
a
per
|
Dis
cussion
P
a
per
|
Discussion
P
a
per
|
Discussio
n
P
a
per
y = 14.603x - 11.817
R2 = 0.953
0 25 50 75 100 125 150
0 2 4 6 8 10 12
NO2/NO
O3
(p
p
b
)
0 5 10 15 20 25 30
NO
z (
p
p
b
)
O3
NOz
ACPD
11, 16553–16584, 2011Photochemical production of ozone in Beijing during the 2008 Olympic Games
C. C.-K. Chou et al.
Title Page
Abstract Introduction
Conclusions References
Tables Figures
◭ ◮
◭ ◮
Back Close
Full Screen / Esc
Printer-friendly Version
Interactive Discussion
Discussion
P
a
per
|
Dis
cussion
P
a
per
|
Discussion
P
a
per
|
Discussio
n
P
a
per
|
Fig. 6.Backward trajectories of air mass arriving Beijing at 17:00, 3 August(a), and at 12:00, 15 August 2008(b). The trajectories were calculated for 24 h from an altitude of 500 m above the ground level of Beijing.
ACPD
11, 16553–16584, 2011Photochemical production of ozone in Beijing during the 2008 Olympic Games
C. C.-K. Chou et al.
Title Page Abstract Introduction Conclusions References Tables Figures ◭ ◮ ◭ ◮ Back Close
Full Screen / Esc
Printer-friendly Version Interactive Discussion Discussion P a per | Dis cussion P a per | Discussion P a per | Discussio n P a per 0 10 20 30 40 50 60 70 0: 0 0 2: 0 0 4: 0 0 6: 0 0 8: 0 0 10 :00 12 :00 14 :00 16 :00 18 :00 20 :00 22 :00 00 :00 M ixi n g R a ti o (p p b ) NO NO2 NOy ʻ˴ʼ 0 10 20 30 40 50 60 70 80 0: 00 2: 00 4: 00 6: 00 8: 00 10: 00 12: 00 14: 00 16: 00 18: 00 20: 00 22: 00 00: 00 O3 , O x ( p p b ) 0 10 20 30 40 50 NO z ( p p b ) Ox O3 NOz ʻ˵ʼ 0 5 10 15 20 25 30 35 40 45 0: 00 2: 00 4: 00 6: 00 8: 00 10 :0 0 12 :0 0 14 :0 0 16 :0 0 18 :0 0 20 :0 0 22 :0 0 00 :0 0 NM H C s ( p p b ) 0 0.2 0.4 0.6 0.8 1 1.2 1.4 1.6 CO ( p pm ) NM HCs CO ʻ˶ʼ
ACPD
11, 16553–16584, 2011Photochemical production of ozone in Beijing during the 2008 Olympic Games
C. C.-K. Chou et al.
Title Page Abstract Introduction Conclusions References Tables Figures ◭ ◮ ◭ ◮ Back Close
Full Screen / Esc
Printer-friendly Version Interactive Discussion Discussion P a per | Dis cussion P a per | Discussion P a per | Discussio n P a per | 0 1 2 3 4 5 0: 00 2: 00 4: 00 6: 00 8: 00 10 :0 0 12 :0 0 14 :0 0 16 :0 0 18 :0 0 20 :0 0 22 :0 0 00 :0 0 WS (m/ s) 0 90 180 270 360 W D ( d eg re e) WS WD ʻ˷ʼ 0 100 200 300 400 500 600 700 800 900 1000 0: 00 2: 00 4: 00 6: 00 8: 00 10: 00 12: 00 14: 00 16: 00 18: 00 20: 00 22: 00 00: 00 SW I ( W m -2 ) 20 30 40 50 60 70 80 90 100 T ( o C) , RH ( % ) SWI Temp RH ʻ˸ʼ
Fig. 7.Continued.
ACPD
11, 16553–16584, 2011Photochemical production of ozone in Beijing during the 2008 Olympic Games
C. C.-K. Chou et al.
Title Page
Abstract Introduction
Conclusions References
Tables Figures
◭ ◮
◭ ◮
Back Close
Full Screen / Esc
Printer-friendly Version
Interactive Discussion
Discussion
P
a
per
|
Dis
cussion
P
a
per
|
Discussion
P
a
per
|
Discussio
n
P
a
per
y = 1.1874x + 41.021
R2 = 0.1931
0 10 20 30 40 50 60 70 80
0.00 2.00 4.00 6.00 8.00 10.00
NOz (ppb)
O
x
(
ppb
)
Fig. 8. Correlation between Ox and NOzobserved at the PKU observatory during the midday (10:00–14:00) of 15 August 2008. An averaged OPEx of 1.2 mole mole−1