www.atmos-chem-phys.net/9/5711/2009/ © Author(s) 2009. This work is distributed under the Creative Commons Attribution 3.0 License.
Chemistry
and Physics
Physical and chemical properties of the regional mixed layer of
Mexico’s Megapolis
D. Baumgardner1, M. Grutter1, J. Allan2, C. Ochoa1, B. Rappenglueck3, L. M. Russell4, and P. Arnott5 1Centro de Ciencias de la Atm´osfera, Universidad Nacional Aut´onoma de M´exico, Mexico City, Mexico 2School of Earth, Atmospheric & Environmental Science, University of Manchester, Manchester, UK 3Earth and Atmospheric Sciences Department, University of Houston, Houston, TX, USA
4Scripps Institution of Oceanography, University of California San Diego, La Jolla, CA, USA 5Department of Physics, University of Nevada, Reno, NV, USA
Received: 3 December 2008 – Published in Atmos. Chem. Phys. Discuss.: 30 January 2009 Revised: 3 June 2009 – Accepted: 1 August 2009 – Published: 11 August 2009
Abstract. The concentration of gases and aerosol parti-cles have been measured at the mountain site of Altzomoni, 4010 m in altitude, located 60 km southeast of Mexico City, 50 km east of Puebla and 70 km northeast of Cuernavaca. The objective of this study was to evaluate the properties of gases and particles in the Regional Mixed Layer (RML) of Mexico’s Megapolis. Altzomoni is generally above the RML from late evening until late morning at which time the arrival of the RML is marked by increasing concentrations of CO and aerosol particles that reach their maxima in mid-afternoon. The average diurnal cycles for fourteen days in March, 2006 were evaluated during which time the synop-tic scale circulation had three principal patterns: from the east (E), southwest (SW) and west northwest (WNW). The original hypothesis was that air arriving from the direction of Mexico City would have much higher concentrations of an-thropogenic gases and particles than air from Puebla or Cuer-navaca, due to the relatively large differences in populations. In fact, not only were the average, maximum concentrations of CO and O3(0.3 and 0.1 ppmv) approximately the same for
air originating from the WNW and E, but the average max-imum concentrations of Peroxyacyl nitrates (PAN,PPN) and particle organic matter (POM) in air from the E exceeded those in air from the WNW.
Comparisons of measurements from the mountain site with those made by aircraft during the same period, using the same type of aerosol mass spectrometer, show that the total
Correspondence to:D. Baumgardner ([email protected])
masses of POM, NO−3, SO24−and NH+4 were approximately the same from aircraft measurements made over Mexico City and when winds were from the east at the mountain site. In contrast 75% of the total aerosol mass at the mountain site was POM whereas over Mexico City the fraction of POM was less than 60%.
The measurements suggest the occasional influence of emissions from the nearby volcano, Popocatepetl, as well as possible incursions of biomass combustion; however, the large concentrations of O3, PAN and POM suggest that
sec-ondary processes are the major source for these gases and particles. The similar concentrations in gases and particles when air is coming from the E and NWN raises the possibil-ity of recirculation of air from Mexico Cpossibil-ity and the impor-tance of this mechanism for impacting the regional air qual-ity.
1 Background
In the central plateau region of Mexico, 33% of the coun-try’s population resides in Mexico City and in the states of Morelos, Mexico, Puebla, Tlaxcala and Quer´etaro, i.e. approximately 36 million inhabitants living in a region the size of Switzerland but five times the population. This re-gion has been designated a Megapolis by local authorities (Proaire, 2007) where a Megapolis is defined as an extensive metropolitan area or a group of continuous metropolitan ar-eas (Gottmann, 1957). The human activities in this region produce large concentrations of gases and particles, largely as a result of combustion from power generation, industrial
operations, motor vehicle traffic and cooking (Proaire, 2007). A large fraction of this area is also agricultural or forested and during some months of the year biomass burning, inten-tional or inadvertent, makes a significant contribution to the poor air quality in the Megapolis (Molina et al., 2007; Bravo et al., 2002; Salcedo et al., 2006) particularly when it inten-sifies in late March, reaching a maximum in May each year (Fast et al., 2007; Bravo et al., 2002).
As summarized in Table 1 this megapolis has annual emissions of almost 5.0×10⁶Mt of CO, NOx, SOx, VOCs, PM2.5and NH3(all data taken from the 1999 Mexican
Na-tional Inventory of Emissions, http://www.epa.gov/ttn/chief/ net/mexico.html, except the SOxvalues that are reported by
Rivera et al., 2009). The Mexico City metropolitan area (MCMA), made up of the states of Distrito Federal (DF) and Mexico, produces a large fraction of the pollutants in the re-gion; however, from Table 1 we see that Hidalgo, the state on the northern border of the MCMA, produces 60% of the SOx
in the megapolis and that emissions of PM2.5and NH3 are
approximately the same in the state of Puebla as produced in the MCMA. As noted by Whiteman (2000) and Fast et al. (1998), the pollution from areas outside of the MCMA can be transported into Mexico City and subsequently im-pact the general air quality in this urban area. Hence, when assessing the regional and global impact of pollution from central Mexico, emissions from the entire Megapolis must be taken into account.
Since the early 1990s a number of field programs have focused on characterizing the pollution produced by the MCMA and on evaluating its impact on health and climate. Project Aguila studied the vertical structure of pollution in Mexico City with the NSF/NCAR King Air for two weeks in February of 1991 (Nickerson et al., 1992, 1993; Perez and Raga, 1998). In addition to revealing the large varia-tion in gas and particle concentravaria-tions over different parts of the city, the vertical profiles showed elevated layers of ozone (O3)and aerosol particles between 2000 and 3000 m above
the city indicating that the boundary layer grows to a depth several kilometers deep.
In February and March, 1997, another major field cam-paign, called “Investigacion sobre Materia Particulada y Deterioro Atmosferico – Aerosol and Visibility Research (IMADA-AVER)” was conducted in Mexico City (Edgerton et al., 1999). Among the many measurements that were made were those with wind profilers to measure the boundary layer depth. Those results provided further evidence that the Mex-ico City mixed layer grows more than 3000 m above the basin of the city (Whiteman, 2000).
The vertical structure of the atmosphere and concentra-tions of gases and particles measured by aircraft and wind profilers show that the city’s pollution rises to levels where prevailing winds will transport it regionally. Indeed, various modeling studies that followed the 1997 field program simu-lated the transport of particles out of the Mexico City basin (Fast and Zhong, 1998; Whiteman et al., 2000) and in one
study (Barth and Church, 1999) sulfate produced from SO2
emissions had potential lifetimes of 5.5 days and was trans-ported as far as the western Mediterranean Sea.
In the spring of 1999, measurements of CO, O3and other
gases were made on the Altzomoni ridge with a mobile air quality laboratory provided by the Mexico City govern-ment (Jimenez, 2004). This ridge is located in the Pass of Cortez between the volcanoes of Popocat´epetl and Iz-tacc´ıhuatl located approximately 60 km to the southeast of Mexico City. This site was selected because of its altitude of 4010 m (1700 m above Mexico City) and it is also where the previous modeling studies (Fast and Zhong, 1998; White-man et al., 2000) indicated that air masses from Mexico City would eventually pass. It was seen from these mea-surements (Fig. 1) that the CO and O3 concentrations had
diurnal variations similar to those measured at Merced, a site in the center of Mexico City, also operated by the city government as part of its Red Autom´atica de Monitoreo At-mosf´erico (RAMA). The major difference was that the max-ima in concentrations occurred approxmax-imately six hours after those in the city and the CO at the mountain site had been diluted by a factor of three compared to that measured in the city. There was also clear evidence of additional photo-chemical production of O3as the air was transported from the
city since the O3at the mountain site never decreased below
0.050 ppm. These results were the motivation for a follow-on study at the same site but incorporating a larger suite of in-struments. This study was conducted in March, 2006 during the Megacities Initiative: Local And Global Research Obser-vations (MILAGRO) whose principle objective was to study the transport and transformation of anthropogenic emissions from the MCMA using a complex array of instruments that were deployed at ground sites and on airborne platforms. The measurements made at Altzomoni, at an altitude that puts it at approximately the same level as the upper third of the afternoon regional mixed layer (RML), complement those that were made from the aircraft during the MILA-GRO campaign. The following analysis discusses the diur-nal variations in the properties of gases and aerosol particles, puts them into the context of the processes that affect these properties and compares the results with some of those found from the aircraft measurements and other ground sites during that same period.
2 Instrumentation
The suite of instruments deployed at the research site con-sisted of sensors for establishing the meteorological state of the atmosphere, the concentration of the principal trace gases and the physical, optical and chemical properties of aerosol particles. Table 2 lists the instruments with information on their detection limits and accuracies.
Table 1.Pollutant production in the Megapolis Metric Tons/year (%of total).
State Pollutant
NOx SOx VOC CO PM2.5 NH3
D.F. 98 706 (26) 7041 (3) 234 881 (26) 848 590 (31) 6834 (6) 10 782 (5) Mexico 125 595 (33) 52 145 (20) 361 045 (40) 1 102 073 (40) 27 442 (24) 54 124 (27) Puebla 39 781 (11) 19 978 (8) 142 546 (16) 397 993 (14) 33 341 (30) 67 481 (34) Morelos 16 100 (4) 15 279 (6) 39 279 (4) 97 836 (4) 6117 (5) 13 197 (7) Hidalgo 69 792 (18) 156 000 (60) 59 987 (7) 170 794 (6) 28 997 (26) 27 619 (14) Tlaxcala 11 027 (3) 6204 (2) 14 047 (2) 72 431 (3) 4212 (4) 9193 (5) Queretaro 14 509 (4) 9607 (4) 36 094 (4) 87 318 (3) 6139 (5) 9227 (5)
Totals 375 513 266 254 902 418 2 777 039 113 008 199 385
The state parameters, winds and radiation (solar and UV) were recorded once per minute from the weather station1that was located at an altitude of two meters AGL. Measurements of CO, O3and SO2were made with an active Fourier
Trans-form Infrared (FTIR) spectrometer, operated with an open path length of 350 m. The spectra from this remote sens-ing system, acquired at a rate of 1 Hz and 0.5 cm−1 resolu-tion, were averaged to a sample interval of every five min-utes. The concentrations of Peroxyacyl nitrates (PANs) were made with a dual column gas chromatograph2equipped with an electron capture detector.
The condensation nuclei (CN) concentration, particles larger than approximately 20 nm, was measured with a TSI3 model 3010 that was part of the TSI scanning mobility par-ticle sizer (SMPS) that also provided size distributions from 20 to 514 nm. The upper threshold was limited due to the re-striction on high voltage when operating at elevated altitudes where corona discharge occurs if a voltage of 5000 V is ex-ceeded. Size distributions for particles larger than 300 nm were measured with the LasAir Model 3104 that optically sized particles from 0.3 to 25µm.
The absorption coefficient was measured with a Particle Soot Absorption Photometer (PSAP)4 at a wavelength of 550 nm and a Photoacoustic Soot Spectrometer (PASS)5at a wavelength of 850 nm. The scattering coefficient was mea-sured with a Nephelometer6 operating at a wavelength of 550 nm. The nephelometer was calibrated in accordance with the recommendations of the manufacturer and corrections were applied to the measurements of the PSAP to account for scattering effects (Bond et al., 1999).
The mass concentration of organic and inorganic ions was measured with an Aerodyne quadrupole Aerosol Mass
Spec-1Davis Instruments
2Metcon Inc., K¨onigstein, Germany
3Thermal Systems Incorporated, St. Paul, MN 4Particle Measuring Systems, Boulder, CO 5Droplet Measurement Technologies, Boulder, CO. 6Radiance Research, Seattle, Wa.
Fig. 1. The time series of(A)carbon monoxide and(B)Ozone, measured at the Pass of Cortez (red curve) and in central Mexico City (black curve) during April, 1999 show similar daily cycles but several hours out of phase.
trometer (Q-AMS)7that was operated with a time resolution of five minutes (Jayne et al., 2000; Jimenez et al., 2004; Canagaratna et al., 2007). The collection efficiency of 0.5 was derived by comparing the total volume derived from the SMPS with the volume derived from the AMS mass con-centrations over the same size range as the SMPS and using the densities for the individual inorganic and organic com-ponents reported by Cross et al. (2006). Figure 2 shows the
7Aerodyne Inc.,Billerica, Ma.
Table 2.Instrumentation at Altzomoni.
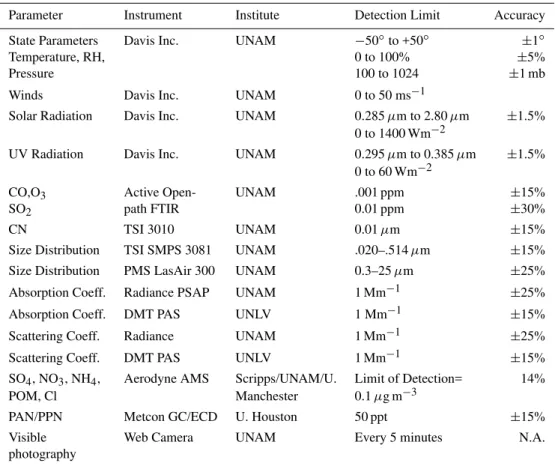
Parameter Instrument Institute Detection Limit Accuracy
State Parameters Davis Inc. UNAM −50◦to +50◦ ±1◦
Temperature, RH, 0 to 100% ±5%
Pressure 100 to 1024 ±1 mb
Winds Davis Inc. UNAM 0 to 50 ms−1
Solar Radiation Davis Inc. UNAM 0.285µm to 2.80µm ±1.5% 0 to 1400 Wm−2
UV Radiation Davis Inc. UNAM 0.295µm to 0.385µm ±1.5% 0 to 60 Wm−2
CO,O3 Active Open- UNAM .001 ppm ±15%
SO2 path FTIR 0.01 ppm ±30%
CN TSI 3010 UNAM 0.01µm ±15%
Size Distribution TSI SMPS 3081 UNAM .020–.514µm ±15%
Size Distribution PMS LasAir 300 UNAM 0.3–25µm ±25%
Absorption Coeff. Radiance PSAP UNAM 1 Mm−1 ±25%
Absorption Coeff. DMT PAS UNLV 1 Mm−1 ±15%
Scattering Coeff. Radiance UNAM 1 Mm−1 ±25%
Scattering Coeff. DMT PAS UNLV 1 Mm−1 ±15%
SO4, NO3, NH4, Aerodyne AMS Scripps/UNAM/U. Limit of Detection= 14%
POM, Cl Manchester 0.1µg m−3
PAN/PPN Metcon GC/ECD U. Houston 50 ppt ±15%
Visible Web Camera UNAM Every 5 minutes N.A.
photography
Fig. 2. The fidelity of the AMS measurements was evaluated by comparing the total volume concentration derived from the AMS and EBC mass concentrations with the volume concentration de-rived from the SMPS size distribution. The AMS concentrations were limited to 514 nm, the maximum size measured by the SMPS.
comparison in derived volume from the SMPS, for 30 min averages made over the period of the project, with volume derived from the AMS plus the additional contribution from the effective black carbon (EBC). The SMPS was also used in the calibration of the AMS that was done seven times over the course of the experiment (4, 12, 15, 20, 24, 28 and 30 of March) using 350 nm particles selected with an electro-static classifier from a nebulized solution of ammonium ni-trate. The frequent calibrations indicated that there was very little shift in the instrument response during the period of the experiment.
Sub-micron filter samples were taken twice a day, from 10:00 a.m. to 06:00 p.m. and 06:00 p.m. to 10:00 a.m. the following day. Fourier Transform Infrared Spectroscopy (FTIR) was used to quantify particulate organic functional groups, including saturated aliphatic (alkanes), unsaturated aliphatic (alkenes), aromatic, alcohol, carbonyl, amines, and organosulfate compounds (Maria et al., 2002, 2003; Russell, 2003; Gilardoni et al., 2007).
All of the instruments, except the meteorological sensors and FTIR gas instrument, were housed in a lightly insu-lated utility shed with no environmental control of temper-ature or humidity. The tempertemper-ature and RH generally were the same as the ambient, reported in the next section. All
the particle instruments, with the exception of the LasAir, sampled aerosols from a PM1.0 cyclone separator8 whose
inlet was located outside the shed in a three meter, venti-lated chimney. The air from the cyclone to the nephelometer, PSAP and CN counter was heated to approximately 40◦C to maintain the particles at low humidity. The purpose of the cyclone was to minimize truncation errors in the measure-ment of the scattering coefficient with the nephelometer and the aerosols were dried to prevent humidity enhancement of the absorption coefficient measured by the filter-based PSAP. The LasAir was operated in front of the cyclone in order to sample the coarse mode particles.
Since the measurements were acquired with several differ-ent acquisition systems, the data sets were time synchronized to a common time base then averaged every fifteen minutes for the analysis presented in this study.
3 Results and discussion
3.1 Measurement site
As shown in Fig. 3, the research site, hereafter referred to as Altzomoni (19.117◦N, 98.654◦W, 4010 m a.s.l.) is located
approximately 60 km southeast of the center of Mexico City, 70 km northeast of Cuernavaca, and 50 km west of Puebla. The map only shows the portion of the Mexico Megapolis closest to the Altzomoni site. The measurement site was sit-uated at the highest point on the ridge with an unobstructed view in all directions (Fig. 4) where the western slope is steeper than the east. In addition to its strategic location with respect to nearby urban areas, there are no significant local sources of anthropogenic contaminants since it is situated in the national park of Izta-Popo-Zoquiapan with only a single road nearby that is principally used to bring weekend tourists to the park center and is approximately five km to the south-east of the research site. The volcano, Popocatepetl, is active and could be a significant source of SO2and sulfate particles,
depending on wind patterns (Grutter et al., 2008). Biomass burning from forest fires or agricultural clearing is also a po-tential source of particles and gases.
The days selected for the current study were those where the RML was clearly observed to grow above the measure-ment site, as illustrated in Fig. 5, and whose measured daily trends in gas and particle concentrations exhibited a sharp gradient, as will be shown in the analysis below. All times are reported as local standard time (LST).
Days with precipitation or thick clouds were removed from the analysis as were those days influenced by local forest fires or other burning of biomass. Visual detection, the scent of wood burning and examination of MODIS-Aqua satellite images (Crounse et al., 2009) were used to identify these latter cases; however, influence from biomass burning cannot be completely removed from the data set, particularly
8University Research Glassware, Chapel Hill, N.C.
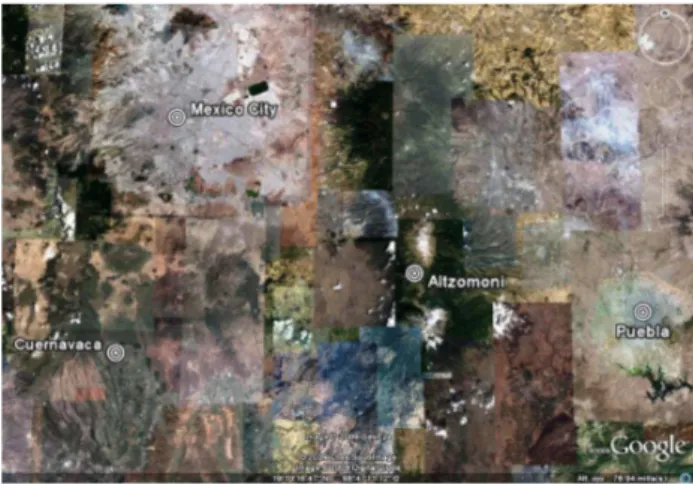
Fig. 3.The research site was situated on the Altzomoni ridge in the Pass of Cortez between the Popocatepetl and Iztacc´ıhuatl volcanoes. Mexico City is approximately 60 km to the northwest, Cuernavaca is 70 km west southwest and Puebla is 50 km to the east southeast (Map courtesy of Google Earth).
Fig. 4.The research site was at the highest point of the Altzomoni ridge, 4010 m, with an unobstructed, 360◦view of the region (top panel). The slopes of the ridge are much steeper towards the west than towards the east (bottom panel).
if there were more dispersed regions of agricultural burning used to clear fields. In addition, as discussed further below, throughout the research period there were fires burning in the Yucatan peninsula whose emissions cannot be ruled out as a contribution to the background levels of gases and particles (Yokelson et al., 2007; Crounse et al., 2009).
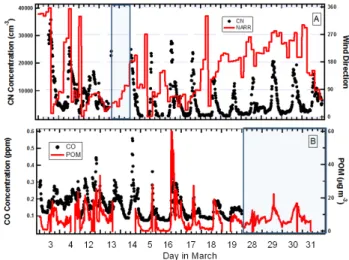
Fourteen days were selected for the analysis, 3, 4, 12–19 and 28–31 March. As shown by the time series of CO, CN and the particle organic matter (POM) measured by the AMS (Fig. 6), there is a clear diurnal pattern that is due to the in-cursion of the RML, given the lack of local emissions. The
Fig. 5. These two photographs, taken by the web camera that recorded images every five minutes from the measurement site, show the growth of the regional mixed layer, looking west to the southern edge of Mexico City.
shaded boxes highlight those time periods when equipment problems led to a loss of data from one or more of the sen-sors.
During the month of March, several different large scale circulation patterns evolved (Fast et al., 2007) during which time the air could arrive at Altzomoni from nearly all quad-rants depending on the synoptic situation. The primary ob-jective of the study presented here is to evaluate the diurnal properties of gases and particles at Altzomoni with respect to the directions from which the air masses are arriving at the site, under the assumption that there should be measureable differences depending on whether they have been previously over more urban areas, like Mexico City, or more rural areas like the agricultural valleys to the SW or E. We have used the wind fields derived from the North American Regional Re-analysis (NARR) at 650 mb (the average pressure measured at Altzomoni was 630 mb) to stratify the results. These data are available at a resolution of 32 km in the horizontal, every three hours. The closest grid point from the NARR was at 19.0688◦N, 98.7043◦W, or approximately five kilometers to the SW of Altzomoni. The airflow direction for the 14 days of the study is shown in Fig. 6a. The local wind direction, measured by the weather station at the research site, is not used for this analysis as it may not be representative of the regional scale circulations due to the influence of local topo-graphical features.
The emissions inventory shown in Table 1 show that the largest source of anthropogenic gases and particles is the MCMA, to the NW of Altzomoni, followed by Puebla to the East, and Morelos to the SW. Hence, the remainder of this presentation will look at the periods when the winds were from the WNW, E and SW, and the curves representing diur-nal averages of different properties will correspondingly be colored in black, green and red.
Fig. 6.Time series of wind direction derived from the North Amer-ican Regional Reanalysis (NARR) and CN concentration(A)and the concentrations of CO and POM for the 14 analysis days. The shaded box in the upper panel denotes a time period with no data from the CN counter or AMS due to a local power failure and the shaded box in the lower panel marks where there is no gas data from the FTIR due to a lightning strike on 26 March.
3.2 Meteorology
The general meteorological conditions for the March, 2006 period have been discussed in detail by Fast et al. (2007). Figure 7 shows the daily averages of temperature, relative humidity (RH), and the local wind speed, measured with the weather station, for the three cases. The standard deviations about the mean are shown here every five hours as vertical bars and represent the natural variability.
The air from the E is generally much warmer and drier than from the SW and WNW and the wind speeds higher until about 14:00. The winds from the SW and WNW are calm with the notable period between 06:00 and 08:00 when winds from the WNW increased to almost 10 ms−1. This was not a common occurrence and was likely a result of down-slope flow since the RH also decreased from 60% to 40% during this same period.
The trends in temperature, humidity and winds are asso-ciated with the local temperature gradients, as discussed by Fast and Zhong (1998) and Whiteman et al. (2000). In the early morning the eastern slopes are heated as the sun rises and upslope flow is caused by the differential heating be-tween the slopes and the valley to the east. Turbulent mixing of the moister air from the valley and drier air aloft leads to a decrease in the humidity. Later in the morning the sun be-gins to heat the western slopes of the mountains and leads to a similar upslope flow from the west. Regardless of the larger scale flow, during the daytime when there is significant solar heating, there will always be an upslope component on both sides of the Altzomoni ridge (Fast and Zhong, 1998; White-man et al. , 2000) that will lead to a convergence zone in the
Fig. 7.The diurnal variations in the meteorological patterns of(a) temperature,(b)relative humidity, and(c)wind speed are shown for the three cases of air coming from the east (green), southwest (red) and west northwest (black). Each data point represents a fifteen minute average. Standard deviations about the means are plotted as vertical bars every five hours. There is missing data from 10:00 to 17:00 LST on the day of southwesterly winds due to a weather station malfunction.
region of the research site and a decrease in the local wind ve-locity, as seen most clearly in the winds from the E in Fig. 7c between 13:00 and 20:00.
3.3 Gas concentrations
Figure 8 shows the average diurnal concentrations of CO, O3
and SO2. During MILAGRO Shaw et al. (2008) analyzed the
development of the daytime mixing layer using radiosondes, sodar, lidar and a wind profiler. They found that the top of the mixed layer in the Mexico City region reached 4000 m, the approximate altitude of Altzomoni, between 11:00 and 12:00 and remained above this altitude until after 20:00. This time period is marked on Fig. 8 as a shaded box and we see that the CO (Fig. 8a) in air from the various directions begins to increase within this period, but the initial increase depends on the direction of flow. The CO in air from the WNW is the earliest to begin increasing in concentration, followed by air from the SW and E.
Fig. 8. These time series of(a)CO,(b)O3, and(c)SO2are for the same conditions as the data shown in Fig. 6. The shaded box shows the average time interval when the top of the boundary layer, measured at T1 (Shaw et al., 2008) was above 4000 m, the altitude of Altzomoni.
The only days when air was from the WNW in the after-noon and evening were those in the latter part of the month. Measurements of the gases from the FTIR system are not available for those days due to a lightning strike on the 26 of March during a thunderstorm that caused a power surge that subsequently damaged the system processor and that could not be repaired before the end of the project.
The differences in time when the RML arrives at Alt-zomoni, as indicated by increasing CO, is consistent with the distance between the research site from regional sources of anthropogenic emissions and the diurnal meteorology. Al-though the center of Mexico City is farther from Altzomoni than Puebla, the outskirts of the city extend to within less than ten kilometers from the base of the mountains. Hence, as upslope flow begins on the western side of the Cortez Pass, the RML will appear at Altzomoni sooner when winds are from the WNW than when they are from the E, as seen by the three hour difference in CO increase between the WNW and E cases. The CO from the SW begins to increase a little more than an hour after the CO from the WNW, primarily due to the air coming from the city of Cualtla, a population
center 10 km to the SW of Altzomoni that is not as large as Cuernavaca but is a significant source of anthropogenic emis-sions.
It should also be noted that the CO concentrations from the E and WNW remain above 0.1 ppm while the CO from the SW decreases to 0.08 ppm, a value that is close to back-ground levels of CO in the northern hemisphere. As a point of reference, the average, daily peak concentration of CO in Mexico City during this time period was 2.5 ppm (Fast et al., 2009), or approximately 10 times larger than the maxi-mum peak measured at Altzomoni when winds were from the WNW. The average concentration of CO measured at 700 mb from the C130 aircraft (Emmons et al., 2009) was between 0.12 and 0.16, or a little less than measured at the mountain site.
As the RML reaches the research site there is an initial increase in the measured concentration then a decrease as a result of dilution associated with increasing growth of the RML. Later in the afternoon the surface begins cooling, sta-bilizing the local mixed layer that begins to subside leaving a residual layer of CO aloft that is decoupled from the RML (Raga et al., 1999a). This layer descends more slowly than the RML and when it reaches the level of the research site, a secondary maximum is seen in the E and SW CO between 18:00 and 20:00.
Figure 8b illustrates daily variations of O3 where the
trends in concentrations are weakly correlated with those of CO. The minimum concentrations of O3in flow from the SW,
WNW and E are 0.04, 0.05 and 0.07, respectively. There is insufficient information to assess the maxima concentra-tion in O3 from the WNW; however, the maximum in O3
from the E was 0.04 ppm higher than from the SW. The O3
at Altzomoni has to be the result of photochemical produc-tion as the precursor gases are transported from their sources (Madronich, 2006). As was observed in comparisons be-tween Altzomoni and Mexico City, the CO at the research site was a factor of ten less due to dilution; however, the av-erage, maximum concentration of O3at Altzomoni was on
the order of 0.1 ppm, similar to maximum values measured in Mexico City during March, 2006 (Zavala et al., 2009).
The SO2shows a diurnal trend only in air from the east;
however, whereas the concentration in CO from the E began increasing at 13:00, the SO2is observed to begin increasing
at 11:00. In addition, the SO2 begins decreasing at 15:00
while CO does not start decreasing until 20:00. The lack of correlations in the trends of CO and SO2suggests that their
sources are not the same. Although the accuracy of the SO2
from the FTIR measurement is lower than for the other gases, as shown in Table 2, due to noise in the SO2infrared spectral
region, the trends are larger than the expected uncertainties. The likely source for the SO2 is the active volcano to the
south whose emissions have been characterized during the same time period by Grutter et al. (2008) and who found that the emissions were transported NE towards Puebla/Tlaxcala 63% of the time. This could help explain the enhancement
of the eastern component found in this study. The emissions can be carried down the slopes at night time as a result of the cooling of the mountainside (Raga et al., 1999b; Jimenez et al., 2004) where they can pool in the elevated plateau to the east of Altzomoni before being carried westward by the larger scale circulation. The rapid decrease in SO2from the
east in the afternoon occurs as the accumulated gas is flushed from where it was stored at night and the early morning.
The peroxyacetylnitrate (PAN) and peroxypropionylni-trate (PPN) concentrations (Fig. 9) are close to or below the detection limit until 11:00, regardless of the direction of flow. Data is unavailable for the period between 14:00 and 19:00 for days when winds were from the WNW. The concentra-tions of PAN and PPN from the E and SW are strongly cor-related with the CO concentrations and the primary and sec-ondary peaks occur at the same time as the CO. The PAN and PPN in the easterly flow are much larger than from the SW during the initial surge but the afternoon peaks are identical, within the expected uncertainties. For easterly flow the ra-tio of peak PPN to PAN is greater than 0.1, similar to rara-tios found in Mexico City by Gaffney (1999). The increase in the afternoon PAN and PPN in air from the SW is likely a result of local circulations in the Chalco Valley through which air flows from Mexico City to the SE (Doran and Zhang, 1998; Whitefield et al., 2000). This would be RML undergoing sec-ondary processing before arriving at the Altzomoni site later in the afternoon.
3.4 Particle number and mass concentrations
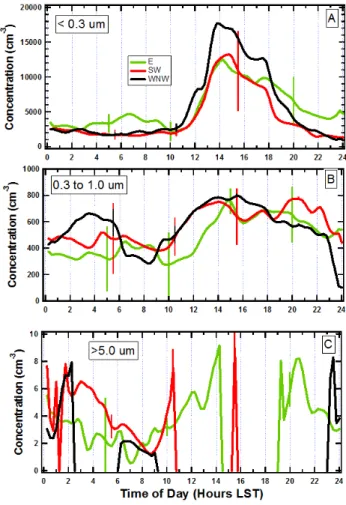
The daily trends in fine, accumulation and coarse mode particle number concentrations are plotted in Fig. 10, nor-malized to standard temperature and pressure (273.16◦C,
1013.25 mb) to facilitate easier comparison with measure-ments made at other altitudes and locations during MILA-GRO. The fine mode particle concentrations, those<0.3µm, have a much more distinct diurnal pattern than was seen in the trends of CO. The fine mode concentrations in air from the WNW again increase earlier than air from the SW or E, similar to the CO, but now the particles in air from the SW and E have nearly identical trends. Regardless of wind di-rection, the concentrations decrease much more rapidly and earlier in the afternoon than the concentrations of CO. This is likely a result of removal by dry deposition or growth of the fine particles to larger sizes by condensation or coagulation.
The accumulation mode particle concentrations (Fig. 10b) have trends that are more consistent with those of the CO concentrations, increasing at approximately the same time of day and remaining elevated until early evening. Fine mode particle concentrations are highly correlated with CO concentrations when both are measured near primary emis-sion sources, for example in Mexico City (Baumgardner et al., 2000); however, given the distance between the source of the primary particles and the measurement site, it is highly likely that both the fine mode and the accumulation
Fig. 9. These time series of (a) PAN and(b) PPN are for the same conditions as the data shown in Fig. 6. Between 00:00 and 11:00 LST the PAN and PPN are near or below the detection levels of the instrument.
mode concentrations are dominated by secondary processes (Volkamer et al., 2006). The lack of correlation between the fine mode concentrations and CO suggests new particle for-mation. There is a better correlation with CO concentrations in the accumulation mode as these are the older particles that were originally produced nearer the source of emissions and have grown by secondary processes.
The coarse mode particle concentrations, represented here as those larger than 5µm, are shown in Fig. 10c. They only appear when the winds are moderately strong, before and af-ter the period when the RML is above the measurement site, but are not present under low wind conditions. This suggests that they are locally generated, most likely coming from the top soil in the immediate area or from the unpaved access road 500 m to the east of the measurement site.
The aerosol chemical species concentrations and EBC, also normalized to standard temperature and pressure, are displayed in Fig. 11. The EBC is not a true measure of the black carbon (BC) mass because it is derived from the absorption coefficient measured with the PSAP by using a specific absorption coefficient, ωa, of 10 m2g−1 to
con-vert to BC mass. As discussed in detail by Bond and Bergstrom (2006), ωa can vary widely depending on the properties of the BC. The value used in the present study is taken from the literature as being the most commonly used with this instrument, but with the caveat that the numbers presented here have at least an uncertainty of±50%. In ad-dition, it has been shown in other studies (Lack et al., 2008;
Fig. 10. The diurnal variations in the concentrations of(a)fine mode,(b)accumulation mode and(c)coarse mode aerosol particles are shown for the same conditions as the data in Fig. 6. Note that all concentrations are normalized to standard temperature and pressure.
Cappa et al., 2008), that the presence of organic material on the filters of the PSAP can bias the derived measurements to-wards larger absorption values, even after taking into account the light scattering component.
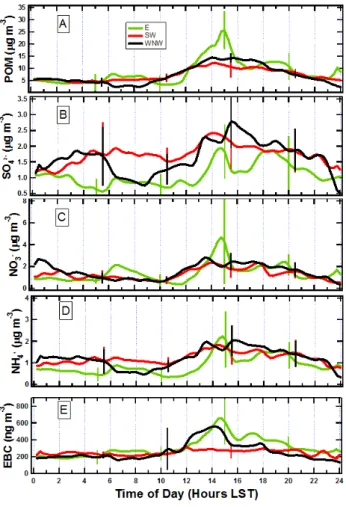
The mass concentration of POM, shown in Fig. 11a, is the largest in air coming from the east. The maximum mass concentration is 25µg m−3compared to 15µg m3from the WNW and 10µg m−3in air from the southwest. There is a relatively large amount of natural variability, as shown by the vertical standard deviation bars, and the expected uncertainty in all the mass concentrations are of order 14% (Table 2); however, the difference in maximum POM from the E and from the WNW is well above these uncertainties. Secondly, the POM from the E follows the trend in fine mode parti-cle concentrations compared to the POM from the WNW and SW that have diurnal patterns closer to those seen in the accumulation mode particles. This suggests that even though the POM, in general, is probably SOA (Volkamer et al., 2006) the particles from the E may be more newly formed and found in smaller particles. As a point of reference,
Fig. 11. These time series of masses(a)particle organic material, (b)sulfate,(c)nitrate,(d)ammonium and(e)effective black carbon (derived from the absorption measurements made with the PSAP), are for the same conditions and normalized to standard temperature and pressure as the data in Fig. 9.
comparing with POM measured at other locations during MI-LAGRO, a concentration of 4µg m−3 was measured from
the C-130 at an altitude of 4000 m, but above the RML east of Altzomoni ,and 16µg m−3when flying directly over
Mex-ico City and in the RML (DeCarlo et al., 2008).
The trends in the sulfate ion mass concentration, SO24−, seen in Fig. 11b, are generally larger when winds are from the SW and WNW and with patterns that are roughly those seen in the accumulation mode particles (Fig. 10b). Since sulfate is usually the result of secondary processes, and due to the large source region to the NW of Mexico City (Ta-ble 1), the higher sulfate from the WNW is as expected. DeCarlo et al. (2008) measured sulfate concentrations of 3.5µg m−3from the C-130 on 29 March, east of Altzomoni and at 4000 m. This was on a day when winds were east-erly at the site and maximum concentrations were 2µg m−3. On this same flight the researchers identified two layers of sulfate at 4300 and 5000 m with concentrations of about 12µg m−3and were possibly related to volcanic emissions.
The sulfate concentration directly over Mexico City was ap-proximately 2µg m−3(DeCarlo et al., 2008).
As shown in Fig. 11c , the mass concentrations of nitrate, NO−3, have trends when the site is in the RML that are sim-ilar to those in the POM concentrations. In particular, the nitrate in air from the E is a factor of two larger than that in the air from the WNW and SW, although there is a large amount of variance that suggests that this peak may be influ-enced by just one or two days. The measurements of nitrate over Mexico City (DeCarlo et al., 2008) show an average concentration of almost 6µg m−3, similar to the maximum of 5µg m−3measured at Altzomoni when winds were from the E.
The diurnal trends in the concentration of ammonium, NH+4, are nearly identical to those of the sulfate in the air from all directions. There is also a strong correlation be-tween ammonium and nitrate, as would be expected if most of the nitrate is coming from agricultural activities where ammonium nitrate is a commonly employed fertilizer. De-Carlo et al. (2008) measured average ammonium concentra-tions over Mexico City of approximately 2.5µg m−3, similar to the maximum measured at Altzomoni of 2µg m−3.
The EBC (Fig. 11e) in air from the WNW and E has trends similar to the concentrations of POM whereas in air from the SW the EBC concentrations are nearly constant. The EBC is primarily found in the fine mode particles whose diurnal trends in concentration it follows closely. The maximum concentrations of EBC in air from the E and WNW, of ap-proximately 600 ng m−3, are twice the EBC in the SW flow. The average, daily EBC in Mexico City during this time pe-riod was 9µg m−3 (Fast et al., 2009), a factor of ten larger
than found at Altzomoni. Both the CO and EBC had ratios of approximately ten to one when comparing Mexico City concentrations to those measured at Altzomoni. Given that combustion is the primary source of both species, this sug-gests that they originated from the same general area and were diluted at approximately the same rate; however, the EBC is observed to decrease in concentration earlier in the afternoon than the CO, suggesting that the EBC is being re-moved, possibly by coagulation or by secondary processes leading to growth into the accumulation mode.
As illustrated in Fig. 12, relative contributions of the ions and EBC depended on where the RML was in relation to the measurement site and the direction of the air flow. In this figure “night” and “afternoon” refer to the periods when the RML is below or above Altzomoni, respectively. Under all conditions the POM contributes the most to the total mass. The daytime flow from the east had the largest proportion of POM (75%), compared to 66% in flow from the SW and WNW, and also had the largest total aerosol mass concentra-tion. Air from the E always has a larger proportion of POM than air arriving from the SW or WNW. Particularly notice-able is the large change in total mass seen from night to day in air from the E, a factor of more than three.
μ
Fig. 12.The mass fraction of ions measured with the AMS and ef-fective black carbon (EBC) mass derived from the PSAP are shown for the days with flows from the east (left), southwest (center) and west (right) separated by night time (top panel) and the afternoon (bottom panel). The total mass concentration for each condition is displayed asµg m−3inside each chart.
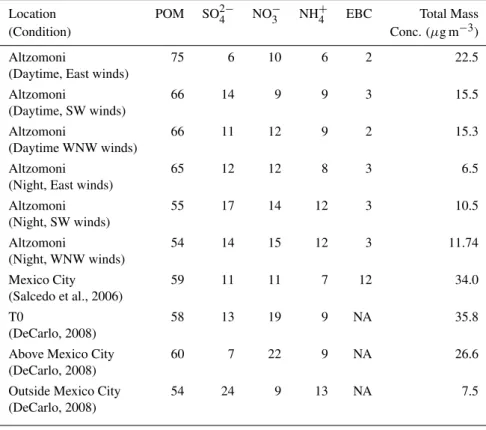
Table 3 compares these ion mass proportions with those derived from aircraft and ground based measurements made during this same period. In this table we see that the night time proportions at Altzomoni, and the daytime values when winds were from the WNW are similar to the measurements made at T0 during Milagro (DeCarlo, 2008) and at another site in Mexico City in 2003 (Salcedo, 2006) although the to-tal mass concentrations are less than half the city values. On the other hand, the proportion of POM at Altzomoni is some-what higher than any of the other locations. The daytime val-ues at Altzomoni when winds were from the E are notable for how much more the POM contributes to the total mass when compared to the other ground based and airborne measure-ments. As discussed below, the high concentration of POM at Altzomoni in air from the E, that contributes 75% to the to-tal mass, suggests that these particles are dominated by SOA whereas those at the measurement sites closer to the emission sources have a larger percentage of primary particles.
Measurements of POM and nitrate were normalized with CO to account for the effect of dilution as the RML grows. This isolates changes due to advection of air out of source regions from secondary processes like new particle for-mation or diffusional growth. The ratios ∗POM/∗CO and
∗
NO−3/∗CO were computed where the “*” designates val-ues of POM, CO and NO−3 after background values of 1.0µg m−3, 0.05 ppm and 0.01µg m−3, respectively, had been subtracted from them. These “background” values were derived from the average, daily minimum values measured for these three parameters. Figure 13 shows the average di-urnal variations in these ratios, stratified by air flow direction. The trends in the normalized POM and nitrate are
gener-
Fig. 13.The particle organic mass(a)and nitrate(b)were normal-ized by the CO to account for air mass dilution as shown in this figure.
ally different, depending on the direction of the air, although there are some similarities that may indicate the underlying sources of the POM and nitrates. The POM from the SW be-tween 06:00 and 10:00, and from the E and WNW bebe-tween 12:00 and 16:00 are clearly not directly associated with the primary particles because of the large increases that indicate changes not linked to the CO. Presumably these are SOA that have formed during transport of the RML, although the large increase in the∗POM/∗CO in the SW flow is prior to the ar-rival of the RML. This increase must be viewed with caution, however, since this is also a period when the measured CO decreased while the POM stayed constant and near the back-ground level.
The trends in the∗NO−3/∗CO ratios are very similar in air from the SW and E; both are bimodal with peaks at 07:00 and 14:00, although the ratio in air from the SW has an ad-ditional late afternoon peak at 17:00. A large fraction of the regions to the E and SW are agricultural and the morning peaks in this ratio may indicate transport of particles from these areas. Another source of nitrate may be biomass burn-ing not associated with local fires but comburn-ing from sources much farther upwind, e.g., Yokelson et al. (2007) noted an increase in the ratio of nitrate to CO in aged biomass smoke coming from the Yucatan Peninsula during the March, 2006 time period.
Kleinman et al. (2008) and DeCarlo et al. (2008) com-puted the∗POM/∗CO ratios from aircraft measurements and related them to the age of the particles or their distance from the source of emissions. Kleinman et al. reports 10 and 80µg m−3ppm−1 using measurements from the DOE
Table 3.Aerosol Particle Mass Concentration (µg m−3) Comparisons (% of Total). NA=Not available.
Location POM SO24− NO−3 NH+4 EBC Total Mass
(Condition) Conc. (µg m−3)
Altzomoni 75 6 10 6 2 22.5
(Daytime, East winds)
Altzomoni 66 14 9 9 3 15.5
(Daytime, SW winds)
Altzomoni 66 11 12 9 2 15.3
(Daytime WNW winds)
Altzomoni 65 12 12 8 3 6.5
(Night, East winds)
Altzomoni 55 17 14 12 3 10.5
(Night, SW winds)
Altzomoni 54 14 15 12 3 11.74
(Night, WNW winds)
Mexico City 59 11 11 7 12 34.0
(Salcedo et al., 2006)
T0 58 13 19 9 NA 35.8
(DeCarlo, 2008)
Above Mexico City 60 7 22 9 NA 26.6
(DeCarlo, 2008)
Outside Mexico City 54 24 9 13 NA 7.5
(DeCarlo, 2008)
G-1 and DeCarlo et al. derived values between 70 and 90µg m−3ppm−1. DeCarlo et al. also computed∗NO−3/∗CO ratios that varied between 5 and 25µg m−3ppm−1. The
range of ∗POM/∗CO and ∗NO−
3/
∗CO ratios at Altzomoni
is much larger than reported from the aircraft suggesting sources of POM and nitrate that are not linked to the CO. The
∗
POM/∗CO is expected to increase with age as the POM is enhanced by the production of SOA (Kleinman et al., 2008) and the∗NO−3/∗CO is expected to decrease due to evapora-tion of the nitrates (DeCarlo et al., 2008).
The underlying assumption in using the normalized ra-tios as indicators of particle age is that the POM and ni-trate precursors are from the same source as CO so that dilu-tion is compensated by CO normalizadilu-tion (Kleinman et al., 2008), an assumption that is possibly violated in the region of Altzomoni. At Altzomoni, the increases in the∗POM/∗CO when the RML is above the site can be attributed to the en-hancement of the POM by SOA but the large values of this ratio in the southwesterly flow between midnight and 08:00 are unlikely a result of SOA production. There are also other sources of POM, unrelated to CO, which could cause this enhancement, such as local biogenic emissions. It is also important to note that during this time period the concentra-tions of CO and POM were both very low so that the ratio is between one very small number divided by another small number.
The large increases of the∗NO−3/∗CO in the morning E and SW flows are likely the influence of fertilizer used up-wind in the agricultural areas, as mentioned previously, since the concentrations in nitrate and ammonium are observed to increase during this time period and the concentration of the accumulation mode particles are also enhanced. The ratios are seen to increase sharply since these particles are unre-lated to combustion sources, i.e. the CO stays constant as the nitrate concentration increases.
The organic functional group measurements by FTIR, shown in Fig. 14 and whose mass concentrations (all calcu-lated at STP) are listed in Table 4, were analyzed with respect to daytime (11:00–18:00), and night time (18:00–11:00) and stratified by wind direction. In the daytime, the concen-trations of the carboxylic acid, alkane, alcohol and amine groups were approximately 50% larger than at night, with the exception of particles coming from the WNW that had approximately the same mass concentration of carboxylic acids during the day and night. The alkanes were always the largest proportion of the organics analyzed, followed closely by the carboxylic acids. Both of these are indicators of fossil fuel combustion processes, and the carboxylic acid groups typically form as secondary organic aerosols (SOA) (Russell et al., 2009). The particles in air from the WNW had the largest fraction of alkanes and daytime air from the SW had more than twice the mass concentration of alcohols as air from the east and three times the concentration as particles
Table 4.Average organic functional group mass concentrations (STP) and standard deviation (ug/m3) (values in parentheses are uncertainty ranges).
Alcohol Alkane Amine Carboxylic acid
Day
E 1.05±0.51 (35–43%)
3.16±2.13 (28–39%)
0.81±0.48 (35–43%)
2.28±1.61 (12–67%)
W 0.8±0.05 (36–38%)
3.96±0.91 (36–38%)
0.91±0.06 (36–38%)
2.32±0.47 (36–38%) SW 2.69±1.62
(37–39%)
3.29±2.65 (37–39%)
1.08±0.34 (37–39%)
2.42±1.83 (37–39%)
Night
E 0.6±0.39 (31–37%)
1.71±1.35 (31–37%)
0.4±0.31 (31–37%)
1.21±1.05 (31–37%)
W 0.64±0.15 (36–37%)
2.92±0.1 (36–37%)
0.55±0.12 (36–37%)
2.08±0.19 (36–37%)
SW 0.73±0.14 (34–39%)
2.34±0.38 (34–39%)
0.54±0.18 (34–39%)
1.71±0.13 (34–39%)
in northwesterly air masses. Alcohols are associated with biomass burning and the larger concentrations may indicate that there were fires burning to the SW; however, since the alcohol was only elevated in the daytime, the source of the aerosols might be related to agricultural burn-off that the farmers often do prior to spring planting. A more detailed discussion of the FTIR organic measurements can be found in the companion papers by Gilardoni et al. (2009) and Liu et al. (2009).
3.5 Particle optical properties
The daily trends in the coefficients of absorption and scatter-ing and the sscatter-ingle scatterscatter-ing albedo (SSA) are displayed in Fig. 15. The absorption coefficient,Babs, matches the pattern
in EBC, previously described, since the EBC was derived di-rectly from it. The scattering coefficient,Bsct, is extremely
well correlated with the POM for all air flow directions. Mar-ley et al. (2009) measured aerosol optical properties at the T0 ground site during MIRAGE, located on the northern edge of Mexico City, and found daily maximum values of the scatter-ing and absorption coefficients of approximately 250 Mm−1 and 30 Mm−1, respectively, values that are five and ten times larger than the maxima measured at Altzomoni. Doran et al. (2007) measured the absorption coefficient at the T1 and T2 sites that are located just north and 35 km NNE of Mex-ico City, respectively. The average, maximum values ofBabs
at the two sites were approximately 20 and 4 Mm−1,
respec-tively. The T2 values are similar to those measured at Alt-zomoni whereas the T1 maxima are closer to the T0 values measured by Marley el al. (2009). Light absorption is domi-nated by BC so the ten to one ratio between Mexico City and Altzomoni is consistent with the similar ratios of CO and BC between the two locations. The smaller ratio in scatter-ing coefficient is due to competscatter-ing processes of dilution and
secondary production of SOA. The number concentration of particles produced in the source region will decrease as the mixed layer grows but the mass concentration increases with the formation of SOA as primary particles grow from the condensation of secondary organic gases (Volkamer et al., 2006).
The SSA at Altzomoni varied between 0.76 to 0.86 and had an average, when in the RML, of 0.82. The SSA at the T0 site ranged from 0.44 to 0.9, with an average of 0.77 (Mar-ley et al., 2009). This is consistent with the observed ratios between Mexico City and Altzomoni of the scattering and absorption coefficients whereby it is expected that the SSA will be higher given that the scattering coefficient is reduced less with respect to Mexico City than the absorption coeffi-cient.
4 Summary and conclusions
Measurements of gas and particle properties, made on the Altzomoni ridge located at an altitude of 4010 m in the Pass of Cortez between the volcanoes of Popocatepetl and Iz-tacc´ıhuatl in the central region of the Mexican Megapolis, have been evaluated with respect to the direction of flow and the diurnal fluctuations of the RML.
The original expectation, when initiating this project, was that gas and particle concentrations would be significantly higher when the research site was in the RML during the day than during the night and early morning when the ambient conditions would be more associated with free tropospheric air. This generally proved to be the case for concentrations of CO and SO2, as well as for aerosol particles. A notable
exception to this was the concentration of O3that did show
small, diurnal fluctuations but, on average, remained above 0.05 ppm, even under free tropospheric conditions.
μ
Fig. 14.The FTIR analysis of the components of organic carbon on filters taken at night (top panel) and during the day (bottom panel) are shown for the cases of flow from the east (left side), southwest (middle) and west northwest (right side). The total mass concentra-tion for each condiconcentra-tion is displayed asµg m−3inside each chart.
Another expectation was that the concentrations of gases and particles originating from the direction of Mexico City, i.e. in air from the WNW, would be significantly higher than air from the E (Puebla) or SW (Cuernavaca). This was in-deed the case for fine particles, those with diameter less than 0.3µm, but not significantly, i.e. the average maximum con-centration from the WNW was 18×103cm−3 compared to 13×103cm−3 from the SW and E. On the other hand, the concentrations of CO from the WNW and E were similar and the O3was on average 0.02 ppm higher in air arriving from
E than from the SW or WNW. The PAN and PPN from the E were three times higher than from the WNW and SW and the average peak POM was almost twice as high.
Comparisons of the particle trends with those of CO, in relationship to the direction of flow, lead to the conclusion that the majority of the particle mass, in POM and sulfate, derives from secondary processes, as proposed by Volkamer et al. (2006). In comparison with measurements made at other locations during the same time period, but closer to the primary emissions, the POM at the mountain site represents 75% of the total mass, while in the RML, compared to less than 60% measured in Mexico City at a ground site or from aircraft measurements in the RML over the city.
The inventory of emissions for Mexico’s Megapolis show that the MCMA produces 60–70% of the NOx, VOCs and
CO and 30% of the PM2.5 in this region; hence, it was
expected that the concentrations of the gases and particles would have been much higher at Altzomoni when the flow was from the WNW than from the E or SW. There are a num-ber of possible reasons why this was not the case. One is that when air comes from the WNW, and the mixed layer grows,
Fig. 15. The optical properties shown here and derived from the nephelometer and PSAP, are(a)absorption coefficient,(b) scatter-ing coefficient, and(c)single scattering albedo, for the same condi-tions as the data shown in Fig. 9.
some fraction will be ventilated through the Chalco valley to the SE (Fast and Zhong, 1998). This will dilute the con-centrations more rapidly than when air is flowing from the east bringing emissions from the Puebla valley that produces 11–16% of the NOx, VOCs and CO and 30% of the PM2.5
in the Megapolis and that are less diluted as they are forced up the eastern slope of the mountain range. Secondly, we cannot rule out the possibility that air may sometimes be re-circulated, i.e. pollution from Mexico City may first be trans-ported NE before returning via the Puebla Valley. This effect is presently being investigated with a more detailed analysis with the WRF-Chem model. A third possibility is that the gases and particles that are sampled during the day are al-ways some mixture of air from both the east and the west due to the temperature gradients on both eastern and western slopes of the mountain that lead to upslope flow from both di-rections. The relative proportion of gases and particles from both directions will depend on the strength of the larger scale circulations and cannot be determined unambiguously from
the measurements themselves but will require further studies using numerical simulations of the dynamics and chemistry.
Acknowledgements. The authors would like to thank the national park of Izta-Popo-Zoquiapan and its personnel for supporting the research at the Altzomoni measurement site and for assisting us in maintaining the equipment during the project. We would like to thank Armando Retama, director of the Red Autom´atica de Monitoreo Atmosf´erico (RAMA) for providing the RAMA mobile van during the preliminary measurements in November 2005 and the measurements from RAMA in the city during March, 2006. We are grateful to TSI Inc, Mexico, for the loan of the Scanning Mobility Particle Sizer (SMPS) that was used during the project. This project was partially supported by PAPIIT grants #IN-117403 and IN-113306. FTIR and AMS measurements at Altzomoni were supported by a grant from the James S. McDonnell Foundation.
Edited by: L. Molina
References
Barth, M. and Church, A: Regional and global distributions and life-times of sulfate aerosols from Mexico City and southeast China, J. Geophys. Res., 104(D23), 30231–30239, 1999.
Baumgardner, D., Raga, G. B, Kok, G., Ogren, J., Rosas,I., Baez, A., and Novakov, T.: On the Evolution of Aerosol Properties at a Mountain Site Above Mexico City, J. Geophys. Res., 105, 22243–22253, 2000.
Bond, T. C., Anderson, T. L., and Cambell, D.: Calibration and intercomparison of filter-based measurements of visible light ab-sorption by aerosols, Aerosol Sci. Tech., 30, 582–600, 1999. Bond, T. C. and Bergstrom, R. W.: Light absorption by
carbona-ceous particles: An investigative review, Aerosol Sci. Tech., 40, 27–67, 2006.
Bravo, A., Sosa, E., Sanchez, A., Jaimes, P., and Saavedra, R.: Im-pact of wildfires on the air quality of Mexico City, 1992–1999: Environ. Pollut., 117, 243–253, 2002.
Canagaratna, M. R., Jayne, J. T., Jimenez, J. L. , Allan, J. D. , Al-farra, M. R., Zhang, Q., Onasch, T. B.,Drewnick, F., Coe, H. , Middlebrook, A. , Delia, A., Williams, L. R., Trimborn, A. M., Northway, M. J., DeCarlo, P. F., Kolb, C. E., Davidovits, P., and Worsnop, D. R.: Chemical and Microphysical Charac-terization of Ambient Aerosols with the Aerodyne Aerosol Mass Spectrometer, Mass Spectrom. Rev., 26, 185–222, 2007. Cappa, C. D., Lack, D. A., Burkholder, J. B., and Ravishankara,
A. R.: Bias in filter-based aerosol light absorption measurements due to organic aerosol loading: Evidence from laboratory mea-surements, Aerosol Sci. Tech., 42, 1022–1032, 2008.
Cross, E. S., Slowik, J. G., Davidovits, P., Allan, J. D., Worsnop, D. R., Jayne, J. T., Lewis, D. K., Canagaratna, M., and Onasch, T. B.: Laboratory and Ambient Particle Density Determinations Using Light Scattering in Conjunction with Aerosol Mass Spec-trometry, Aerosol Sci. Tech., 41, 343–359, 2007.
Crounse, J. D., DeCarlo, P. F., Blake, D. R., Emmons, L. K., Cam-pos, T. L., Apel, E. C., Clarke, A. D., Weinheimer, A. J., Mc-Cabe, D. C., Yokelson, R. J., Jimenez, J. L., and Wennberg, P. O.: Biomass burning and urban air pollution over the
Cen-tral Mexican Plateau, Atmos. Chem. Phys., 9, 4929–4944, 2009, http://www.atmos-chem-phys.net/9/4929/2009/.
DeCarlo, P. F., Dunlea, E. J., Kimmel, J. R., Aiken, A. C., Sueper, D., Crounse, J., Wennberg, P. O., Emmons, L., Shi-nozuka, Y., Clarke, A., Zhou, J., Tomlinson, J., Collins, D. R., Knapp, D., Weinheimer, A. J., Montzka, D. D., Campos, T., and Jimenez, J. L.: Fast airborne aerosol size and chemistry measure-ments above Mexico City and Central Mexico during the MI-LAGRO campaign, Atmos. Chem. Phys., 8, 4027–4048, 2008, http://www.atmos-chem-phys.net/8/4027/2008/.
Doran, J. C., Barnard, J. C., Arnott, W. P., Cary, R., Coulter, R., Fast, J. D., Kassianov, E. I., Kleinman, L., Laulainen, N. S., Martin, T., Paredes-Miranda, G., Pekour, M. S., Shaw, W. J., Smith, D. F., Springston, S. R., and Yu, X.-Y.: The T1-T2 study: evolution of aerosol properties downwind of Mexico City, Atmos. Chem. Phys., 7, 1585–1598, 2007, http://www.atmos-chem-phys.net/7/1585/2007/.
Edgerton, S. A., Arriaga, J. L., Archuleta, J., Bian, X., Bossert, J. E., Chow, J. C., Coulter, R. L., Doran, J. C., Doskey, P. V., Elliot, S., Fast, J. D., Gaffney, J. S., Guzman, F., Hubbe, J. M., Lee, J. T., Malone, E. L., Marley, N. A., McNair, L. A., Neff, W., Ortiz, E., Petty, R., Ruiz, M., Shaw, W. J., Sosa, G., Vega, E., Watson, J. G., Whiteman, C. D., and Zhong, S: Particulate air pollution in Mexico City: A collaborative research project, J. Air Waste Manage. Assoc., 49, 1221–1229, 1999.
Fast, J. D. and Zhong, S. Y.: Meteorological factors associated with inhomogeneous ozone concentrations within the Mexico City basin, J. Geophys. Res., 103, 18927–18946, 1998.
Emmons, L. K., Edwards, D. P., Deeter, M. N., Gille, J. C., Campos, T., N´ed´elec, P., Novelli, P., and Sachse, G.: Mea-surements of Pollution In The Troposphere (MOPITT) valida-tion through 2006, Atmos. Chem. Phys., 9, 1795–1803, 2009, http://www.atmos-chem-phys.net/9/1795/2009/.
Fast, J. D., de Foy, B., Acevedo Rosas, F., Caetano, E., Carmichael, G., Emmons, L., McKenna, D., Mena, M., Skamarock, W., Tie, X., Coulter, R. L., Barnard, J. C., Wiedinmyer, C., and Madronich, S.: A meteorological overview of the MILAGRO field campaigns, Atmos. Chem. Phys., 7, 2233–2257, 2007, http://www.atmos-chem-phys.net/7/2233/2007/.
Fast, J. D., Aiken, A. C., Allan, J., Alexander, L., Campos, T., Cana-garatna, M. R., Chapman, E., DeCarlo, P. F., de Foy, B., Gaffney, J., de Gouw, J., Doran, J. C., Emmons, L., Hodzic, A., Hern-don, S. C., Huey, G., Jayne, J. T., Jimenez, J. L., Kleinman, L., Kuster, W., Marley, N., Russell, L., Ochoa, C., Onasch, T. B., Pekour, M., Song, C., Ulbrich, I. M., Warneke, C., Welsh-Bon, D., Wiedinmyer, C., Worsnop, D. R., Yu, X.-Y., and Zaveri, R.: Evaluating simulated primary anthropogenic and biomass burning organic aerosols during MILAGRO: implications for as-sessing treatments of secondary organic aerosols, Atmos. Chem. Phys. Discuss., 9, 4805–4871, 2009, http://www.atmos-chem-phys-discuss.net/9/4805/2009/.
Gaffney, J. S., Marley, N. A., Cunningham, M. M., and Doskey, P. V.: Measurements of peroxyacyl nitrates (PANS) in Mexico City: implications for megacity air quality impacts on regional scales, Atmos. Environ., 33, 5003–5012, 1999.
Gilardoni, S., Russell, L. M., Sorooshian, A., Flagan, R. C., Se-infeld, J. H., Bates, T. S., Quinn, P. K., Allan, J. D., Williams, B., Goldstein, A. H., Onasch, T. B., and Worsnop, D. R.: Re-gional variation of organic functional groups in aerosol
cles on four U.S. east coast platforms during the International Consortium for Atmospheric Research on Transport and Trans-formation 2004 campaign, J. Geophys. Res., 112, D10S27, doi:10.1029/2006JD007737, 2007.
Gilardoni, S., Liu, S., Takahama, S., Russell, L. M., Allan, J. D., Steinbrecher, R., Jimenez, J. L., De Carlo, P. F., Dunlea, E. J., and Baumgardner, D.: Characterization of organic ambi-ent aerosol during MIRAGE 2006 on three platforms, Atmos. Chem. Phys., 9, 5417–5432, 2009, http://www.atmos-chem-phys.net/9/5417/2009/.
Gottmann, J.: Megalopolis: The Urbanized Northeastern Seaboard of the United States, New York, The Twentieth Century Fund, 1961.
Grutter, M., Basaldud, R., Rivera, C., Harig, R., Junkerman, W., Caetano, E., and Delgado-Granados, H.: SO2 emis-sions from Popocatpetl volcano: emission rates and plume imaging using optical remote sensing techniques, Atmos. Chem. Phys., 8, 6655–6663, 2008, http://www.atmos-chem-phys.net/8/6655/2008/.
Jim´enez, J. C., Raga, G., Baumgardner, D., Castro, T.,.Rosas, I., Baez, A., and Morton, O.: On the composition of airborne parti-cles influenced by emissions of the volcano Popocatepetl in Mex-ico, Natural Hazards, 1, 21–37, 2004.
Kleinman, L. I., Springston, S. R., Daum, P. H., Lee, Y.-N., Nun-nermacker, L. J., Senum, G. I., Wang, J., Weinstein-Lloyd, J., Alexander, M. L., Hubbe, J., Ortega, J., Canagaratna, M. R., and Jayne, J.: The time evolution of aerosol composition over the Mexico City plateau, Atmos. Chem. Phys., 8, 1559–1575, 2008, http://www.atmos-chem-phys.net/8/1559/2008/.
Lack, D. A., Cappa, C. D., Covert, D. S., Baynard, T., et al.: Bias in filter-based aerosol light absorption measurements due to organic aerosol loading: Evidence from ambient measurements, Aerosol Sci Tech., 42, 1033–1041, 2008.
Liu, S., Takahama, S., Russell, L. M., Gilardoni, S., and Baumgard-ner, D.: Oxygenated organic functional groups and their sources in single and submicron organic particles in MILAGRO 2006 campaign, Atmos. Chem. Phys. Discuss., 9, 4567–4607, 2009, http://www.atmos-chem-phys-discuss.net/9/4567/2009/. Madronich, S.: Chemical evolution of gaseous air pollutants
down-wind of tropical megacities: Mexico City case study, Atmos. En-viron., 40, 6012–6018, 2006.
Maria, S. F., Russell, L. M., Turpin, B. J., and Porcja, R. J.: FTIR measurements of functional groups and organic mass in aerosol samples over the Caribbean, Atmos. Environ., 36, 5815–5196, 2002.
Maria, S. F., Russell, L. M., Turpin, B. J., Porcja, R. J., Cam-pos, T. L., Weber, R. J., and Huebert, B. J.: Source signatures of carbon monoxide and organic functional groups in Asian Pa-cific Regional Aerosol Characterization Experiment (ACE-Asia) submicron aerosol types, J. Geophys. Res., 108(D23), 4022, doi:10.1029/2003JD003703, 2003.
Marley, N. A., Gaffney, J. S., Castro, T., Salcido, A., and Fred-erick, J.: Measurements of aerosol absorption and scattering in the Mexico City Metropolitan Area during the MILAGRO field campaign: a comparison of results from the T0 and T1 sites, At-mos. Chem. Phys., 9, 189–206, 2009, http://www.atmos-chem-phys.net/9/189/2009/.
Molina, L. T., Kolb, C. E., de Foy, B., Lamb, B. K., Brune, W. H., Jimenez, J. L., Ramos-Villegas, R., Sarmiento, J.,
Paramo-Figueroa, V. H., Cardenas, B., Gutierrez-Avedoy, V., and Molina, M. J.: Air quality in North America’s most pop-ulous city overview of the MCMA-2003 campaign, Atmos. Chem. Phys., 7, 2447–2473, 2007, http://www.atmos-chem-phys.net/7/2447/2007/.
Molina, L.T., Madronich, S., Gaffney, J., et al.: An overview of the MILAGRO 2006 Campaign: Mexico City emissions and its transport and transformation, Atmos. Chem. Phys. Discuss., sub-mitted, 2009.
Nickerson, E., McCaslin, C. P., Sandoval, E., Paramo, V. H., and Gonzalez, E.: Aircraft observations of ozone, carbon monoxide and NOxover Mexico City during project AGUILA, in: Air Pol-lution I, edited by: Zanneti, P., Brebia, C. P., Garcia Gardea, J. E., and Ayala Milian, G., Computational Mechanics Publica-tions, Southampton, 1993.
Perez Vidal, H. and Raga, G. B.: On the vertical distribution of pollutants in Mexico City, Atm´osfera, 11, 95–08, 1998. PROAIRE-Programa para mejorar la calidad de aire de la Zona
Metropolitana del Valle de Mexico 2002–2010, published by the City of government of Mexico, online available at: http: //www.sma.df.gob.mx/, 2008.
Raga, G., Baumgardner, D., Kok, G. L., and Rosas, I.: Some aspects of boundary layer evolution in Mexico City, Atmos. Environ., 33, 5013–5021, 1999a
Raga, G. B., Baumgardner, D., Kok, G. L., Baez, A., and Rosas, I.: Evidence for volcanic influence on Mexico City aerosols, Geo-phys. Res. Lett., 26, 1149–1152, 1999b.
Rivera, C., Sosa, G., W¨ohrnschimmel, H., de Foy, B., Johans-son, M., and Galle, B.: Tula industrial complex (Mexico) emissions of SO2 and NO2 during the MCMA 2006 field campaign using a Mini-DOAS system, Atmos. Chem. Phys. Discuss., 9, 5153–5176, 2009, http://www.atmos-chem-phys-discuss.net/9/5153/2009/.
Salcedo, D., Onasch, T. B., Dzepina, K., Canagaratna, M. R., Zhang, Q., Huffman, J. A., DeCarlo, P. F., Jayne, J. T., Mor-timer, P., Worsnop, D. R., Kolb, C. E., Johnson, K. S., Zuberi, B., Marr, L. C., Volkamer, R., Molina, L. T., Molina, M. J., Car-denas, B., Bernab´e, R. M., M´arquez, C., Gaffney, J. S., Marley, N. A., Laskin, A., Shutthanandan, V., Xie, Y., Brune, W., Lesher, R., Shirley, T., and Jimenez, J. L.: Characterization of ambient aerosols in Mexico City during the MCMA-2003 campaign with Aerosol Mass Spectrometry: results from the CENICA Super-site, Atmos. Chem. Phys., 6, 925–946, 2006, http://www.atmos-chem-phys.net/6/925/2006/.
Shaw, W. J., Pekour, M. S., Coulter, R. L., Martin, T. J., and Walters, J. T.: The daytime mixing layer observed by ra-diosonde, profiler, and lidar during MILAGRO, Atmos. Chem. Phys. Discuss., 7, 15025–15065, 2007, http://www.atmos-chem-phys-discuss.net/7/15025/2007/.
Volkamer, R., Jimenex, J. L., San Martini, F., Dzepina, K., Zhang, Q., Salcedo, D., Molina, L. T., Worsnop, D. R., and Molina, M. J.: Secondary organic aerosol formation from anthropogenic air pollution: Rapid and higher than expected, Geophys. Res. Lett., 33, L17811, doi:10.1029/2006GL026899, 2006.
Whiteman, C. D., Zhong, S., Bian, X., Fast, J. D., and Doran, J. C.: Boundary layer evolution and regional-scale diurnal circulations over the Mexico Basin and Mexican Plateau, J. Geophys. Res., 105, 10081–10102, 2000.
Yokelson, R. J., Urbanski, S. P., Atlas, E. L., Toohey, D. W., Al-varado, E. C., Crounse, J. D., Wennberg, P. O., Fisher, M. E., Wold, C. E., Campos, T. L., Adachi, K., Buseck, P. R., and Hao, W. M.: Emissions from forest fires near Mexico City, Atmos. Chem. Phys., 7, 5569–5584, 2007, http://www.atmos-chem-phys.net/7/5569/2007/.
Zavala, M., Herndon, S. C., Wood, E. C., Onasch, T. B., Knighton, W. B., Kolb, C. E., and Molina, L. T.: Evaluation of mobile emissions contributions to Mexico City’s emissions inventory using on-road and cross-road emission measurements and am-bient data, Atmos. Chem. Phys. Discuss., 9, 6363–6395, 2009, http://www.atmos-chem-phys-discuss.net/9/6363/2009/.