SPATIAL ELECTRIC LOAD FORECASTING USING AN EVOLUTIONARY
HEURISTIC
E. M. Carreno
∗A. Padilha-Feltrin
∗A. G. Leal
†∗Faculdade de Engenharia de Ilha Solteira, UNESP - Univ Estadual Paulista,
Departamento de Engenharia Elétrica CP 31 CEP 15385-000 - Ilha Solteira SP
†ELUCID SOLUTIONS S/A
Av Angélica, 2318 Mezanino CEP 01228-904 São Paulo SP
ABSTRACT
A method for spatial electric load forecasting using elements from evolutionary algorithms is presented. The method uses concepts from knowledge extraction algorithms and linguis-tic rules’ representation to characterize the preferences for land use into a spatial database. The future land use pref-erences in undeveloped zones in the electrical utility ser-vice area are determined using an evolutionary heuristic, which considers a stochastic behavior by crossing over sim-ilar rules. The method considers development of new zones and also redevelopment of existing ones. The results are pre-sented in future preference maps. The tests in a real system from a midsized city show a high rate of success when re-sults are compared with information gathered from the util-ity planning department. The most important features of this method are the need for few data and the simplicity of the algorithm, allowing for future scalability.
KEYWORDS: Spatial electric load forecasting, land use, knowledge extraction, distribution planning.
Artigo submetido em 10/07/2009 (Id.: 01014) Revisado em 18/11/2009, 10/04/2010
Aceito sob recomendação do Editor Associado Prof. Ivan Nunes Da Silva
1
INTRODUCTION
During the last few decades, the growth of emerging economies, such as some countries in South America and Asia, has enabled their populations to improve living stan-dards; this phenomenon means that every year more inhabi-tants of these countries look for new homes. This, in tandem with increasing migration from countryside to cities (espe-cially in Asian cities), has created a high level of city ex-pansion. Distribution utilities are currently facing new chal-lenges when planning a network expansion that offers a reli-able and economical service inside their service zone.
This situation is more difficult for decentralized electric mar-ket structures, where distribution utilities should now deal with profitable operations while considering aging electrical structures owing to the lack of investments during the cen-tralized era.
distribu-tion area has increased substantially to address these growing problems.
To improve the distribution network expansion and planning by considering these factors, distribution utilities should con-sider spatial electric load forecasting as business priority. In the particular case of Brazil, a new regulatory law for Electrical Distribution Utilities, called PRODIST, imposes the use of Spatial Electric Load Forecasting in their studies (ANEEL, 2008).
Spatial electric load forecasting is a process that tries to de-termine the future load growth for an electric energy distribu-tion utility (Lee, 2002). This process, apart from answering the question of how much load growth is expected in a deter-mined time frame, also identifies the locations that are most likely to receive the new loads.
Electric load growth inside the service area of an electric util-ity can be expected for two reasons: first, natural growth because of the natural behavior of existing consumers; and second, new loads because of new consumers. The natural behavior of existing consumers is stationary, with low ex-pected growth; thus, the main reason for load growth is the new consumers inside and outside the actual service zone.
Therefore, the location of these new consumers is of vital importance for the utilities so that they can adopt all the nec-essary resources for meeting the needs of the future system. Such information can be used to reinforce substations, elec-tric structures, system reconfiguration, and allocation of new substations, among several other activities.
Most of these new consumers will be located outside the ser-vice area, continuing the natural growth of the cities, but oth-ers will be located inside the service area in zones that are redeveloped. The redevelopment process considers changing the use of some part of the land, generally to accommodate more loads. For example, a zone with horizontal housing could be transformed into a zone with vertical housing, or a residential area could be transformed into a commercial area (Mo-Yuen, Hahn, 1996).
Strategic redevelopment is carried out because of major ur-ban projects looking to improve certain areas of the cities; generally, this kind of redevelopment is planned politically, making it very difficult to forecast. One of the options is using scenario simulations.
Another kind of redevelopment is the growth of the urban core. The urban core acts as an activity center for the entire city, concentrating a large quantity of commercial and resi-dential loads into a relatively small subzone, with financial and cultural offers that attract the rest of the city inhabitants for business or leisure. Because of the concentration of loads,
this zone is also the one with higher energy consumption. The growth of the city demands growth of the urban core and its surroundings. The urban core can grow both horizontally and vertically.
This paper deals with a new method for spatial electric load forecasting, by considering new developed zones and rede-velopment of the existing ones, using concepts of knowledge extraction algorithms, and elements from evolutionary algo-rithms, with special emphasis on developing a simple but powerful method with a reasonable use of available data, and taking into account the stochastic nature of new consumers.
2
OVERVIEW ON SPATIAL LOAD
FORE-CASTING
In specialized literature, spatial electric load forecasting dis-cussion can be traced back to Van Wormer (1954), where the need for a more detailed load forecasting considering the shape of the cities was evidenced. Several works were devel-oped inside electrical utilities, and different techniques were used considering different factors. Most of these works are compiled in (Lee, 2002), which is one of the fundamental sources of information in this area.
The first techniques used pattern recognition to determine preference maps (Lee, Anstos, 1979), where different fac-tors are weighted to determine a specific land use type. This process was later improved using elements from fuzzy logic (Miranda, Monteiro, 2000). Different approaches in fuzzy logic have been developed for this problem, like fuzzy mul-tiobjective decision-making (Chowet alii, 1998), cloud the-ory (Yanget alii, 2006), ] and recently, statistical approaches (Vazquezet alii, 2008).
Later years have not shown special advances in spatial elec-trical load forecasting; hence, it is necessary to take advan-tage of new advances in algorithms to develop new method-ologies especially suited to the reality of new cities in emerg-ing countries, consideremerg-ing the requirements of new users and comply with new regulations in the sector.
The spatial electric load forecasting process begins with the data recollection from different sources; these data go from different maps of the utility service area with different in-formation such as land use classification; geographical land-scape; socioeconomic distribution; electric structure inven-tory; historical peak load in different strategic points, like substations and feeders. This information is complemented with that from the different entities entrusted by city planning and information from the utility planning department.
data; hence, the method presented in this work considers that the utilities have access to basic information, like the com-mercial consumer database and an inventory of all the elec-trical structures in the system. All these data are organized in a multidimensional database that allows extracting infor-mation related to specific zones according to the needs of the chosen method.
After identifying the load growth using conventional meth-ods (Alfares, Nazeeruddin, 2002), the new load is allocated into the service area using the geographical and socioeco-nomic information from the spatial database. This is one of the most difficult steps in the process because of the stochas-tic nature of the urban development.
This paper presents an extension of an earlier work (Carreno, Padilha, 2008) by considering new developed zones and re-development of the existing ones. The use of concepts of knowledge extraction algorithms and elements from evolu-tionary algorithms is proposed.
A large database of classification rules obtained automati-cally by extracting the knowledge available in the spatial database of the city is used to identify user preferences for land use considering elements such as distance to nearby fa-cilities, major roads, and electrical load density.
The redevelopment of the urban core is modeled by consid-ering spatial information from the city’s growth as well as user preferences about land use. This proposal models the urban core growth using the database of classification rules to analyze the preferences and dynamics of the urban core related with urban growth, and this information is used to create a preference map for urban core growth. The data, in conjunction with the residential and commercial preference maps, would generate a forecast to determine how the urban core will evolve.
The crossreference of the map’s information is made through a stochastic evolutionary heuristic that creates new classifica-tion rules using the patterns already recognized in the spatial database.
The method is presented and tested with data from a real mid-sized city. The results present the preference and forecast maps of the study zone. The validation process of the results is made by comparing the results with the ones obtained in the utility planning department using the known procedure of manual simulation from Lee (2002).
3
SPATIAL DATABASE
The availability of data is the most important factor in any methodologies dealing with land use determination in spatial electric load forecasting.
The commercial consumer database available at most dis-tribution utilities identifies all the consumers by name, ad-dress, class, consumer code, and historical energy consump-tion. This information can be crossreferenced with the tech-nical databases using the consumer code, which should be the same in both databases. With both databases, it is pos-sible to allocate energy consumption spatially in the service area.
In case the utility does not have historical records about peak load in substations, a method using statistical daily load pro-files can be used to estimate this value from the energy read-ings in the commercial database (Jardiniet alii, 2000).
For the pilot application of this method, a database was built using information including the geographical distribution of all the electric structures inside the service area; utility com-mercial database of all the consumers with energy consump-tion from the past years; statistically obtained load curves for all types of consumers in different consumption levels; and a land use classification map of the zone.
This information was crossreferenced, and a multidimen-sional spatial database was created. This database allows visualizing specific data such as load growth for specific ar-eas, substations, feeders, transformers, utilization factors, in-stalled kVA, spatial load density, and other valuable informa-tion.
The spatial resolution adopted was 0.5 km2to take advantage
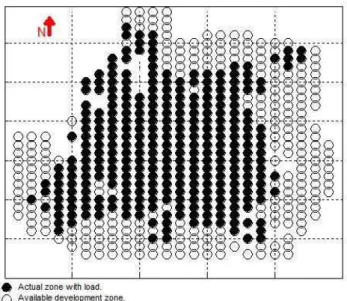
of the information available, but smaller resolutions are avail-able on demand. Figure 1 presents the map of the service area with a total extension of 180 km2.Each circle represents
one subarea of 0.5 km2. Black circles represent currently
occupied areas and white circles represent unoccupied areas in zones with the possibility of being occupied. The zones without circles represent the areas without the possibility of development for different reasons.
From the commercial database, it is possible to identify the location of the different structures of interest such as schools, hospitals, and commercial zones, among others. The ma-jor roads and zones without potential can be identified from aerial maps, and other information is obtained from the util-ity planning department, like activutil-ity centers, and special ur-ban interest zones, to name a few.
The information used in this work is readily available in most of the electric utilities around the world, allowing fast imple-mentation.
4
CLASSIFICATION RULES
Figure 1: Service area map, aerial view.
industry cannot be allocated near residential zones; residen-tial consumers like to live near other residenresiden-tial zones, but not too far away from commercial zones and not too dis-tant from their workplaces and so on. These preferences are sensitive to location and culture; hence, they are specific for each city. If static rules were adopted, it will be necessary to change them for each study. Some of these new consumers will be allocated in already populated zones having further growth opportunities, while others will be allocated in new zones that will be populated in the midterm with new infras-tructure.
The local authorities have made a series of studies related with the city growth; unfortunately, this information is not reliable because of its political dependence. Hence, future growth studies should use this information only as an indica-tor, not as a rule.
One of the tools used to decide which new zones will be pop-ulated in the mid- and long-term in the service area was the classification rules, discussed first in (Chowet alii, 1998), and broadly used in different algorithms since then. In (Mi-randa, Monteiro, 2000), classification rules were introduced to this problem to determine a land use score; these rules can be expressed as:
(IFObject(1) ISAttribute) AND (IFObject(2) ISAttribute) AND . . . . THEN (LandScoreISAttribute)
Here,Objectrefers to a set of elements of interest to be con-sidered in the process, like structures (schools, roads, high-ways, activity center), nearby zones, or other elements of in-terest.
Attributerefers to the measure of the relations between the different zones and the elements. If one element isdistance to a road, the rules are expressed bynear,close,away, far-away. For an element ofresidential electrical density, the rules are expressed inlow,normal, andhigh. EachAttribute corresponds to a finite and exclusive set in the domain of the correspondingobject.For example: All the distances from 0 km to 1km inclusive to a school is considered near; All the distances between 1.01 km to 5 km inclusive are considered as medium; and so on. The range of values for each attribute are selected based on an statistical analyses of all the data for each object.
For each object, customers have different preferences, and that is why a different set ofattributesexist for each one, for example, theattribute neardoes not have the same meaning for a school or for the activity center of the city.
5
CODING
OF
THE CLASSIFICATION
RULES
To extract and use the knowledge from the spatial database, it is necessary to set up an acceptable coding to efficiently store the information gathered during the process.
The classification rules (Input and Output) are coded as a vector, where each position represents an element of interest, and the value stored represents a linguistic expression suit-ing to the specific object. All the elements are related with the AND operator. Thus, a vector containing linguistic ex-pressions for a set ofobjectsrepresents a rule. For example, using the values {L N H} to represent three different linguis-tic references asLow (L), Normal (N),andHigh (H)for each of theobjectsconsidered in the classification rule, the rule is:
INPUT (IFDistancetoobject1isL, ANDDistance to ob-ject 2 isN, . . . , AND Residential load densityisH)then OUTPUT (Residential loadisH, ANDCommercial loadis
N, ANDIndustrial loadisL). This rule can be represented as (L, N, . . . , H) => (H, N, L), which can be written as the vector [L N . . . H][HN L].
For this particular application, the Input objects were chosen as distance between the subarea and interest points, and load densities; the load densities are calculated in 3×3 and 5×5 subareas around the subarea in study, and the output objects are loads for consumer class.
6
KNOWLEDGE EXTRACTION
To characterize the service territory, it is necessary to find out the classification rules that will allow us to settle the future land use preferences.
These rules and the defining sets could be determined man-ually by the planner using rules supported by common sense and practice, however, these rules could work well for one specific city based on the expertise and the knowledge of the planner. The differences between cities around the world demonstrate the need to settle a different set of rules for each one. The method in this paper presents a systematic way to extract a set of rules automatically for each city.
Using the information available from the spatial database, it is possible to create a database of known rules that can be later used to settle the preferences for future areas, consider-ing that the growth of the city is a stationary stochastic pro-cess. The procedure for creating such database is as follows:
BeingR1the set of rules for the populated areas with known output,
1. In the spatial database, identify all the elements of in-terest (Input), like activity centers, schools, major high-ways and roads, parks, among others;
2. Establish the linguistic expression for each element of interest;
3. For each populated subarea i:
a. Calculate the linguistic expressions for each element of interest, considering the relation of the subarea with the elements of interest and their surroundings, form the linguistic rule and store it inR1.
With this algorithm all the knowledge present in the popu-lated area is extracted and processed.
In some knowledge-extracting algorithms, the known rules will be mixed using different evolutionary operators to create new rules (Yi-Chunget alii, 2003). This approach is not used because most of the rules created will be useless; instead, each unpopulated area is analyzed to find out its output, by optimizing resources and minimizing computational time.
To compare how similar two rules are, the Hamming distance is used. The Similarity (SM)(1) is defined as the Hamming distance between two rules, that is, the number of positions where the corresponding values of the rule Aare different than the ones in ruleB(Hamming, 1950).
SM= X
i=1..#Objects
|RuleA(i)−RuleB(i)| (1)
One way to deal with the rules for the unpopulated area will be to build the input part of the linguistic classification rules and settle the output according to the same part of the rule with the highestSMvalue among all the rules inR1.
The process is described next:
For each unpopulated areak:
1. Build the input part of the classification rule;
2. Calculate theSMvalue between the rule in analysis and all the elements inR1;
3. Assign to the output part of the classification rule in analysis, the output of the rule inR1 with the highest SM.
In this manner, however, the randomness of the behavior for this particular problem is lost. Besides, owing to the nature of the distribution of the unpopulated areas (generally out-side the service area), the SM value could be low and not significant enough to assign a logical output. Another prob-lem arises when several rules with the same input part have different outputs; hence, it is not possible to choose one in-stead of another only with this information.
To overcome these problems, an evolutionary approach is proposed by selecting the output part of the classification rule with more than one source of similar rules. The output part of the classification rule is determined by selecting out a set of similar rules (RSM), sorting it using the SM value for each one as the fitness function, and applying a uniform crossover between two candidates selected by a tournament. In this way, the output parts of the rules are chosen using the char-acteristic of this genetic operator as controlled randomness and statistical survival of the fittest.
In a tournament selection, two or more solutions are picked at random and a tournament strategy is used to select one af-ter a number of rounds are played. In each round, a number of solutions come together to compete, and only the fittest solution will win and be selected (Chambers, 1999). For this particular application, two rounds are played, each one with two solutions randomly picked using theSMvalue as the fit-ness function.
current population to the next, by combining their genetic code to generate a descendant.
The complete process is detailed in the following algorithm:
For each unpopulated areak:
1. Build the input part of the classification rule;
2. Calculate theSMvalue between the rule and all the ele-ments inR1;
3. Build a set of similar rules (RSM) using theSMvalue;
4. Select two candidates to be crossed over using tourna-ment selection;
5. Crossover the output part of the two candidates selected, and assign that value to the output part of the classifica-tion rule in analysis.
The size of theRSMset was determined as 10 for a vector of 13 elements (10 inputs, 3 outputs) by experimentation; with values higher than 10 theSM values are too low, and with lower values the diversification is low. At the end of the process, all the unpopulated areas are classified into dif-ferent preferences for consumer class and expected load den-sity, creating a preference map where it is possible to identify different areas of interest to the planner.
Considering the stochastic nature of this process, the algo-rithm is repeated several times to identify the interest areas more clearly.
To explain the idea, a brief example is presented next:
The values {LN H} represent three different linguistic ref-erences as Low, Normaland Highfor each of the objects considered in the classification rule.
The classification rule for an unpopulated subarea under analysis is given by:
(Distance to major road isN, Distance to nearest school is
N, Distance to activity center is L, Residential density in 3x3 neighborhood isL, Commercial density in 3×3 neigh-borhood isN, Industrial density in 3×3 neighborhood isH).
The vector [N N L L N H] is the input part of the classifica-tion rule for the unpopulated areak.
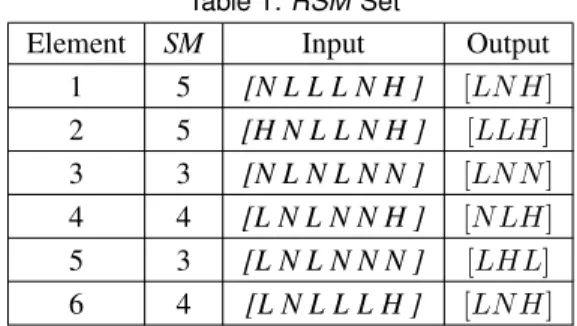
For this vector, theRSMset size is determined as 6 for ex-perimentation. The vector is compared with all the elements in the setR1, and anRSMset is formed with 6 elements, as shown in Table 1.
Table 1:RSMSet
Element SM Input Output 1 5 [N L L L N H ] [LN H]
2 5 [H N L L N H ] [LLH]
3 3 [N L N L N N ] [LN N]
4 4 [L N L N N H ] [N LH]
5 3 [L N L N N N ] [LHL]
6 4 [L N L L L H ] [LN H]
Using a tournament selection, vectors (1) and (3) from the RSM Setpresented in Table 1 are selected to be crossed over.
The output parts of rules (1) and (3), [LN H] and [LN N], are mixed using a uniform crossover obtaining the vector [LN H].
At the end, the output part for the rule [N N L L N H] should be [LN H].
With the results obtained until this point, it is enough to make an entry-level spatial electric load forecasting process that is able to identify all the new zones with possibility of growth. But to complement the results and lower the spatial error, it is necessary to consider some level of redevelopment inside the service area.
The redevelopment process considered is the urban core growth. The rule database and the same principles of sim-ilarities between zones are used in this step; hence, there is no need for new data or different mechanisms than the ones already developed. The process starts by identifying the ac-tivity center by searching for the subareas with the highest values of residential and commercial energy consumption. The location of this special subareas is easy to identify be-cause in the spatial database a zone identified as the urban core in the “elements of interest” already exists.
The classification rules of the subareas in the urban core are compared with the ones in a 3×3 neighborhood zone, and a score is calculated adding those values. This value represents the relationships between the urban core and its immediate neighbors. Next, the classification rules for all the subareas in the service zone are compared with the ones in the urban core and its own 3×3 neighborhood zone. When presented graphically, the results of this exercise will show how the different subzones share similarities with the urban core, and especially, how the different factors in the city will take the urban core growth in a specific direction.
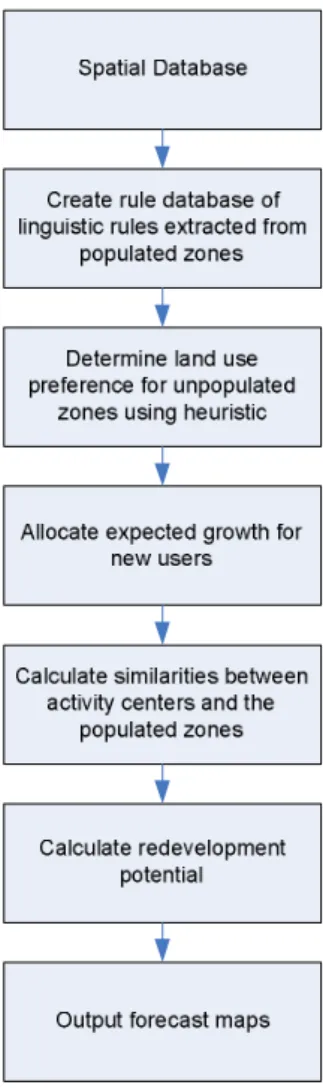
Figure 2: Outline of the complete algorithm
obtained in planning horizon n-1 are used as input elements for planning horizon n.
7
TESTS AND RESULTS
The method was incorporated into the UE viewer, a dis-tribution network management software designed for Elu-cid Solutions, using data from a midsized city in Brazil called Presidente Prudente, in the interior of São Paulo State, with around 200,000 residents and two major activity centers identified as major commercial zones.
Some information obtained about the service area, especially information on future land developments, were not included in the database. This would be used as a validation set for the results.
With the information available, the next objects were chosen to form the classification rules for this particular system:
Input
• Distance to nearest school;
• Distance to nearest hospital;
• Distance to nearest major road;
• Distance to main activity center;
• Distance to secondary activity center;
• Residential load density in a 3x3 neighborhood zone;
• Commercial load density in a 3x3 neighborhood zone;
• Industrial load density in a 3x3 neighborhood zone;
• Residential load density in a 5x5 neighborhood zone;
• Commercial load density in a 5x5 neighborhood zone;
• Industrial load density in a 5x5 neighborhood zone.
Output
• Residential load;
• Commercial load;
• Industrial load.
Figure 3 presents the results obtained for the residential class. In this figure, the circles represent the zones of the service area where some load is already present. The area expected to be occupied according to the information obtained from the utility planning department (validation set) is identified by diamonds, and the area expected to be occupied is identi-fied by squares.
In Fig. 3, one area in the South is identified by the plan-ning department as being occupied for residential consumers in the future but is not identified by the algorithm. This is because a large project is expected to be built in that part of the city, changing the classification of this area from indus-trial to commercial. Because of the indusindus-trial classification of the zone, the algorithm did not consider this area suitable for residential occupation.
In other tests, considering the change of the land use clas-sification and the inclusion of a large simulated load in this zone, it was possible to match this expected behavior.
Figure 3: Service area map with expected residential prefer-ence.
Figure 4: Service Area Map with expected industrial prefer-ence.
present and future development projects, and not likely the terrain characteristics. Therefore, the answer obtained from the algorithm is more complete because it is possible to iden-tify all the zones of interest in the long term.
The results for the industrial and commercial sector are pre-sented in Figs. 4 and 5, respectively, presenting complemen-tary patterns between the three consumer classes analyzed (see Fig. 6).
Finally, it is necessary to settle the temporal allocation of
Figure 5: Service Area Map with expected commercial pref-erence.
Figure 6: Spatial allocation for the three major classes.
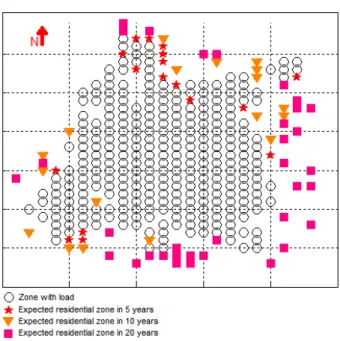
these areas. To do this, after calculating the expected growth because of new consumers in the service area using tradi-tional methods, the areas are assigned considering neighbor-ing characteristics, assignneighbor-ing first the ones with a bigger load density nearby, obtaining the results presented in Fig. 7.
Figure 7: Temporal allocation for residential consumers.
The first areas to be occupied are located in the southeast part of the service area, an area with rapid and constant urban projects for mid- and high economic levels, and in the north of the city, where proximity to another small city and land intended to popularize housing are important factors. This information was not introduced into the algorithm.
Figure 8 shows the redevelopment preference map based on the urban core growth. Obviously, the areas with higher probability of redevelopment are the ones around the urban core, but it is important to note that the urban core is not growing axially around that point, but that it has a strong in-fluence to grow in the southwest. This behavior is explained by the growth in commercial and residential density in that direction, especially for high-income housing. Meanwhile, to the north and east of the urban core, growth is not expected because of the low growth in electrical load density.
To complement the validation of the method, the results were compared with an internal forecast of the electric utility, made manually for the engineers in charge of the network planning, using the manual method presented in (Lee, 2002) , resulting in an error rate between 5% and 10% in different simulations the short term (5 years) and mid term (10 years). For the long term (20 years) there were no results to compare to. These results are considered very good, specially because the manual simulation from (Lee, 2002) could take easily one month of work for several employees.
Figure 8: Redevelopment preference map.
8
CONCLUSIONS
A simple and efficient algorithm to settle future land use and occupation in the spatial electric load forecasting process has been presented by considering the identification of new zones with potential growth and the redevelopment of the existing ones. This application has been proved to be an important tool in assisting distribution network planning engineers to identify important zones with the possibility of growth inside the service area. The algorithm uses simple procedures to ex-tract the knowledge related to user preferences about land use from a multidimensional spatial database. This knowledge is stored in the form of linguistic classification rules.
It is possible that several classification rules with the same in-put present different outin-puts. This is because of the stochas-tic nature of the process, which makes the use of fixed clas-sification rules a problem. To overcome this difficulty, the consumers’ stochastic characteristic is considered using el-ements from evolutionary algorithms to create new classifi-cation rules for the vacant areas using the knowledge previ-ously extracted.
The final result shows the efficiency of the method in cre-ating a forecast map similar in 95% to the utility planning department forecast, with low computational effort and min-imum computer memory requirements, using few resources and data. The results obtained prove the efficacy of the ap-proach and encourage more work in that direction.
to the planning and operation of the distribution network.
REFERENCES
Alfares H. K., Nazeeruddin M. “Electric load forecasting: lit-erature survey and classification of methods,” Interna-tional Journal of Systems Science, v.33, no 1, p. 23-24, Jan. 2002.
ANEEL,Procedimentos de Distribuição - PRODIST 2008. Available online http://www.aneel.gov.br/. (In portuguese)
Carreno, E.M.; Padilha-Feltrin, A., "Evolutionary heuristic to determine future land use," inProc. Power and En-ergy Society General Meeting, IEEE , pp.1-6, 20-24. Jul. 2008.
Chambers, L. Practical Handbook of Genetic Algorithms: Complex Coding Systems, Volume III. USA, CRC Press, 1999.
Chow, M., Zhu, J., Tram, H., “Application of fuzzy multi-objective decision making in spatial load forecasting,” IEEE Trans. on Power Systems, vol 13, pp 1185–1190. Aug. 1998.
Hamming, R. W., “Error detecting and error codes.” Bell System Technical Journal, New York, v.26, no 2, p.147-160, 1950.
Jardini, J. A., Tahan, C. M., Gouvea, M. R., Ahn, S. U., Figueiredo, F. M., “Daily Load Profiles for Residential, Commercial and Industrial Low Voltage Consumers.,” IEEE Trans. on Power Delivery,vol. 15, no. 1, pp 375-380, Jan. 2000.
Lee, W, H. Aanstos, J., “Some unique signal processing ap-plications in power systems analysis,”IEEE Trans. on Acoustics, Speech, and Signal Processing,v. 27, no 6, pp 685, Dec. 1979.
Lee, W, H.Spatial Electric Load Forecasting, 2nd Edition. New York, Marcel Drekker Inc, 2002.
Miranda, V., Monteiro, C., “Fuzzy inference in spatial load forecasting,” inProc. Power Engineering Society Win-ter Meeting,pp 1063-1068 vol.2, Jan. 2000.
Mo-Yuen, C., Hahn, T., "Methodology of urban re-development considerations in spatial load forecast-ing," inProc. Transmission and Distribution Conf, pp 452-457, Sep. 1996.
Rudnick, H.; Arnau, A.; Mocarquer, S.; Voscoboinik, E., "Stimulating efficient distribution," IEEE Power and Energy Magazine,vol.5, no.4, pp.50-67, Jul. 2007.
Van Wormer, F. C., "Some Aspects of Distribution Load Area Geometry,"Power Apparatus and Systems, Part III. Transactions of the American Institute of Electrical Engineers, vol.73, no.2, pp.1343-1349, Jan. 1954.
Vasquez-Arnez, R.L.; Jardini, J.A.; Casolari, R.; Magrini, L.C.; Semolini, R.; Pascon, J.R., "A methodology for electrical energy forecast and its spatial allocation over developing boroughs," inProc Transmission and Distribution Conference and Exposition, 2008. pp.1-6, 2008.
Yang, X., Yuan, J., Zhang, T., Mao, H., “Application of Un-certainty Reasoning Based on Cloud Theory in Spatial Load Forecasting,” inProc. of Intelligent Control and Automation, vol 2, pp 21-23. Jun. 2006.