ABSTRACT
Objective: To analyze the temporal trends in pneumonia mortality rates (standardized by age, using the 2010 population of Brazil as the standard) in all Brazilian geographical regions between 1996 and 2012. Methods: This was an ecological time-series study examining secondary data from the Mortality Database maintained by the Information Technology Department of the Brazilian Uniied Health Care System. Polynomial and joinpoint regression models, and corresponding 95% CIs, were used for trend analysis. Results: The pneumonia mortality rates in the South, Southeast, and Central-West showed a decreasing behavior until 2000, followed by increases, whereas, in the North and Northeast, they showed increasing trends virtually throughout the period studied. There was variation in annual percent change in pneumonia mortality rates in all regions except the North. The Central-West had the greatest decrease in annual percent change between 1996 and 2000, followed by an increase of the same magnitude until 2005. The 80 years and over age group was the one most inluencing the trend behavior of pneumonia mortality rates in all regions. Conclusions: In general, pneumonia mortality trends reversed, with an important increase occurring in the years after 2000.
Keywords: Pneumonia/mortality; Pneumonia/epidemiology; Time series studies.
Pneumonia mortality trends in all Brazilian
geographical regions between 1996 and
2012
Rosemeire de Olanda Ferraz1, Jane Kelly Oliveira-Friestino2, Priscila Maria Stolses Bergamo Francisco1
Correspondence to:
Rosemeire Ferraz. Rua Tessália Vieira de Camargo, 126, Cidade Universitária Zeferino Vaz, CEP 13083-887, Campinas, SP, Brasil. Tel.: 55 19 3521-9572. E-mail: [email protected]
Financial support: None.
INTRODUCTION
Respiratory diseases affect children, adults, and the elderly and are considered important causes of illness and death worldwide. According to data from the World Health Organization, respiratory diseases account for approximately 14% of all deaths globally. Among these, deaths from lower respiratory tract infections range from 31 per 100,000 population in high-income countries to as many as 91 per 100,000 population in those considered low-per-capita-income countries.(1)
In 2012, according to the World Health Statistics, the three leading causes of potential years of life lost worldwide were ischemic heart disease; lower respiratory tract infections, including pneumonia; and stroke.(2)
Chief among lower respiratory tract infections are acute respiratory infections (ARIs), which, although they manifest themselves in benign forms, are more important in some age groups, such as children and the elderly, who are particularly vulnerable to complications of ARIs.(3) Flu
epidemics cause excess mortality from pneumonia and from other causes in the elderly.(4,5) Children under 1 year
of age are especially predisposed to the development of ARIs because of inherent life cycle characteristics, such as incomplete development of the pulmonary system and a developing immune system, which make them more susceptible to more severe infections; this is especially true among infants under 2 months of age.(6)
ARIs are among the leading causes of childhood mortality. The World Health Organization estimates that, in
2013, approximately 3.257 million children under 5 years of age died from respiratory diseases worldwide, with pneumonia being the leading cause of death in 14.9%.(7)
Community-acquired pneumonia (CAP) has varying risk factors, such as aging, smoking, COPD, heart failure, colonization of the oropharynx, microaspiration/ macroaspiration, alcoholism/liver cirrhosis, nutritional
deiciency, immunosuppression, and environmental
factors.(8)
The magnitude of pneumonia in the population and its social impact are shown by the high mortality and morbidity indicators. In Brazil, according to data recorded by the Sistema de Informação sobre Mortalidade do Departamento de Tecnologia da Informação do Sistema Único de Saúde (SIM/DATASUS, Mortality Database maintained by the Information Technology Department
of the Brazilian Uniied Health Care System), between
1996 and 2012, pneumonia accounted for an approximate median of 37% of all deaths from respiratory diseases. In 1997, the pneumonia mortality rate was 18.8 deaths per 100,000 population, and, in 2013, this rate increased to 34.0 deaths per 100,000 population. Distributionally, 18% of the deaths from pneumonia occurred in children under 5 years of age and 57% occurred in individuals over 60 years of age.(9)
In adolescents, young adults, and adults, pneumonia occurs benignly in most cases and has minor complications compared with those occurring in both age extremities (children and the elderly). However, when individuals in
1. Departamento de Saúde Coletiva, Faculdade de Ciências Médicas, Universidade Estadual de Campinas – Unicamp – Campinas (SP) Brasil. 2. Curso de Medicina, Universidade Federal da Fronteira Sul – UFFS – Chapecó (SC) Brasil.
Submitted: 10 August 2016.
Accepted: 14 April 2017.
those age groups are immunocompromised or have a chronic disease, pneumonia may become more severe and account for high mortality rates.(10) In addition,
the impact of pneumonia on population morbidity and mortality varies according to socioeconomic status, among other factors.(11,12) Therefore, although the
incidence of respiratory infections may be similar in several regions, mortality from these diseases is particularly important in countries such as Brazil, a country that has continental dimensions and interregional differences marked by social inequalities, especially in access to health care. Acknowledging the importance of the impact that deaths from pneumonia have on potential years of life lost, also in Brazil, the objective of the present study was to analyze the trends in pneumonia mortality in the entire population of all Brazilian geographical regions between 1996 and 2012.
METHODS
This was an ecological time-series study examining secondary data on deaths from pneumonia (codes
J12-J18 in the International Classiication of Diseases,
10th revision, chapter X: respiratory diseases) that
occurred between 1996 and 2012 in all ive Brazilian
geographical regions. All data were collected from the SIM/DATASUS. Data on the resident population were obtained through the same system, on the basis of estimates provided by the Brazilian Institute
of Geography and Statistics, and were stratiied by
age group and by Brazilian region (North, Northeast, Southeast, South, and Central-West). The response variable was the age-standardized mortality rate (direct
method) for each of the ive Brazilian regions, using
the 2010 population of Brazil as the standard. The calendar years, which were centered on the year 2004 to minimize serial correlation effects, were considered an independent variable.
Mortality trends were analyzed with regression models.
For itting these models, classical assumptions, such
as normality, independence, and homoscedasticity of residuals, were checked. First-, second-, and
third-degree polynomial models were itted, and the one
judged to be the most appropriate on the basis of its
coeficient of determination and/or the one judged to be more parsimonious, with signiicant coeficients, were
selected. These models allow trends to be analyzed globally, identifying the intensity of death occurrence.
In addition, joinpoint regression models were itted
to the natural (neperian) logarithm of the response variable (mortality rates), which allowed us to obtain the annual percent change (APC) and average APC
(AAPC) rates and to identify the “inlection” points
or change points (points at which the slope of the
line changes signiicantly). This modeling was used
to better describe the trends in mortality rates by
identifying local changes and time points of signiicant
increase/decrease.
The results for the analyses were obtained using the R software, version 3.1.2 (The R Foundation for Statistical Computing, Vienna, Austria); the Statistical
Package for the Social Sciences, version 13.0 (SPSS Inc., Chicago, IL, USA); the Joinpoint Regression Program, version 4.1.1.5 (Statistical Methodology and Applications Branch and Data Modeling Branch, Surveillance Research Program, National Cancer Institute, Rockville, MD, USA); and Excel 2013. Joinpoint regression modeling was performed using software provided by the National Cancer Institute.
Conigurations that satisied the assumptions of the models were used for all its.
RESULTS
Of all deaths from respiratory diseases, pneumonia accounted for 38% in 1996, with this rate increasing to 48% in 2012. In the latter year, 58% of all deaths from pneumonia in Brazil occurred in the Southeast (the region with the highest percentage) and 5% occurred in the North (the region with the lowest percentage).
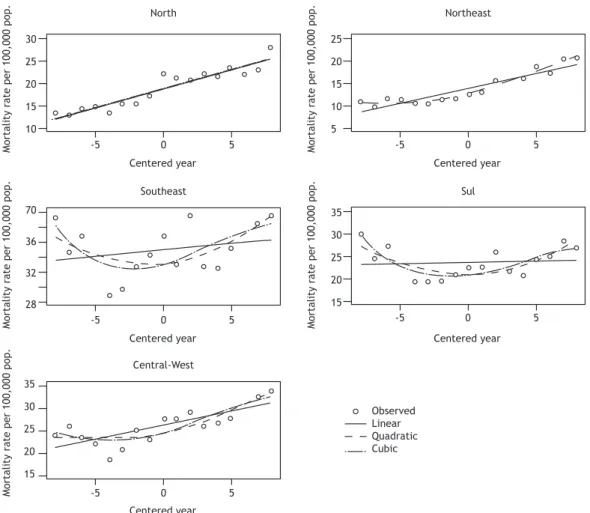
Pneumonia mortality rates (standardized by age) showed a decreasing behavior between 1996 and 2000 (in all regions except the North, in which they showed an increasing behavior in that period), followed by increases, as shown by the trends seen in the various Brazilian regions. The Northeast had the lowest mortality rates. In contrast, the Southeast had the highest mortality rates throughout the period studied (Figure 1 and Table 1).
Polynomial model it results showed that, in the
North, trends were close to linear (Figure 2). This region had the greatest increase in the linear component. The South had the greatest increase in the quadratic component (Table 1).
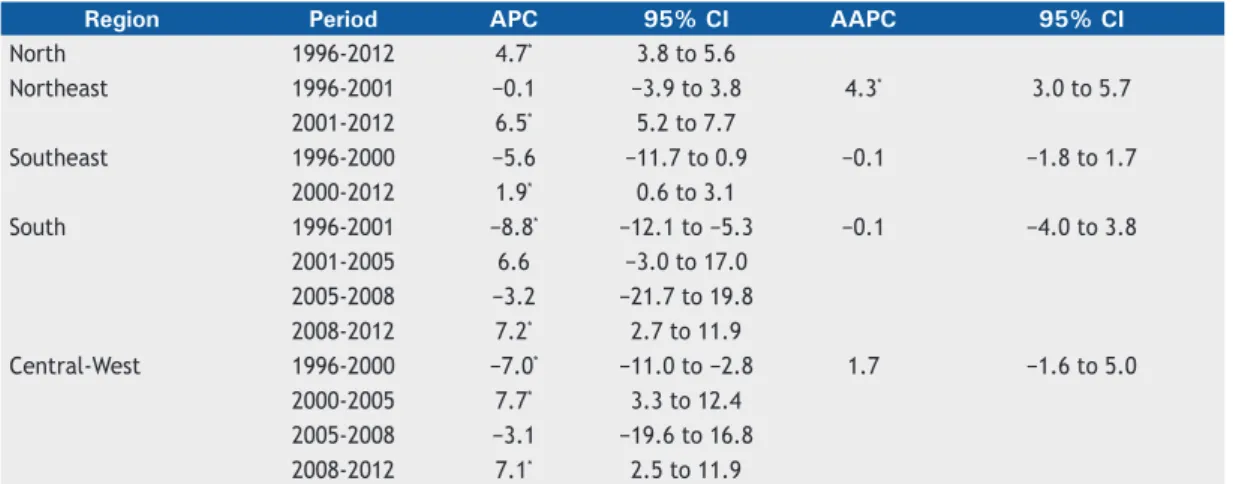
All regions except the North showed inlection points indicating a shift from decrease to signiicant increase
between 2000 and 2001. The greatest increase in APC in pneumonia mortality rates occurred in the Central-West (APC = 7.7; 95% CI: 3.3-12.4) between 2000 and 2005, but this region was also the one that showed a
signiicant decrease (APC = −7.0; 95% CI: −11.0 to −2.8) between 1996 and 2000. The Northeast had the
highest AAPC between 1996 and 2012 (AAPC = 4.3; 95% CI: 3.0-5.7; Table 2 and Figure 3).
DISCUSSION
In the present study, the pneumonia mortality trends for the resident population of all Brazilian geographical regions between 1996 and 2012 were evaluated. The mortality rates showed an increasing trend from 2000 onward, and there were no signs of decrease or stabilization in the years after 2000 in any of the regions. In the North, the rates exhibited a linear behavior, that is, they increased constantly throughout the period. In the other regions, a quadratic behavior better represented the time points of decrease and increase, that is, the rates behaved irregularly over time.
of childhood mortality, even though these regions have succeeded in considerably reducing these rates in recent years, demonstrating repercussions that can
arise from each region’s age proile itself.(13)
Considering these sociodemographic differences among the different regions, it is important to point
out that conditions such as nutritional deiciency,
immunosuppression, and environmental factors impact on the occurrence of CAP.(8) The most common types of
CAP correspond to infections caused by Streptococcus pneumoniae and Haemophilus inluenzae,(14) and
immunizations by means of the 10-valent pneumococcal vaccine and the pentavalent pneumococcal vaccine are part of the Brazilian National Vaccination Schedule. In addition to these vaccines, there is the 23-valent pneumococcal vaccine, which is offered to at-risk groups among individuals over 2 year of age.
In various countries, vaccination for prevention of infection with S. pneumoniae (one of the leading etiologic agents responsible for the pneumonia) in individuals in these at-risk groups has been adopted as a public health measure.(9,15) In Brazil, the 23-valent
pneumococcal polysaccharide vaccine is still rarely used in at-risk patients, although it is available in the public health care system and is formally indicated for use in individuals over 60 years of age; inpatients and/or individuals residing in institutions (nursing homes, retirement homes, etc.); patients with chronic cardiovascular, pulmonary, renal, metabolic
(such as diabetes mellitus), or liver diseases, or with hemoglobinopathies; and immunocompromised individuals (transplant recipients, patients with neoplasia, and HIV-infected individuals). (9,15) The
positive effect of this capsular vaccine against 23 pneumococcal serotypes in reducing the number of hospitalizations for and deaths from pneumonia has been described in several studies.(8,16,17)
In the present study, the decrease identiied between
1996 and 2000, in some regions, is related to the reduction in the mortality rates in all age groups. The resumption of growth after 2000 may have been
inluenced by the 10- to 49-year age group and,
especially, by the over 60-year age group (data not shown).
It is possible that the deaths in children under 5
years of age inluenced the decreasing behavior. One
study reported, for the same age group, pneumonia mortality rates with a decreasing behavior between 1991 and 2007, with the magnitudes being different in the various Brazilian regions.(18) That same study
suggested that the inclusion of vaccination against H. inluenzae type B and S. pneumoniae in the Brazilian National Vaccination Schedule contributed to reducing pneumonia mortality rates.(18) In addition, a study of
children under 1 year of age found a 19% reduction in CAP after the implementation of the 10-valent pneumococcal conjugate vaccine in the Brazilian National Vaccination Schedule, which occurred in 2010 via the Brazilian National Immunization Program.(19)
In the present study, we used secondary data from the SIM/DATASUS; the advantages of this include a comprehensive coverage of deaths, the low cost for information collection, and the ease for longitudinal follow-up. The limitations relate to the lack of standardization in data collection, which affects the quality of the recorded data, and to the possibility that the coverage can vary in time and space, as well as to the lack of information that may be important for
speciic analyses(20) and may be inluencing the upward
trend behavior of the pneumonia mortality rates. It should be noted that the main limitation refers to the fact that the analyses did not include correction for
ill-deined causes of death. The magnitude of mortality rates is affected by ill-deined causes of death, which
introduce a bias in comparisons across areas with different proportions of these causes. The determination and recording of the cause of death or the lack of such a
determination and recording (ill-deined causes) during
the period studied should be considered because of North
Northeast Southeast South Central-West 60
50
40
30
20
10
0
Mortality rate per 100,000 pop.
2000 2005 2010
Year
Table 1. Polynomial model it to pneumonia mortality rates (standardized by age) between 1996 and 2012.
Region B0 B1 B2 R
2 p
North 18.81 0.85 --- 0.89 < 0.001
Northeast 12.73 0.67* 0.05* 0.96 < 0.001
Southeast 32.96* 0.18 0.08* 0.39 0.031
South 20.94* 0.05 0.11* 0.60 0.002
Central-West 24.88* 0.63* 0.06* 0.73 < 0.001
B0: mean annual increase; B1: increase in the linear component; B2: increase in the quadratic component; and R 2:
coeficient of determination of the model. *Level of signiicance set at 5%. Figure 1. Age-standardized pneumonia mortality rates,
regional disparities in this respect. The group of ill-deined
causes exhibits a different epidemiological behavior in each region, and data quality and reliability are better in the South, Southeast, and Central-West. (21) In 1996,
the proportion of ill-deined causes of death exceeded
30% in the Northeast and was about 25% in the North, whereas, in the other regions, it was approximately 10% (data not shown).
The classiication of deaths has improved over time
in all regions, especially in the North and Northeast. In 2005, the Brazilian National Ministry of Health started a project to improve mortality data quality, focusing on these two regions.(22) Since 2006, the proportion of
ill-deined causes of death in the Northeast has been
below 10%, which is similar to that in the Southeast. Currently, in the South and Central-West, the relative
importance of ill-deined causes of death is about 5%.(23)
Interventions targeted at improving mortality data reporting and quality in Brazil have been presented as promising alternatives for improving the SIM and increasing the reliability of health information.(22)
However, in 2012, the relative importance of ill-deined
causes of death in the North exceeded 10%. This may explain the observed differences in rate magnitude and
in trend behavior in the period studied. In addition, in the North, the pneumonia mortality trend exhibited a linear behavior and a greater annual increase in the
study period, relecting the changes in the demographic and epidemiological proile of the population that
occurred in a polarized way in the country.
In recent years, there have been important decreases in mortality from chronic noncommunicable diseases, especially cardiovascular and respiratory diseases; however, the declines have been smaller for neoplasia and diabetes.(24) In contrast, the present study showed
an increase in pneumonia mortality, suggesting a different behavior from that of mortality from other respiratory diseases.
The present study, through the use of secondary data and simple statistical analysis techniques,
allowed the identiication of pneumonia mortality
trends in the different geographical regions of Brazil over a 16-year period, showing that, for all regions, pneumonia mortality increased from 2000 onward, with no signs of decrease or stabilization. Our results provide a framework for planning health promotion
interventions, as well as speciic protection interventions,
especially for the most vulnerable populations, positively
-5 0 5
-5 0 5
-5 0 5
-5 0 5
-5 0 5
30
25
20
15
10
35
30
25
20
15
35
30
25
20
15
25
20
15
10
5
70
36
32
28
Mortality rate per 100,000 pop. Mortality rate per 100,000 pop.
Mortality rate per 100,000 pop.
Mortality rate per 100,000 pop.
Mortality rate per 100,000 pop.
North
Sul Southeast
Central-West
Northeast
Centered year Centered year
Centered year
Centered year
Centered year
Observed Linear Quadratic Cubic
impacting the reduction in pneumonia mortality. Studies identifying subgroups with low vaccine coverage may contribute to guiding these interventions. Knowledge
of pneumonia mortality trends in the different regions of the country can be regarded as a useful strategy for epidemiological surveillance.
50
40
30
20
10
0
2000 2005 2010
Year North
Mortality rate per 100,000 pop.
50
40
30
20
10
0
2000 2005 2010
Year Northeast
Mortality rate per 100,000 pop.
Observed Observed
1996-2012 APC - 4,72 1996-2001 APC - -0,15
2001-2012 APC - 6,46
50
40
30
20
10
0
2000 2005 2010
Year South
Mortality rate per 100,000 pop.
50
40
30
20
10
0
2000 2005 2010
Year Central-West
Mortality rate per 100,000 pop.
Observed
1996-2001 APC - -8,78
2001-2005 APC - 6,56
2005-2008 APC - -3,16
2008-2012 APC - 7,21
Observed
1996-2000 APC - -6,99
2000-2005 APC - 7,73 2005-2008 APC - -3,08
2008-2012 APC - 7,12
50
40
30
20
10
0
2000 2005 2010
Year Southeast
Mortality rate per 100,000 pop.
Observed
1996-2000 APC - -5,60
2001-2012 APC - 1,85 Table 2. Estimates of the annual percent change in pneumonia mortality rates (standardized by age) between 1996 and 2012 (joinpoint regression it).
Region Period APC 95% CI AAPC 95% CI
North 1996-2012 4.7* 3.8 to 5.6
Northeast 1996-2001 −0.1 −3.9 to 3.8 4.3* 3.0 to 5.7
2001-2012 6.5* 5.2 to 7.7
Southeast 1996-2000 −5.6 −11.7 to 0.9 −0.1 −1.8 to 1.7
2000-2012 1.9* 0.6 to 3.1
South 1996-2001 −8.8* −12.1 to −5.3 −0.1 −4.0 to 3.8
2001-2005 6.6 −3.0 to 17.0
2005-2008 −3.2 −21.7 to 19.8
2008-2012 7.2* 2.7 to 11.9
Central-West 1996-2000 −7.0* −11.0 to −2.8 1.7 −1.6 to 5.0
2000-2005 7.7* 3.3 to 12.4
2005-2008 −3.1 −19.6 to 16.8
2008-2012 7.1* 2.5 to 11.9
APC: annual percent change; and AAPC: average annual percent change. *Level of signiicance set at 5%.
Therefore, we emphasize the importance of monitoring pneumonia mortality rates over periods subsequent to that under study here, in order to determine whether prevention interventions, such
as vaccination campaigns and improved access to health care, have been effective and have had an
inluence on the trends in pneumonia mortality rates
in all Brazilian geographical regions.
REFERENCES
1. World Health Organization [homepage on the Internet]. Geneva: World Health Organization [cited 2014 May 20]. The top 10 causes of death Available from: http://www.who.int/mediacentre/factsheets/ fs310/en/index1.html
2. World Health Organization [homepage on the Internet]. Geneva: World Health Organization [cited 2014 May 20]. Global Inluenza Surveillance and Response System (GISRS). Available from: http:// www.who.int/inluenza/gisrs_laboratory/en/index.html
3. Cardoso AM. A persistência das infecções respiratórias agudas como
problema de saúde pública. Cad Saude Publica. 2010;26(7):1270-1. https://doi.org/10.1590/S0102-311X2010000700001
4. Scoralik FM, Piazzolla LP, Pires LL, Nery de Castro C, Kummer de Paula W. Mortality due to respiratory diseases in the elderly after inluenza vaccination campaigns in the Federal District, Brazil, 1996-2009. J Bras Pneumol. 2013;39(2):198-204. https://doi.org/10.1590/ S1806-37132013000200011
5. Freitas AR, Francisco PM, Donalísio MR. Mortality associated with inluenza in tropics, state of são paulo, Brazil, from 2002 to 2011: the pre-pandemic, pandemic, and post-pandemic periods. Inluenza Res Treat. 2013;2013:696274. https://doi.org/10.1155/2013/696274
6. Newton O, English M. Young infant sepsis: aetiology, antibiotic susceptibility and clinical signs. Trans R Soc Trop Med Hyg. 2007;101(10):959-66. https://doi.org/10.1016/j.trstmh.2007.05.005
7. Liu L, Oza S, Hogan D, Perin J, Rudan I, Lawn JE, et al. Global, regional, and national causes of child mortality in 2000-13, with projections to inform post-2015 priorities: an updated systematic analysis. Lancet. 2015;385(9966):430-40. https://doi.org/10.1016/ S0140-6736(14)61698-6
8. Gomes L. Fatores de risco e medidas proiláticas nas pneumonias adquiridas na comunidade. J Pneumol. 2001;27(2):97-114. https:// doi.org/10.1590/S0102-35862001000200008
9. Sociedade de Pediatria do Rio Grande do Sul [homepage on the Internet]. Porto Alegre: a Sociedade [cited 2015 Mar 23]. Informe Técnico. Campanha Nacional de Vacinação Contra a Inluenza, Brasília, 2014. [Adobe Acrobat document, 35p.]. Available from: http://sprs.com.br/sprs2013/bancoimg/140402011250Informe_ Campanha_Inluenza_25_03_2014.pdf
10. Corrêa Rde A, Lundgren FL, Pereira-Silva JL, Frare e Silva RL, Cardoso AP, Lemos AC, et al. Brazilian guidelines for community-acquired pneumonia in immunocompetent adults - 2009. J Bras Pneumol. 2009;35(6):574-601.
11. Niederman M, Krilov LR. Acute lower respiratory infections in developing countries. Lancet. 2013;381(9875):1341-2. https://doi. org/10.1016/S0140-6736(12)62178-3
12. Barreto MS, Silva RL, Marcon SS. Morbidity in children of less than one year of age in risky conditions: a prospective study. Braz J Nurs. 2013;12(1):5-20. https://doi.org/10.5935/1676-4285.20133999
13. Vasconcelos AM, Gomes MM. Demographic transition: the Brazilian
experience. Epidemiol Serv Saúde. 2012;21(4):539-48. https://doi. org/10.5123/S1679-49742012000400003
14. dos Santos SR, Passadore LF, Takagi EH, Fujii CM, Yoshioka CR, Gilio AE, et al. Serotype distribution of Streptococcus pneumoniae isolated from patients with invasive pneumococcal disease in Brazil before and after ten-pneumococcal conjugate vaccine implementation. Vaccine. 2013;31(51):6150-4. https://doi. org/10.1016/j.vaccine.2013.05.042
15. Centers for Disease Control and Prevention (CDC); Advisory Committee on Immunization Practices. Updated recommendations for prevention of invasive pneumococcal disease among adults using the 23-valent pneumococcal polysaccharide vaccine (PPSV23). MMWR Morb Mortal Wkly Rep. 2010;59(34):1102-6.
16. Shapiro E, Berg AT, Austrian R, Schroeder D, Parcells V, Margolis
A, et al. The protective eficacy of polyvalent pneumococcal polysaccharide vaccine. N Engl J Med. 1991;325(21):1453-60. https://doi.org/10.1056/NEJM199111213252101
17. Christenson B, Lundbergh P, Hedlund J, Ortqvist A. Effects of a large-scale intervention with inluenza and 23-valent pneumococcal vaccines in adults aged 65 years or older: a prospective study. Lancet 2001;357(9261):1008-11. https://doi.org/10.1016/S0140-6736(00)04237-9
18. Rodrigues FE, Tatto RB, Vauchinski L, Leães LM, Rodrigues MM, Rodrigues VB, et al. Pneumonia mortality in Brazilian children aged 4 years and younger. J Pediatr (Rio J) 2011;87(2):111-4.
19. Silva SR, Mello LM, Silva AS, Nunes AA. Impacto da vacina antipneumocócica 10-valente na redução de hospitalização por pneumonia adquirida na comunidade em crianças. Rev Paul Pediatr. 2016;34(4):418-24. https://doi.org/10.1016/j.rpped.2016.02.003
20. Coeli CM. Sistema de Informação em Saúde e uso de dados secundários na pesquisa e avaliação em saúde. Cad Saude Colet. 2010;18(3):335-6.
21. França EB, da Cunha CC, Vasconcelos AM, Escalante JJ, de
Abreu DX, de Lima RB, et al. Investigation of ill-deined causes of death: assessment of a program’s performance in a state from the Northeastern region of Brazil. Rev Bras Epidemiol. 2014;17(1):119-34. https://doi.org/10.1590/1415-790X201400010010ENG
22. Brasil. Ministério da Saúde. Secretaria de Vigilância em Saúde. Departamento de Análise da Situação de Saúde. Manual para investigação do óbito com causa mal deinida. Brasília (DF): Ministério da Saúde; 2009.
23. Brasil, Ministério da Saúde. Secretaria de Vigilância em Saúde [homepage on the Internet]. Brasília: o Ministério. SIM - Sistema de Informação sobre Mortalidade. Available from: http://sim.saude.gov. br/default.asp