Some non-equilibrium phenomena in the malic
acid/water/Polysorbate 81 system
Abeer Al Bawab
a,∗, Stig E. Friberg
b,
Mateus M. Bergamaschi
c, Orlando D.H. Santos
caChemistry Department, Faculty of Science, University of Jordan, P.O. Box 13536, Amman 11942, Jordan bChemistry Department, University of Virginia, Charlottesville, 22911 VA, USA
cDepartment of Pharmaceutical Science, Faculty of Pharmacy, University of Sao Paulo,
Ribeirao Preto, SP, Brazil
Received 28 January 2006; received in revised form 10 September 2006; accepted 25 September 2006 Available online 29 September 2006
Abstract
Topical formulations undergo radical structural changes after application and the action on the skin is not directly related to the original structure of the formulation. This fact has been well established in the scientific literature. However, and more essential, is the fact that these changes in the formulation structure are not equilibrium ones. Especially so, with the hydroxy acids, which are widely used in cosmetic and dermatological treatment of skin. The article reports the first investigation into the non-equilibrium conditions in a hydroxy acid system.
Different phases in the title system, which were not in mutual equilibrium, were brought in contact while avoiding convection. The transfer of substance between them was estimated from the changes in volume of each phase.
The results showed, unexpectedly, that the systems were far from equilibrium even after prolonged times in contact. The kinetics of the changes varied to significant degree, from extremely slow, when solid phases were involved to fast for liquid phases. In one case was observed a separated layer, which was not found in the phase diagram under equilibrium conditions.
© 2006 Elsevier B.V. All rights reserved.
Keywords: Non-equilibrium; Malic acid; Phase diagram; Evaporation; Topical applications
1. Introduction
The different association structures in surfactant systems and their equilibria have been extensively investigated and pro-vide thorough information about the subject (Ekwall, 1975; Schramm et al., 2003; Schick, 1992; Holmberg et al., 2002; Shah, 1998; Diamant and Andelman, 2004; Walstra, 1983; Friberg and Neogi, 1989). However, in a large number of indus-trial processes, such as emulsification (Sjoblom, 2001; Julian and Clements, 2004) and extraction (Neogi et al., 1985; Friberg et al., 1986a) the systems are far from equilibrium. In fact, the success of many of these processes entirely depends on the non-equilibrium conditions.
∗Corresponding author. Tel.: +962 6 777644949; fax: +962 6 5348932. E-mail addresses:drabeer@ju.edu.jo,abeerbawab@yahoo.com (A. Al Bawab).
In addition, a large number of commercial products are, per se, non-equilibrium systems, such as emulsions (Larsson, 1994) and most of the vesicle solutions (Simonnet, 1994; Lasic, 1988) to name but two of the best known examples. In spite of this obvious importance, literature in this area is extremely sparse in comparison with the vast information available for equilibrium systems. One fundamental treatment is by Neogi (Friberg et al., 1986b), who analyzed the basis of the appearance of a transient lamellar liquid crystal, which had a decisive influence on an extraction process (Ma et al., 2004). Neogi also reported on the influence by a similar structure in the formation of microemul-sions (Miller and Neogi, 2004). These reports were concerned with liquid systems, but a large number of commercial formula-tions also involve solid compounds and we found a contribution concerning non-equilibrium phenomena in a system containing also a solid to be of interest. It seemed reasonable to expect the solid compound to exert some influence on the transport pro-cesses different from the ones in an entirely liquid system.
A system with malic acid was chosen, because of the acid belonging to the group called fruit acids. These acids, of which hydroxy carboxylic acids are members, are well known for their beneficial action on skin (Bawab et al., 2002, 2004a; Al-Bawab and Friberg, 2004b; Al-Al-Bawab, 2006; Friberg et al., 1998; Friberg and Al-Bawab, 2006; Huber and Christoffers, 1977) and their colloidal and macroscopic dispersions have a wide commercial use (Robert et al., 1980; Cannon, 1997; Kaselionis, 1988; Kligman et al., 1996; Roeding and Artman, 1996). The applications are almost exclusively topical and as a consequence the subsequent evaporation process may give rise to non-equilibrium conditions. From a purely pharmaceutical point of view it has to be realized that the multitude of treat-ments with hydroxy-acids (Inan et al., 2006; Bergfeld et al., 1997; Hood et al., 1999) depend on the phase changes during evaporation and that these changes are not of the equilibrium kind. With regard to this fact we found a more general treatment of the non-equilibrium conditions of a representative hydroxy-acid formulation to be of pharmaceutical interest.
In the present contribution, the malic acid was combined with water and a predominantly hydrophobic surfactant, Polysorbate 81; basically a penta-oxyethylene sorbitan mono-oleate.
2. Materials and methods
2.1. Materials
The following chemicals were used without further purifi-cation, Tween 81, pentaoxyethylene sorbitan mono-oleate, was from Uniqema Co., ICI Surfactants (Wilmington, DE, U.S.A.) Water was deionized and triply distilled. Malic acid (99%) cis-butenedioic acid, was from Merck, Darmstadt, F.R. Germany.
2.2. Instruments
The following instruments were used
- LEITZ wetzlar microscope (Ortholux II Pol-BK) with Orthomat camera.
- Meiji ML 9400 Polarizing Microscope.
- Mettler AJ150 Analytic Balance was used to determine the weight.
- Vibrofix VFI Electronic (shaker) was used to mix the samples. - SI TRON TINCA 4003 Centrifuge with maximum speed of 5500 min−1was used to determine the extent of the solubility regions by separating multi-phase compositions.
2.3. Phase diagram determination
The solubility regions were determined by addition of water to malic acid/surfactant combinations, noting points of clarity and turbidity. The extent of the solubility regions was confirmed by centrifugation at 1500 rpm of samples and by preparing sam-ples close to the solubility limits, and storing them for several days at room temperature. The liquid crystal phase was detected by observation of samples between crossed polarizers. The limits of the phase were determined by observing samples
microscop-ically between crossed polarizers after several days of storage at room temperature.
2.4. Non-equilibrium phase contacts
The phase with less density was carefully layered on top of the one with greater density in a manner to avoid mixing. The test tube was placed on a flat plate with insulation from the bench surface to dampen any vibrations to the maximum extent. The change in the height of the layers was measured at suitable inter-vals using a millimeter scale and the test tubes were observed between crossed polarizers to detect any anisotropic material. The amount of the different solutions are given inTable 1, the following comments to each experiment are useful to realize the goal of each.
In the first instance, the samples were selected to obtain infor-mation about the interaction between the pure compounds. With those results available, it was found that an opportunity existed to obtain information about more complex situations and the last experiments illustrate these conditions.
In the first experiment, water was poured on top of the acid, which had been carefully melted and re-solidified to make a flat interface towards the water. In this case, there was no formation of new phases and the information is only concerned with the relative transport of the acid into the water and vice versa. In experiment 2, water was poured on the surfactant, to follow up the formation of the liquid crystal.
In experiment 3, the surfactant was placed on the acid, which meant that the only transport would be the penetration of surfac-tant into the solid acid. The results showed this process to be too slow to be measured and experiment 4 repeated the process, but now with the surfactant on a solid solution of 5% of water in the acid. Even now the process was too slow to be measured and the importance of the solid state for the mutual interaction between the water and the surfactant was illustrated in experiment 5. Now the surfactant was placed on a maximally concentrated solution of the acid in water to give an opportunity to compare the rate of formation of the solid acid solution of surfactant and water with the formation of the liquid crystal.
The results of this experiment indicated a very slow formation of the solid solution and complementary measurements were performed. In these, the liquid crystal was layered on top of the aqueous solution, experiment 6, and finally experiment 7, a dispersion of the liquid crystal in water was placed on top of it.
3. Results
T able 1 The amount of dif ferent solutions Experiment number Experiment descriptions Diameter of test tube (cm) W eight of malic acid or weight of solid solution, E (g) W eight of w ater W (g) W eight of T ween 81 S (g) W eight of aqueous solution of malic acid A (g) W eight of v esicle solution D (g) 1 W ater/malic acid 2.0 8.0 3.486 – – – 2 W ater/T ween 81 (S) 2.0 – 4.71 14.13 – – 3 T ween 81 (S)/malic acid 2.0 12 – 28 – – 4 T ween 81 (S)/solid malic acid solution (E) (E: 95% acid with 5% w ater) 1.0 6.28 – 1.77 – – 5-a T ween 81 (S)/saturated aqueous solution of malic acid (A) (A: 57% acid and 43% w ater) 1.2 – – 0.528 6.0 – 5-b T ween 81/saturated aqueous solution of malic acid (A) (A: 57% acid and 43% w ater) 2.0 – – 2.112 24 – 6 LLC/saturated aqueous solution of malic acid (A) (A: 57% acid and 43% w ater) 2.0 – 2.61 LLC 19.92 0.6003 2.0097 7-1 V esicles solution (1.18 g T ween 81 and 1.96 g w ater)/aqueous solution (54% acid and 46% w ater) 2.0 – – – 14.7 3.14 7-2 V esicles solution (0.589 g T ween 81 and 2.551 g w ater)/aqueous solution (54% acid and 46% w ater) 2.0 – – – 10.28 3.14
Fig. 1. The phase diagram of water, malic acid and Tween 81. LC, liquid crystal; MAS, malic acid solution; AS, aqueous solution (acid–water); S, surfactant; A, saturated aqueous malic acid solution; B, aqueous solution (acid–water); C, solid sample (surfactant–water–acid); E, solid sample (water–acid); D, two phase sample (water–acid).
water; 17.9% as well as for the surfactant; 23.6% as a solid solution (MAS). The extremely limited solubilization of the surfactant into the aqueous solution of the acid and the same phenomenon for the acid into the liquid crystalline phase as well as into the surfactant gave rise to two-phase areas with some interesting features. At first, the two-phase area of the aque-ous solution and the lamellar liquid crystal (AS-LC) reveals a huge variation of acid content in the aqueous solution; 38.8% by weight, while the corresponding change in the liquid crystal is too small to be marked in the diagram. The second two-phase realm of interest is the one in which the aqueous acid solution is in equilibrium with the solid acid solution of surfactant and water (AS-MAS). For that part, one finds that a reduction of the surfactant content in the solid from 20.7% to zero causes the aqueous solution to accept more of the acid accompanied by an increase of the water content of the acid solid solution. The composition of the solid acid solution in equilibrium with the aqueous acid solution with 36.4% of the acid was also in equilibrium with the liquid crystalline phase forming a narrow two-phase area (MAS-LC). The same composition was also in equilibrium with the surfactant forming a second three-phase region (MAS-LC-S). The surfactant in turn was in equilibrium with the solid acid solution with diminishing amount of water (MAS-S).
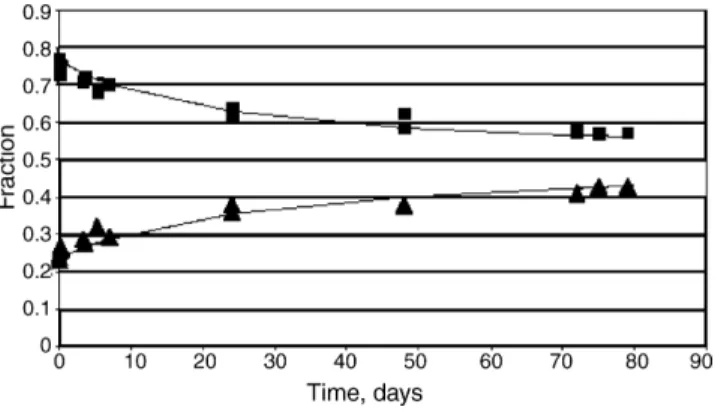
Fig. 2. The height fractions of the aqueous layer and the solid acid layer when the aqueous acid layer was layered on top of the solid acid layer vs. time. () Solid acid layer and () aqueous layer.
indicates the process to be diffusion controlled. The process was surprisingly symmetrical.
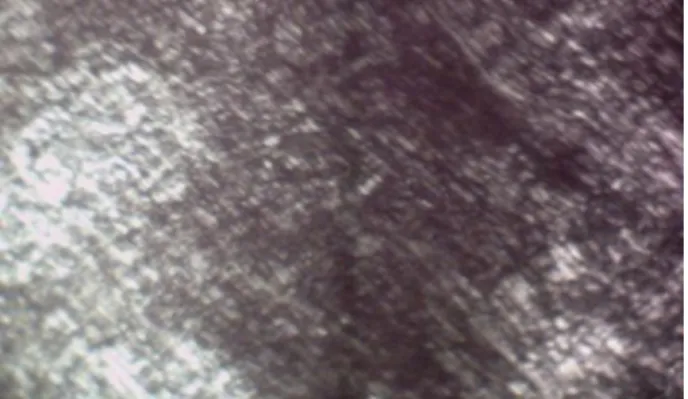
The experiment, when water was placed on top of the sur-factant in amounts corresponding to the composition of the liquid crystalline phase at equilibrium gave a more complex result,Fig. 3. An anisotropic layer was immediately formed and increased to 6.7% of the total height within 17 h, while during that time the aqueous layer was reduced by 6.6%. The surfac-tant layer was not reduced to measurable degree during that time period. The microscopy photographs show the anisotropic layer during the first period inFig. 4. The photo reveals only a small amount of truly anisotropic material, but for the period after 17 h such material became prevalent (Fig. 5). Unfortunately, it was not possible to obtain verifiable information for the process after the time period inFig. 3. The interface between the lay-ers became diffuse in spite of the most careful efforts to avoid mechanical disturbance of the samples.
The combination of surfactant and acid showed an extremely slow penetration of the surfactant into the acid and no measurable change in the heights of the layers was found during several days. A similar result was found, when the surfactant was placed on top of a solid acid solution of the acid containing 5% water, E, Fig. 1.
Fig. 4. The initial anisotropic layer observed between crossed polarizers in opti-cal microscopy.
The next experiment was aimed at finding the kinetics of the formation of the solid acid solution from the surfactant in contact with the aqueous liquid solution of the acid connects to the surfactant. The surfactant, S, Fig. 1, was placed on top of a concentrated solution of the acid in water, A,Fig. 1, in an amount to result in the formation of a two-phase system of the aqueous solution at B,Fig. 1and the solid acid solution at C, Fig. 1. According to the phase diagram, the contact should lead to a precipitation of a solid solution at C,Fig. 1. The removal of the acid from the aqueous solution would reduce the amount of the acid in the latter from A to B,Fig. 1. This did not happen. Instead of finding a solid acid solution layer, the layer showed only the optical pattern of liquid crystal,Fig. 5. The percentage of layer heights is shown inFig. 6.
The resistance to form the solid acid compound was con-firmed in experiment 6, when the liquid crystalline phase, LC, Fig. 1, was combined with the concentrated solution of acid in water, A, Fig. 1. No solid layer was observed, even after prolonged exposure; instead a narrow layer of surfac-tant was initially observed on top of the liquid crystalline layer.
Fig. 5. The lamellar liquid crystal structure as observed crossed polarizers in optical microscopy.
Fig. 6. The percentages of layers vs. time when the surfactant (S) was placed on top of the concentrated aqueous solution of acid (A). () Liquid crystal (anisotropic), () aqueous solution and (䊉) surfactant layer.
This obstacle to the formation of the solid acid solution of both surfactant and water was confirmed when an aqueous dis-persion of the liquid crystal, D,Fig. 1, was placed on top of the aqueous solution of the acid, A,Fig. 1, in amounts to provide an aqueous phase at A,Fig. 1, and a solid acid solution at C,Fig. 1 (experiment 7).
Fig. 7shows the vesicle solution layer to be reduced, being replaced by an anisotropic layer of identical size. The size of the aqueous layer was not reduced; instead a small but detectable increase was observed,Fig. 7.
Fig. 7. The percentage of layer heights vs. time when a liquid crystalline dis-persion (vesicles) was placed on top of a concentrated aqueous solution of malic acid. () Vesicles layer, () anisotropic layer and () aqueous layer.
4. Discussion
The results show an extended array of different behavior and the following treatment will address the various phenomena according to the complexity of the processes taking place. The simplest behavior was, as expected, found, when the acid and water were contacted. This combination cannot be expected to give rise to colloidal association structures, association probably being limited to the formation of dimers in the aqueous solution. As shown byFig. 2, there are no features to indicate any pro-cesses but mutual diffusion of the two compounds and the two layers approach the estimated equilibrium state in an expected manner. The equations covering the case of mutual diffusion have been published (Leaist, 2002; MacEwan and Leaist, 2003), but for the present contribution the focus is instead on to which extent the extrapolation to infinite time of the curves provides the expected value of 0.5.
An attempt was made mathematically to extrapolate the val-ues inFig. 2. This approach appeared justified considering the fact that the points inFig. 2were the result of two independent experiments and that the change in values covers more than 70% of the change, should the transport have continued to the equi-librium state. The extrapolation to infinite time infinite time was made using modified Langmuir functions, based on the experi-mental results.
The equations for the water (W) and acid (MA) layers height versus time read
FW=0.235
+0.265t
t+28.91 (1)
FMA= 0.5
+23.1
t+23.1 (2)
in whichFWandFMAare the fractions of total height andtis time in hours.
Both equations acceptably fit the experimental values,Fig. 1 and both extrapolate to the value 0.5. The results offer a con-vincing corollary that the acid/water combination offered no processes except the anticipated mutual diffusion of molecular species.
solu-bility of surfactant in the acid,Fig. 1, was determined in this manner.
The kinetics of the system surfactant and water in contact, on the other hand, is of colloidal relevance. In the experiment, the amounts of the two compounds were selected to provide a lamellar liquid crystal at equilibrium and this structure was also formed but not with a simple time dependence. As revealed by Fig. 3, the process may be divided into two parts of which the initial one lasts the first 17 h. It is characterized by a slow forma-tion of the liquid crystal dispersed in the water as demonstrated by the microscopy photos,Fig. 4. After 17 h, the formation of the lamellar phase accelerated (Fig. 5).
Before discussion the details of the processes, it is useful to make an estimation of the total process. The curves inFig. 3 are fitted to simple second order equations with the following results. The fraction of the anisotropic layer of the total height was described as
FAN =0.0002t2+0.00003t+0.741 (R2=1.000) (3) In whichFANis the height fraction of the anisotropic layer.
In the same manner the, fractions occupied by the aqueous layer,FAQand surfactant layer,FS, were given in equations.
FAQ=2E−19t2+0.0038t+0.26 (R2=0.997) (4)
FS = −0.0014t2+0.0019t+0.741 (R2=0.999) (5)
A simple test of the validity of these equations is to solve for the time for the expected final result, which meansFAN= 1, while
FS=FAQ= 0.
It is of course not expected to find any accuracy in such a highly approximated process, but the results gave the three times 70, 68 and 75 h, which must be judged as satisfactory.
With these results, it may safely be concluded that the for-mation of the liquid crystalline phase took place in a fashion pointing to a complete process within a realistic time. The remaining feature to be discussed is, of course, the variation of rate with time. At first, the reduction of the surfactant layer is extremely slow in the initial stage and definitely unexpected a separate layer of suspended liquid crystal was observed.
The point to be noticed is the fact that an interface was detected between the water layer and this solution. At present, there is no explanation for these results; the matter is under inves-tigation to find the fundamental reason for the appearance of this layer. In lieu of reliable experimental evidence, it is only possible to indicate some highly tentative explanations. The most plausi-ble of such conjectures would be that the surfactant, consisting of a series of compounds, experiences a spontaneous separation of its components in the initial stages, but that this separation is kinetically monitored and that the continued process reverses to conditions governed by equilibrium conditions.
The experiment in which the surfactant, S,Fig. 1, was placed on top of the most concentrated aqueous solution of the acid A,Fig. 1, gave results, which, during the process deviated from the equilibrium conditions to a high degree. According to the phase diagram, the expected behavior would be for the concen-tration of the aqueous solution to be reduced from A,Fig. 1, to point B,Fig. 1. In this process of expelling the acid, the latter
should attract surfactant to form a solid acid solution varying its concentration along the line of its maximum content of, simul-taneously, water and surfactant to end at point C, Fig. 1. The liquid crystalline phase is not in equilibrium with the isotropic liquid aqueous solution of the acid at the concentrations encoun-tered. What was instead observed,Fig. 6, was a layer with the characteristics of liquid crystal and this was also found in the microscopy pattern,Fig. 5. In addition to the liquid crystalline pattern in the microscope images of crystals were also viewed. Aside from the fact that liquid crystals were present the most essential result is the fact that both these vehicles were situated dispersed in an aqueous layer and that this layer was separated from the aqueous solution of acid by an interface. The similar-ity to the separate layer, when water was placed on top of the surfactant is conspicuous. In that case an aqueous dispersion is separated from water; in the present case, a dispersion, contain-ing two phases, is detached from a molecular aqueous solution (Fig. 4).
It is instructive to analyze the amounts in Fig. 6. The sur-factant layer is gradually disappearing during the first 6 h of the experiment, which means 12% reduction in the height of that layer. During that time period, the anisotropic layer increases 12.5% and the aqueous layer is reduced by 2.5%. Reverting these numbers to equilibrium structures one finds a requirement of water of between 4% (if it all formed a liquid crystal to lesser values if some, as happened, formed the solid acid solution.). However, removing any water from the aqueous solution means that its concentration of acid is changed to a value in excess of its maximum solubility and acid molecules must, with species of acid available to form the solid acid solution of surfactant and water. Assuming this to be the probable process, an explanation is in need for the primary formation of liquid crystalline struc-tures instead of the solid solution of the acid. Thermodynamics, obviously, cannot answer that question. The chemical potential of both water and acid are identical in the solid acid solution and in the liquid crystal. The thermodynamic argument would, actually, favor the formation of the solid acid solution, because the chemical potential of the surfactant is less in it, when in equi-librium with the aqueous solution at concentrations in excess of value B,Fig. 1.
of water and 0.013 wu:s of surfactant, leaving 0.112 wu:s of surfactant to form a liquid crystal, which amount requires 0.037 wu:s of water. 0.033 wu:s of water remains, and the agreement must be considered satisfactory considering the experimental conditions.
The results of the experiment placing a liquid crystal dis-persion, D, Fig. 1, in contact with the concentrated aqueous solution, A,Fig. 1is in accordance with these conclusions, but add a confirming feature.
In this case, Fig. 7, similar layers are formed, but now an increase is found in the size of the aqueous solution layer. This change is a rational consequence of the fact that the chemi-cal potential of water is lower in the aqueous solution than in the liquid crystal dispersion. Hence, water is extracted from the aqueous dispersion of vesicles (or small liquid crystal particles) into the concentrated acid solution and, as a consequence, the liquid crystal particles (or vesicles) agglomerate to form a lamel-lar liquid crystal. This interpretation is supported by the results, when the liquid crystal was placed on top of the solution in ques-tion. The low chemical potential of water in the isotropic liquid aqueous solution led to extraction of some water from the liquid crystalline phase resulting in the separation of some surfactant.
5. Conclusion
The investigation demonstrated that bringing phases, not in mutual equilibrium in contact could give rise to non-interfacial transport.
Acknowledgements
The authors would like to thank Miss Ayat Bozeya, Miss Eveen Al-Shalabbi, Miss Mervat Sammor, Mr. Sorqrat Qahosh and Mr. Azzam H. Karadsheh for their valuable help in this research project.
References
Al-Bawab, A., Friberg, S.E., Aikens, P.A., 2002. The phase behavior of ␣
-hydroxyoctanoic acid/Laureth 4/white oil/water system and preliminary evaluation of the phase changes during evaporation. J. Cosmet. Chem. 53, 151–155.
Al-Bawab, A., Friberg, S.E., Fusco, C., 2004a. Evaporation of model skin lotion with beta hydroxy-acids. Int. J. Cosmet. Sci. 26, 273–279.
Al-Bawab, A., Friberg, S.E., 2004b. Amphiphilic association structures in a model skin lotion with hydroxyl acid. Int. J. Cosmet. Sci. 26, 1–9. Al-Bawab, A., 2006. Beta-hydroxy acids from a formulation point of view. J.
Dispersion Sci. Technol. 27, 697–701.
Bergfeld, W., Tung, R., Widimos, A., VEllanki, L., Remzi, B., Stanton-Hicks, U., 1997. Improving the cosmetic apparence of photoaged skin with gycolic acid. J. Am. Acad. Dermatol. 36, 1011–1013.
Cannon, C., September 1997. The New B.H.A. Buzz New Woman, pp. 44–47. Diamant, H., Andelman, D., 2004. Models of gemini surfactants. In: Zana, R.,
Xia, J. (Eds.), Gemini Surfactants. Dekker, New York, pp. 37–64. Ekwall, P., 1975. Composition, properties and structures of liquid crystalline
phases in systems of aphiphilic compounds. In: Advances in Liquid Crystals. Academic Press, New York, pp. 1–139.
Friberg, S.E., Al-Bawab, A., Barber, J., 1998. Phase equilibria in the systems of acetic and glycolic acid with water and Laureth 4. J. Dispersion Sci. Technol. 19, 399–403.
Friberg, S.E., Al-Bawab, A., 2006. Phase behavior of beta hydroxy-acids with Laureth 4. J. Pharm. Sci. 95, 1834–1840.
Friberg, S.E., Mortenson, M., Neogi, P., 1986a. Hydrocarbon extraction into a surfactant phase with non-ionic surfactants. I. Influence of phase equilibria for extraction kinetics. Sep. Sci. Technol. 20, 285–296.
Friberg, S.E., Neogi, P., 1989. Microemulsion-based separations. In: Scamehorn, J.F., Harwell, J.H. (Eds.), Surfactant-Based Separation Processes. Dekker, New York, pp. 119–138.
Friberg, S.E., Podzimek, M., Neogi, P., 1986b. Transient liquid crystals in a w/o microemulsion. J. Dispersion Sci. Technol. 7, 57–79.
Holmberg, K., Jonsson, B., Kronberg, B., Lindman, B., 2002. Surfactants and Polymers in Aqueous Solution, second ed. John Wilely & Sons, New York. Hood, H.L., Kraeling, M.E.K., Robl, M.G., Bronaugh, R.L., 1999. The effect of an alpha acid (glycolic acid) on hairless Guinea pig skin permeability. Food Chem. Toxicol. 37, 1105–1111.
Huber, C., Christoffers, E., 1977. Keratolytic effect of salicylic acid. Arch. Der-matol. Res. 257, 293–297.
Inan, S., Oztukcan, S., Vatansever, S., Ermertcan, A.T., Zeybek, D., Oksal, A., Giray, G., Muftuoglu, S., 2006. Histopathological and ultrastructural effects of glycolic acid on rat skin. Acta Histochem. 108, 37–47.
Julian, D., Clements, Mc., 2004. Food Emulsions: Principles, Practice and Tech-niques. CRC Press, Boca Raton, FL.
Kaselionis, V.R., 1988. New Age Treatments in Skin Care: Alpha and Beta Hydroxy Acids. Master Thesis. Chemistry Department, California Poly-technic University, San Luis Obispo, CA.
Kligman, L.H., Sapadin, A.N., Schwartz, E., 1996. Peeling agents and irritants, unlike tretinoin, do not stimulate collagen synthesis in the photoaged hairless mouse. Arch. Dermatol. Res. 288, 615–629.
Larsson, K., 1994. Lipids: Molecular Oganization, Physical Functions and Tech-nical Applications, vol. 5. Oily Press.
Lasic, D.D., 1988. The mechanism of vesicle formation. Biochem. J. 256, 1–11. Leaist, D.G., 2002. Relating multicomponent mutual diffusion and intradiffu-sion for associating solutes. Application to coupled diffuintradiffu-sion in water-in-oil microemulsions. Phys. Chem. Chem. Phys. 4, 4732–4739.
Ma, Z., Friberg, S.E., Neogi, P., 2004. Single-component mass transfer in a cosurfactant–water–surfactant system. AIChE J. 35, 1678–1684.
MacEwan, K., Leaist, D.G., 2003. Quaternary mutual diffusion coefficients for aqueous solutions of a cationic–anionic mixed surfactant from moments analysis of Tayler dispersion profiles. Phys. Chem. Chem. Phys. 5, 3951–3958.
Miller, C.A., Neogi, P., 2004. Thermodynamics of microemulsions: combined effects of dispersion entropy of drops and bending energy of surfactant films. AIChE J. 26, 212–220.
Neogi, P., Kim, M., Friberg, S.E., 1985. Hydrocarbon extraction into a surfactant phase with non-ionic surfactants. II. Model. Sep. Sci. Technol. 20, 613–622. Robert, D.L., Marshell, R., Marks, R., 1980. Detection of the action of salicylic
acid on the normal stratum corenum. Br. J. Dermatol. 103, 191–196. Roeding, J., Artman, C., 1996. The salt of hydroxycarboxylic acids as
non-irritant, potent active substances. SOFW J. 121, 1018–1024.
Schick, M., 1992. Microscopic model of amphiphilic systems. In: Friberg, S.E., Lindman, B. (Eds.), Organized Solution: Surfactants in Science and Tech-nology. Marcel Dekker, New York, pp. 23–32.
Schramm, L.L., Stasiuk, E.N., Marangoni, D.G., 2003. Surfactants and their applications. Annu. Rep. Prog. Chem. 99, 3–48.
Shah, D.O., 1998. Micelles, Microemulsions and Monolayers Science and Tech-nology. Dekker, New York.
Simonnet, J.T., 1994. Lipid Vesicles Technology and Advances. Cosmet. Toi-letries Mag. 109, 45–52.
Sjoblom, J., 2001. Encyclopedia Handbook of Emulsion Technology. Dekker, New York.