• Nenhum resultado encontrado

J. Braz. Chem. Soc. vol.19 número5

N/A
N/A
Protected

Academic year: 2018

Share "J. Braz. Chem. Soc. vol.19 número5"

Copied!
6
0
0

Texto

(1)

A

r

ti

c

le

0103 - 5053 $6.00+0.00

*e-mail: tatiana@qmc.ufsc.br

Determination of Na and K in Biodiesel by Flame Atomic Emission Spectrometry and

Microemulsion Sample Preparation

Eduardo Sidinei Chaves,

a

Tatiana Dillenburg Saint’Pierre,*

,a

Eder José dos Santos,

b

Luciano Tormen,

a

Vera Lúcia Azzolin Frescura Bascuñan

a

and Adilson José Curtius

a

aDepartamento de Química, Universidade Federal de Santa Catarina, 88040-900 Florianópolis-SC, Brazil

bInstituto de Tecnologia do Paraná, TECPAR, 81350-010 Curitiba-PR, Brazil

Um método para determinação de Na e K em biodiesel proveniente de diferentes óleos vegetais é proposto. São combinadas as vantagens da FAES com a simplicidade da preparação da amostra por microemulsão e calibração usando padrões aquosos. As microemulsões foram preparadas pela mistura de biodiesel, n-propanol e solução aquosa ácida, permitindo o uso de padrões inorgânicos para a calibração. Foram comparadas a introdução discreta (DA) e aspiração contínua (CA) da amostra apresentando LODs semelhantes, na ordem de 0,1 g g-1 para ambos analitos, que são adequados para a determinação dos mesmos, conforme os limites estabelecidos na legislação brasileira. A exatidão do método foi avaliada por testes de recuperação, com resultados entre 83% e 120% e, por meio da comparação dos resultados obtidos por ICP OES.

A method for the determination of Na and K in biodiesel, from different vegetable oils, is proposed. The advantages of the FAES were combined with the simplicity of microemulsion preparation and calibration using aqueous standards. Microemulsions were prepared by mixing biodiesel samples with n-propanol and aqueous acid solution, which allowed the use of inorganic aqueous standards for the calibration. Sample introduction through discrete aspiration (DA) or by continuous aspiration (CA) were compared, presenting similar LODs, in the order of 0.1 g g-1 for both analytes, adequate to the established limits in the Brazilian legislation. The accuracy of the method was checked through recovery tests, with results between 83% and 120%, and through the comparison of the results with those obtained by ICP OES.

Keywords: biodiesel, microemulsion, FAES, sodium and potassium

Introduction

In the last decades, the demand for renewable fuels is increasing, since the sources of fossil fuels are limited.1,2

Moreover, the extensive use of petrol fuels caused massive emission of NOx, SOx and CO and environmental contamination by metals such like Cd, Co, Cu, Pb, V and Ni.3,4Biodiesel is the name of a low pollution and

biodegradable biofuel alternative to diesel.5 The combustion

of biodiesel is responsible for less carbon monoxide and hydrocarbons emissions and about the same for particulate matter and nitrous oxides, when compared to petroleum fuels. In addition, considering the carbon cycle, the CO2 emitted by the biodiesel combustion is fixed by the plants that will use it for the biodiesel production, therefore

not contributing for the greenhouse effect.6 Biodiesel is

produced by the transesterification of vegetable oils or animal fat with an alcohol and often employing NaOH or KOH added as a catalyst. This reaction produces alkyl esters from long chain fatty acid and glycerin, as a subproduct.1,5,7

The formation of ethyl esters is environmentally attractive because ethanol is produced from renewable resources,8 for

instance in Brazil, it is produced mainly from sugarcane. Biodiesel prepared in this way has been employed in Brazil blended to diesel in different proportions.2

As well as for any fuel, the determination of metals in biodiesel is important, since they can promote the decomposition of the fuel or corrosion of motor parts.9,10

(2)

engine parts wear (injector, fuel pump, piston, ring, etc.) and/or to deposits on the parts.11 According to the Brazilian

legislation, the maximum total concentration of these elements in biodiesel is 10 mg kg-1.10,12 The determination

of other elements, such as P, Ca and Mg is also important.10

The Brazilian Fuel Agency, ANP (Agência Nacional do Petróleo, Gás Natural e Biocombustíveis), rules the determination of Na and K in biodiesel following the standard British methods EN14108 (Na)13 and EN14109

(K)14, from 2003. By these methods, fatty acid methyl

esters samples diluted in xylene are analyzed by AAS with calibration against organic standards. Atomic absorption spectrometry (AAS) is a worldwide employed technique, with enough sensitivity for the determination of major organometallic compounds in fuels.15 However, xylene

is a toxic, non-miscible with water and volatile solvent,16

and the use of organic standards presents some difficulties, such as their instability. Since the use of biodiesel is still in the beginning, few methods have been proposed for its analysis. The determination of Na, K, Ca, Mg and P in biodiesel by inductively coupled plasma optical emission spectrometry (ICP OES) has been carried out by sample dilution with kerosene10 or ethanol17 and using an argon –

oxygen mixture as the nebulizer gas, in order to deal with the organic load in the plasma.

The analysis of viscous and complex samples, such as oils, requires often acid digestion or dilution with organic solvents, that can be responsible for analyte lost or contamination.18 Alternatively, organic samples may

be prepared as emulsion or microemulsion. Emulsion is a heterogeneous system made of two liquid phases, one of them dispersed in the other by means of a mechanical process. They are very unstable systems, due to the low miscibility of the liquids, although their stability can be improved by adding surfactants.19 On the other hand,

microemulsion is a thermodynamic stable system made of two immiscible liquids, one of them uniformly dispersed in the other as micro drops by means of a third component, that can be a surfactant or a co-solvent. In the latter case, an adequate solvent added in certain proportions is responsible for the homogeneity of the system, by interacting with both phases.20 This three-component system is a simple and fast

non-digesting way of sample preparation for oil and other fuel samples.

Alkaline elements are easily and efficiently atomized in flames. The feasibility and low cost make the flame atomic emission spectrometry (FAES) the most popular technique for sodium and potassium determination.21 In this

way, we propose to combine the advantages of the FAES with the simplicity of microemulsion preparation and with calibration using aqueous standards for the determination of

Na and K in biodiesel. Sample introduction will be carried out through discrete aspiration (DA) or by continuous aspiration (CA) using a pneumatic nebulizer.

Experimental

Instrumentation

The measurements were carried out with an AAnalyst 100 (Perkin Elmer, Norwalk, CT, USA), in the flame emission mode. The wavelengths were 766.5 nm for K and 589 nm for Na and a 0.2 nm spectral resolution was used for both analytes. The gas flame mixture was formed with 10.0 L min-1 air and 3.0 L min-1 acetylene (99.6%,

from White Martins, São Paulo, SP, Brazil). Peak area (8 s integration time) and peak height were measured using DA and CA systems, respectively. In the DA system, a 100 L sampling volume was introduced in the flame with a pipette by means of a micro funnel. The micro funnel was made of PTFE (3.3 cm diameter and concavity of 45º) and it was connected to the pneumatic nebulizer through a 30 cm long PTFE capillary.

The determination of the analytes in the same biodiesel samples was also carried out using a simultaneous axial view ICP OES spectrometer, model VISTA PRO (Varian, Mulgrave, Australia). The oxygen accessory AGM-1 (Varian) controls the oxygen introduction into the auxiliary argon gas flow before entering the torch. Argon with a purity of 99.996% from White Martins (São Paulo, Brazil) was used. The emission intensities were measured at 766.491 nm for K and 588.995 m for Na. Yttrium was employed as internal standard and measured at 371.025 nm. Peak height was used to quantify the signal, since the spectrometer software does not allow peak area measurements.

Reagents

All reagents were of analytical grade. Water was distilled and deionized (with a resistivity of 18.2 M ฀cm) in a Milli-Q Plus Millipore (Bedford, MA, USA). Hydrochloric acid (Merck, Darmstadt, Germany, PN K27703017) was sub-boiling distilled in a quartz distiller (Kürner Analysentechnik, Rosenheim, Germany). Cesium chloride (Merck, PN 3178181), was used as ionization suppressor. Absolute ethanol (GR 99.9%, PN 1.00983) and n-propanol (PN 506070) were also from Merck, as well as the of 1000 g mL-1 standard solutions of K (PN

(3)

Five biodiesel samples produced in the Instituto de Tecnologia do Paraná (TECPAR, Curitiba, PR, Brazil), from different oil sources were analyzed: fodder turnip (1), cottonseed (2), soybean (3), corn (4), and waste frying oils (5).

Microemulsion preparation

The microemulsions were prepared in 15 mL polypropylene flasks, by mixing 0.5 g biodiesel, 0.4 mL of a 5% m/v Cs solution, 100 µL hydrochloric acid and n-propanol to a 10 mL final volume, resulting in a visually homogeneous system. A maximum mass of 0.5 g biodiesel was employed for the microemulsion preparation, because higher masses require higher amounts of the ionization suppressor that precipitates under these conditions. The calibration microemulsions were prepared in the same way by mixing aqueous standards, mineral oil and n-propanol.

Analysis by ICP OES

In order to validate the proposed method, since there are no certified reference biodiesel samples, the samples were also analyzed by ICP OES in Instituto de Tecnologia do Paraná (TECPAR), following the methodology described by Santos et al.17 In that case, an oxygen-argon mixture

was the auxiliary plasma gas, the samples were prepared by diluting 1:10 (m/v) with ethanol and Y (III) was employed as internal standard.

Results and Discussion

Sample introduction and data acquisition

The use of different approaches for sample introduction requires different modes for data acquisition. The continuous aspiration uses the average signal intensity during a established time range, while the discrete aspiration uses the intensity peak area during a time range.

Microemulsion stability

The samples were prepared as microemulsions, by mixing biodiesel, an acidified 5% m/v Cs aqueous solution andn-propanol, as co-solvent, in the described proportions. The microemulsions were prepared in polypropylene flasks and the stability of Na and K concentrations in the biodiesel microemulsion and in an aqueous solution containing 0.2 mg L-1 Na and 0.5 mg L-1 K were checked every 30 min,

for 250 min. The signal was stable during the monitoring time, indicating stability of the analytes.

Sampling volume

Using the discrete aspiration, different sampling volumes were evaluated through the Na and K signal intensities. As expected, the analytes signal intensities increase with the increasing sampling volume, approaching the limit given by the continuous aspiration. As shown in Figure 1, there is a steep increase of the signal sensitivity up to 100 L, with a tendency of leveling off for higher volumes. For this reason and also because of better precision of results, a 100 L sample volume was selected for the determinations.

Interferences

In flame atomization, the solution aspiration rate and nebulization efficiency are strongly dependent on the physical properties of the solutions. Calibration and sample solutions should have the same properties, such as viscosity, surface tension, density and vapor pressure.20

Organic solvents, either pure or added to aqueous solutions promote an enhancement of the signal intensities in AAS. This change in the signal intensity is due to a change in the physical properties of the solutions.23 Organic solvents use

to have lower viscosity, and consequently, higher aspiration rate when compared to water. They usually also have lower surface tension that favors the formation of smaller aerosol drops. In addition, combustible solvents increase the flame temperature, improving the analytes atomization.

The analytes signal intensities in a microemulsion prepared with a mineral oil were compared with those

in n-propanol and in an aqueous solution. The three

solutions were spiked with inorganic standards to a final concentration of 0.2 mg L-1of Na and 0.5 mg L-1

of K. Highest intensities were obtained in n-propanol, lowest intensities with aqueous solution and intermediate

(4)

intensities in the microemulsion, as shown in Figure 2. For this reason, in order to minimize this transport interference, the calibration was carried out with aqueous standards prepared as microemulsions, similarly to the samples, but using a mineral base oil.

Analytical performance

Table 1 presents the figures of merit for the determination of Na and K in biodiesel prepared as microemulsion by FAES with continuum (CA) and discrete aspiration (DA). The limits of detection (LOD) and quantification (LOQ) are defined respectively as 3s/b and 10s/b, where s is the standard deviation of ten measurements of the blank and b is the slope of the calibration curve. The precision was evaluated as the relative standard deviation (RSD). In Table 1, the RSD range obtained for all samples are shown.

Both sample introduction systems promoted good linearity of the calibration curves (R2 > 0.999), LODs

lower than 0.1 g g-1 and RSD better than 7%. The slopes

of the calibration curves were higher and the precision was poorer in the DA system in comparison to the CA system,

consequently the LODs and LOQs were in the same order of magnitude for both sampling systems. The poorer precision obtained with the DA system may be due to the manual sample pipetting and to the discontinuous sample introduction. This effect could be minimized and the LODs probably improved with the use of a flow injection system or another commercial sample introduction system for discrete volumes. In a recent paper, Ghisi et al.24 showed

similar precision for the introduction with a microfunnel and with a flow injection (FI), the LODs obtained with the latter were better than with the microfunnel in the determination of Cd, Cu and Zn in biological samples.

Due to the lack of a biofuel certified reference material, the results were evaluated through recovery tests and compared to those obtained by ICP OES. Five biodiesel samples produced from different oil sources were analyzed: fodder turnip (1), cottonseed (2), soybean (3), corn (4), and waste frying oils (5). The results for Na and K in the biodiesel samples by FAES, as well as by ICP OES, are shown in the Table 2.

The obtained results are in agreement with those obtained by ICP OES, at a 95% confidence level. The biodiesel from fodder turnip was the only sample with Na + K concentration above the limit established by the National Oil Agency (ANP) administrative rule No. 42 of Nov 24, 2004. For all other samples, the concentrations were below the limit, showing the good efficiency in the removal of the catalysts used during the biodiesel production process. Recovery tests were carried out by the addition of 1 and 5 g g-1 of Na and K to the analyzed samples. Results

are shown in the Tables 3 and 4. Obtained recoveries with both sample introduction systems were acceptable, between 83% and 120%, showing that both systems are efficient and adequate for biodiesel sample introduction in the analysis by FAES. The choice of the sample introduction system is dependent on the available sample amount. The CA system requires about 2 mL of the sample microemulsion, while the DA requires only 100 L.

Figure 2. The effect of non-spectroscopic interferences on the relative intensities (n=3) of Na (0.2 mg L-1) and K (0.5 mg L-1) in aqueous standard

(„), in microemulsion („) and in n-propanol („).

Table 1. Figures of merit for the determination of Na and K in biodiesel by FAES with discrete aspiration introduction (DA) or with continuous aspiration (CA)

CA DA

Na K Na K

Slope* 0.3617 0.5305 1.2147 0.7465

R2 0.9992 0.9997 0.9990 0.9994

LOD ( g g-1) 0.08 0.09 0.10 0.06

LOQ ( g g-1) 0.3 0.3 0.3 0.2

RSD (n=3) (%) 2 - 5 0.4 - 4 3 - 6 2 - 7 * slope in (L mg-1), in CA mode and in (L mg-1 s), in DA mode.

Table 2. Concentrations of Na and K ( g g-1,n=3) in biodiesel samples

by FAES with discrete aspiration introduction (DA) or with continuous aspiration (CA) and by ICP OES

Na K

Sample 1 1 2 5

CA 3.73 0.11 63.76 0.50 3.10 0.06 2.18 0.16 DA

(5)

Conclusions

The proposed method for the determination of Na and K in biodiesel employs the FAES, a widespread technique, is simple, fast, precise and adequate for the limits established in the legislation. The sample preparation allowed the stabilization of the analytes during the time required for the analysis, the use of low volatile and low toxic solvents and the calibration with inorganic aqueous standards.

Both sample introduction modes were efficient, the DA has the advantage of requiring smaller sample amounts. The recoveries were adequate and the results were in agreement with those obtained by ICP OES.

References

1. Xie, W.; Huang, X.; Catal. Lett.2006,107, 53.

2. Pinto, A. C.; Guarieiro, L. L. N.; Rezende, M. J. C.; Ribeiro, N. M.; Torres, E. A.; Lopes, W. A.; Pereira, P. A. de P.; de Andrade. J. B.; J. Braz. Chem. Soc.2005,16, 1313.

3. Kulkarni, M. G.; Dalai, A. K.; Ind. Eng. Chem. 2006,45, 2901.

4. Wang, Ya-Fen.; Huang, Kuo-Lin.; Li, Chun-Teh.; Mi, Hsiao-Hsuan.; Luo, Jih- Haur.; Tsai, Perng-Jy.; Atmos. Environm. 2003,37, 4637.

Table 3. Measured concentrations of Na ( g g-1,n=3) in the biodiesel samples, after adding 1 and 5 g g-1, by FAES with discrete aspiration introduction

(DA) or with continuous aspiration (CA) and the recovery ranges

CA

Sample 1 2 3 4 5

Addition 1 g g

-1 4.92 1.07 0.94 0.89 1.07

5 g g-1 8.47 5.41 4.78 5.11 4.17

Recovery (%) 95 - 119 107 - 108 94 - 96 89 - 102 84 - 107

DA (100 L)

Sample 1 2 3 4 5

Addition 1 g g

-1 4.79 1.00 1.20 0.84 0.89

5 g g-1 8.94 5.29 5.10 5.81 4.17

Recovery (%) 105 - 114 100 - 106 102 - 120 84 -116 83 - 88

Table 4. Measured concentrations of K ( g g-1,n=3) in the biodiesel samples, after adding 1 and 5 g g-1, by FAES with discrete aspiration introduction

(DA) or with continuous aspiration (CA) and the recovery ranges

CA

Sample 1 2 3 4 5

Addition 1 g g

-1 64.75 4.06 1.20 1.20 3.27

5 g g-1 68.00 8.60 5.32 4.94 6.35

Recovery (%) 85 - 99 96 - 110 106 - 120 99 - 120 87-109

DA (100 L)

Sample 1 2 3 4 5

Addition 1 g g

-1 61.18 3.99 1.16 1.20 3.11

5 g g-1 66.24 8.32 5.34 5.54 7.08

Recovery (%) 94 - 120 97 - 106 107 - 116 111 - 120 100 - 103

5. Ramadhas, A. S.; Jayaraj, S.; Muraleedharan, C.; Renew. Energ. 2004,29, 727.

6. Peterson, C. L.; Hustrulid, T.; Biomass Bioenerg. 1998,14, 91. 7. Felizardo, P.; Correia, M.J.N.; Raposo, I.; Mendes, J. F.;

Berkemeier, R.; Bordado, J. M.; Waste Manage. 2006, 26, 487.

8. Kulkarni, M. G.; Dalai, A. K.; Bakhshi, N. N.; Bioresour. Technol.2007,98, 2027.

9. Saint’Pierre, T. D.; Dias, L. F.; Maia, S. M.; Curtius, A. J.; Spectrochim. Acta, Part B2004,59, 551.

10. Edlund, M.; Visser, H.; Heitland, P.; J. Anal. At. Spectrom.2002, 17, 232.

11. Oasmaa, A.; Czernik, S.; Energ. Fuel.1999,13, 914. 12. Agência Nacional do Petróleo, Gás Natural e Biocombustíveis,

Resolução ANP Nº 42, de 24.11.2004 – DOU 9.12.2004 – Ret. DOU 19.4.2005. In http://www.anp.gov.br, accessed in 09/21/2007.

13. Fat and oil derivates - Fatty acid methyl esters (FAME) - Determination of sodium content by atomic absorption

spectrometry. BS EN 14108 / 2003. In http://www.

standardsdirect.org/standards/, accessed in 09/21/2007. 14. Fat and oil derivates - Fatty acid methyl esters (FAME) -

Determination of potassium content by atomic absorption

spectrometry. BS EN 14109 / 2003. In http://www.

(6)

15. Du, B.; Wei, Q.; Wang, S.; Yu, W.; Talanta1997,44, 1803. 16. Otenio, M. H.; da Silva, M. T. L.; Marques, M. L. O.; Roseiro,

J. C.; Bidoia, E. D.; Braz. J. Microbiol.2005,36, 258. 17. dos Santos, E.J.; Herrmann, A. B.; Chaves, E. S.; Vechiatto, W.

W. D.; Schoemberger, A. C.; Frescura, V. L. A.; Curtius, A. J.; J. Anal. At. Spectrom.2007,22, 1300.

18. Huang, S. J.; S. Jiang.; J. Anal. At. Spectrom.2001,16, 664. 19. Saint’Pierre, T. D.; Dias, L. F.; Pozebon, D.; Aucélio, R. Q.;

Curtius, A. J.; Welz, B. Spectrochim. Acta, Part B2002,57, 1991.

20. Aucélio, R. Q.; Curtius, A. J.; J. Anal. At. Spectrom.2002,17, 242.

21. Sokolnikova, J. V.; Vasilyeva, I. E.; Menshikov, V. I.; Spectrochim. Acta, Part B2003,58, 387.

22,. Mora, J.; Hernandis,V.; Canals, A.; J. Anal. At. Spectrom.1991, 6, 537.

23. Todorovic, M.; S, Vidovic.; Llic, Z.; J. Anal. At. Spectrom.1993, 8, 1113.

24. Ghisi, M.; Ribeiro, A. S.; Vieira, M. A.; Curtius, A. J.; Rev. Analytica2007,28, 58.

Received: August 14, 2007

Imagem

Figure 1. Emission intensities signals for Na and K employing different  sampling volumes
Table 1. Figures of merit for the determination of Na and K in biodiesel  by FAES with discrete aspiration introduction (DA) or with continuous  aspiration (CA) CA DA Na K Na K Slope* 0.3617 0.5305 1.2147 0.7465 R 2 0.9992 0.9997 0.9990 0.9994 LOD ( g g -1
Table 4. Measured concentrations of K ( g g -1 , n=3) in the biodiesel samples, after adding 1 and 5  g g -1 , by FAES with discrete aspiration introduction  (DA) or with continuous aspiration (CA) and the recovery ranges

Referências

Documentos relacionados

The calibration curves obtained with calibration standards prepared in reagent water (aqueous standards) and serum matrix (patients who do not use lithium as treatment)

When MWCNTs were dispersed in AuNPs colloid with the aid of ultrasonic agitation, a black and homogenous suspension could be obtained. It was quite stable; no precipitate

9 The activation parameters for CO exchange, and tentative values for PMe 3 substitution (but under not very well defined conditions 3 ), lay between those for reaction in

In order to gain insight into the degradation mechanisms and evaluate the electronic structure of this organic material used with good results as hole transporting layer (HTL) in

Indium(III)-Catalyzed Synthesis of N -Substituted Pyrroles under Solvent-Free Conditions.. Jiu-Xi Chen, Miao-Chang Liu, Xiao-Liang Yang, Jin-Chang Ding and

In Figure 4b, mean, minimum, and maximum values of the interatomic distances (pair displacement distributions) are demonstrated for Cu 2 –Cu 45 clusters as a function of the

For comparison with the titanium dioxide film prepared from TMPSi-aqueous solution (ATMPSi), another titanium dioxide film was prepared using the same concentration of

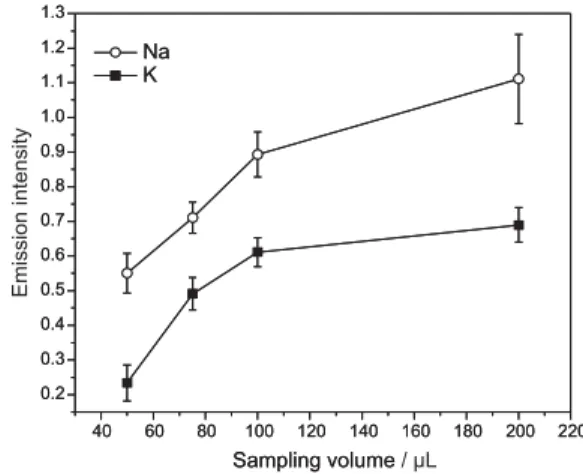
External calibration curves were prepared with mineral oil in formic acid and Triton X-100 and the analyte addition curves were prepared by spiking the emulsions of the biodiesel