Rapid sequence divergence rates in the 5 prime regulatory regions
of young
Drosophila melanogaster
duplicate gene pairs
Michael H. Kohn
Ecology and Evolutionary Biology, Rice University, Houston, Texas, United States of America.
Abstract
While it remains a matter of some debate, rapid sequence evolution of the coding sequences of duplicate genes is characteristic for early phases past duplication, but long established duplicates generally evolve under constraint, much like the rest of the coding genome. As for coding sequences, it may be possible to infer evolutionary rate, selec-tion, and constraint via contrasts between duplicate gene divergence in the 5 prime regions and in the corresponding synonymous site divergence in the coding regions. Finding elevated rates for the 5 prime regions of duplicated genes, in addition to the coding regions, would enable statements regarding the early processes of duplicate gene evolution. Here, 1 kb of each of the 5 prime regulatory regions ofDrosophila melanogaster duplicate gene pairs were mapped onto one another to isolate shared sequence blocks. Genetic distances within shared sequence blocks (d5’) were found to increase as a function of synonymous (dS), and to a lesser extend, amino-acid (dA) site divergence be-tween duplicates. The rate d5’/dSwas found to rapidly decay from values > 1 in young duplicate pairs (dS< 0.3) to 0.28 or less in older duplicates (dS> 0.8). Such rapid rates of 5 prime evolution exceeding 1 (~neutral) predominantly were found to occur in duplicate pairs with low amino-acid site divergence and that tended to be co-regulated when as-sayed on microarrays. Conceivably, functional redundancy and relaxation of selective constraint facilitates subse-quent positive selection on the 5 prime regions of young duplicate genes. This might promote the evolution of new functions (neofunctionalization) or division of labor among duplicate genes (subfunctionalization). In contrast, similar to the vast portion of the non-coding genome, the 5 prime regions of long-established gene duplicates appear to evolve under selective constraint, indicating that these long-established gene duplicates have assumed critical func-tions.
Key words:gene duplication, gene expression, selection, promoter evolution.
Received: October 23, 2007; Accepted: March 13, 2008.
Introduction
The alignment of orthologous sequences sampled from two or more related species can reveal evolutionarily conserved sequence blocks, an approach referred to as ‘phylogenetic footprinting’ (e.g.Fickett and Wasserman, 2000). The approach relies on the assumption that sequence blocks that contain functionally important motifs evolve under functional constraint (purifying selection), and thus, remain similar in their sequence over long periods of time (e.g. Koop, 1995). In contrast, alignments of non-func-tional sequences that evolve free of such constraint usually are less clear or not significant (Bergman and Kreitman, 2001). Overall, the footprint of varying degrees of selective constraint along alignments of orthologous, or homolo-gous, sequences is manifest as a mosaic pattern of aligned
and non-aligned sequence blocks (Bergman and Kreitman, 2001; Shabalinaet al., 2001; Bergmanet al., 2002; Cas-tresana, 2002; Webbet al., 2002). In non-coding sequen-ces, such as enhancers and promoters, sequence blocks conserved between orthologs may be enriched for potential transcription factor binding sites (Fickett and Wasserman, 2000; Berman et al., 2002). As more whole genome se-quences begin to accumulate in the databases, comparative genomic approaches have become widely applied to aid with the annotation and evolutionary study of non-coding DNA (de Meaux, 2006; Habereret al., 2006; Li and Ste-phan, 2006; Hahn, 2007; Thomaset al., 2007).
A wide range of evolutionary divergence times is cap-tured within a single genome through the duplication of genes and their subsequent divergence (e.g.Ohno, 1970; Lynch and Conery, 2000; Conery and Lynch, 2001). Pre-sumably, the extent to which gene duplicates, or paralagous genes, occur in the genome reflects their potential to pro-vide a source for biological adaptation and diversification (e.g.Zhanget al., 1998; Lynch and Conery, 2000; Conant
www.sbg.org.br
Send correspondence to Michael H. Kohn. Ecology and Evolution-ary Biology, Rice University, MS 170, P.O. Box 1892, 77005-1892 Houston, Texas, United States of America. E-mail: hmkohn@ rice.edu.
and Wagner, 2002; Guet al., 2002a; Hughes, 2002; Zhang, 2003). In recognition of the pivotal role gene duplication may play in evolution the mechanisms driving their origins and preservation have been a vibrant field of study that is experiencing a renaissance owing to the ever-growing number of genome sequencing projects (e.g.Ohno, 1970; Ohta, 1987; Clark, 1994; Hughes, 1994; Ohta, 1994; Walsh, 1995; King, 1998; Forceet al., 1999; Lynch and Force, 2000; Wagner, 2001; Hughes, 2002; Wagner, 2002a; Zhang, 2003; Taylor and Raes, 2004).
Whereas the origin and subsequent silencing of dupli-cate genes both appear to be frequent events, the evolution-ary trajectories conducive to duplicate gene preservation may be restrictive (Forceet al., 1999; Lynch and Force, 2000). Importantly, the complement of functional duplicate genes that is sampled by genome sequencing projects and that can be studied for their molecular evolution should be comprised predominantly of those that have passed the ‘se-lective sieve’. In other words, gene duplications detrimen-tal to fitness have been removed by purifying selection and gene duplications free of selective constraint may have un-dergone mutations that rendered them non-functional pseudogenes whose evolution is governed by drift. Func-tional diversification of duplicates leading to the evolution of novel functions (neo-functionalization), or the partition-ing of labor between them (sub-functionalization) could provide avenues for escape from non-functionalization and loss, because purifying selection would remove detrimental mutations from the functional duplicate genes once these have become indispensable (Ohta, 1988; Basten and Ohta, 1992; Hughes, 1994; Walsh, 1995; Force et al., 1999; Lynch and Force, 2000; Wagner, 2002a,b).
Mutations in the 5 prime cis-regulatory regions of gene duplicates may promote functional diversification of duplicate genes (Wagner, 2000; Guet al., 2002b; Makova and Li, 2003; Pappet al., 2003). To examine this possibility the 5 prime regulatory regions of gene duplicates could be searched for the footprint regulatory diversification, be it through positive selection or the loss of constraint (i.e. neu-tral processes), may have left. One such approach would be to compare the rate of divergence in the 5 prime regions rel-ative to that at synonymous sites (Bird et al., 2006; Eyre-Walker, 2006; Hahn 2007), as long as it is assumed synonymous sites follow neutral dynamics (see Akashi, 1995).
Here the evolution of 5 prime regulatory sequences of duplicate gene pairs in theD. melanogastergenome was studied. Specifically, (i) 1 kb of each of the 5 prime regions of the two members of a duplicate gene pairs identified pre-viously (Lynch and Conery, 2000; Conery and Lynch 2001) were aligned. It was assumed that blocks of aligned sequence indicate regions of homology preserved owing to their recent divergence and/or by purifying selection. In analogy to phylogenetic footprinting this approach has been dubbed ‘intragenomic footprinting’ (Haberer et al.
2004; Habereret al.2006). (ii) Divergence of the 5 prime regions of duplicate gene pairs (d5’) was expressed relative to divergence at synonymous sites (dS) and amino-acid re-placement sites (dA) in these gene pairs. This is analogous to studies considering rates of coding sequence evolution of duplicate genes (e.g.Ohta, 1994; Lynch and Conery, 2000; Barrieret al., 2001; Conery and Lynch, 2001; Thornton and Long, 2002; Kondrashov, 2005; Kondrashov and Kon-drashov, 2006). (iii) Gene expression data from microarray experiments was compiled and related toDrosophila dupli-cate gene divergence (c.f. Wagner, 2000; Guet al., 2002b; Makova and Li, 2003; Castillo-Daviset al., 2004; Haberer
et al., 2004; Casneufet al., 2006; Wanget al., 2006; Tirosh and Barkai, 2007).
Methods
Collection and analysis of sequence data: The identi-fication numbers for a set of 456D. melanogasterduplicate gene pairs (Lynch and Conery, 2000, Conery and Lynch, 2001) were retrieved from (http://www.csi.uoregon.edu/ projects/genetics/duplications/D.melanogaster.txt) and 1 kilobase (kb) of the nucleotide sequences annotated as the upstream 5 prime flanking regions and 5 prime untranslated regions (5’ UTR) were retrieved for each gene via the Berkley Drosophila Genome Project (BDGP, Release 2) (http://www.fruitfly.org). Estimates of synonymous site di-vergence (dS) and amino acid replacement site divergence (dA) for the protein coding sequences of each duplicate gene pair were adopted from Lynch and Conery (2000) and Conery and Lynch (2001), who deduced them using PAML (Yang, 1997).
Duplicate gene pairs were grouped into divergence bins: dS< 0.1 (N = 19), 0.1 < dS< 0.25 (N = 20), 0.25 < dS< 0.5 (N = 27), 0.5 < dS < 0.75 (N = 15), 0.75 < dS < 1.0 (N = 14), 1.0 < dS< 1.25 (N = 14), 1.25 < dS< 1.5 (N = 17) and dS > 1.5 (N = 274). Young duplicated genes (e.g. dS< 1.0) were comparatively scarce (N = 95 or ~22.5%) in this dataset, and in the Drosophila genome as a whole (Lynch and Conery, 2000; Conery and Lynch, 2001; Co-nant and Wagner, 2002; Guet al., 2002b; Thornton and Long, 2002). Similarly, dAvalues were grouped into bins: dA< 0.1 (N = 76), 0.1 < dA< 0.2 (N = 97), 0.2 < dA< 0.3 (N = 65), 0.3 < dA< 0.4 (57), 0.4 < dA< 0.5 (N = 43) and dA> 0.5 (N = 86). It was assumed that gene conversion has not affected the estimation of genetic distances between gene duplicates.
A non-redundant set of 5 prime regions of D.
melanogaster genes (set of single-copy genes) retrieved
from http://www.fruitfly.org/seq_tools/datasets/ Drosophila/promoter/ (Ohleret al., 2002) was analyzed for comparison. The 5 prime regions of the duplicate genes and of the set of single-copy genes had similar GC contents (40.3 and 41.2%). Both datasets were screened for the pres-ence of sequpres-ence elements known to occur in the
us-ing the settus-ings for insect genomes (http://repeatmasker.ge-nome.washington.edu/cgi-bin/RepeatMasker) (Thompson
et al., 1994), masked with “N”, and excluded prior to align-ment.
As done by Bergman and Kreitman (2001) the align-ments of the 5 prime regions of each duplicate gene pair were done using the Dialign software (setting T = 1) (Mor-genstern, 1999). For comparison, 5,000 alignments of ran-domly paired 5 prime regions drawn from the set of single-copy genes were done. Even if the Dialign alignment proce-dure may have its biases, as most proceproce-dures do, the com-parison between the alignments of the 5 prime regions of duplicate genes and the alignments of randomly paired sin-gle copy genes should enable qualitative and quantitative statements regarding the significance of the sequence simi-larities observed in the 5 prime regions of the duplicate genes. Regions in the 5 prime regions that were aligned were converted as capital letters in the Fasta-formatted Dialign output. Aligned regions at least 10 nucleotides long were extracted and concatenated. The percentages of nu-cleotides that fell within such aligned regions was noted and referred to as 5 prime similarities (Table S1). Subse-quently, for each alignment the number of perfectly matched base pairs within each aligned region was com-puted, leading to an estimate of sequence similarity within them (5 prime block similarity, Table S1). 5 prime block similarity values were transformed into a genetic distance (d5’) using the HKY method (Hasegawaet al., 1985) as im-plemented in PAML.
Distance estimation at high divergence levels can be associated with errors. Therefore, no attempt was made to resolve divergence times of dS> 1.5. The estimation of very low synonymous divergence levels also can be associated with errors, in particular when the examined genes are short in length. To address this issue all 95 duplicate gene pairs with dSup to 1 were re-analyzed to obtain estimates of d5’ and d5’/ dSthat should be less likely to be affected by sto-chastic sampling. Specifically, first, sequences were ex-tracted and aligned using the Dialign software. Second, Kimura’s 2 parameter method was used to estimate d5’, dS, and dAfor each gene separately (Figure S1 and Table S2). Third, divergence times d5’, dS, and dAwere deduced from the concatenated sequences, the latter allows to obtain a weighted (by gene length) average of divergence times that should be less prone to stochastic sampling. For the concat-enation process duplicate genes were grouped into the di-vergence bins dS< 0.1 (N = 17), 0.1 < dS< 0.2 (N = 25), 0.2 < dS< 0.3 (N = 16), 0.3 < dS< 0.4 (N = 13), 0.4 < dS< 0.5 (N = 2), 0.5 < dS < 0.6 (N = 5), 0.6 < dS < 0.7 (N = 4), 0.7 < dS< 0.8 (N = 3), 0.8 < dS< 0.9 (N = 3), 0.9 < dS< 1.0 (N = 4).
Analysis of co-regulation of gene duplicates: Gene expression data from 267 Affymetrix GeneChips represent-ing six independent investigations on D. melanogaster
were retrieved from
http://jbiol.com/content/supplemen-tary/1475-4924-1-5-S1.txt (Spellman and Rubin, 2002). These dealt with embryo development, aging, DNA dam-age, immune response, and DDT resistance in adult flies and embryos subjected to 88 distinct conditions or experi-mental manipulations. For the description of the gene ex-pression data and their analysis see Spellman and Rubin (2002). Here, Pearson’s correlation coefficient (R) was computed across the expression levels provided by Spel-lman and Rubin (2002) to quantify the degree of co-regu-lation of duplicate genes. R was transformed using the expression ln((R+1)/R-1)) (Gu et al., 2002b; Gu and Su 2007) and referred to as ln(R). The transformation of R into ln(R) enabled the analysis of sequence divergence and gene expression using linear regression (Guet al., 2002b). The expectation was that co-regulated duplicate genes would display high ln(R)-values when calculated over a series of conditions, because more similar regulatory regions should mediate more similar responses. For comparison, sampling with replacement from the expression profiles of the dupli-cate genes was done to yield 5,000 ln(R)-values computed between 10,000 randomly paired genes (Figure S2).
Results
Levels of 5 prime sequence similarities between du-plicate genes: Alignments of the 5 prime non-coding re-gions of duplicate gene pairs resulted in a mosaic of aligned and non-aligned stretches of sequence. Only a percentage of sites in the 5 prime regions of duplicate genes fell within aligned stretches of sequence. Specifically, 5 prime simi-larities, a number that summarizes the percentage of nucle-otide sites that fell within aligned stretches of sequence, were between 2 and 60% (median, 20.0%, mean 21.6%, 95% CI of mean, 20.4-22.1%) (Figure S3). 5 prime similar-ities were weakly correlated with synonymous and amino acid replacement site divergence between duplicate gene pairs (ANOVA, Fratio13.2, R2= 0.06, p < 0.001 and Fratio 6.7, R2= 0.03, p = 0.0014, respectively).
The distribution of 5 prime block similarity values derived from the alignments of duplicate genes was com-pared to the distribution derived from 5,000 alignments of randomly paired genes (Figure 1). The expectation was that the 5 prime regions of randomly paired single-copy genes should reflect the degree to which DiAlign generated align-ments between unrelated 5 prime regions of genes. For ~26% of random alignments no regions of any similarity were found that were 10 bp or longer. For a lower percent-age 38/456 (~9%) of the duplicate gene pair dataset DiAlign could not identify such sequence blocks. These were excluded because they cannot be analyzed within a framework that considers per nucleotide site divergence rates. Their omission should have introduced a bias towards higher average levels of 5 prime block similarities among duplicate genes.
were obtained from random alignments (Figure 1). Spe-cifically, whereas the distribution of 5 prime block similar-ity scores that was based on alignments of randomly paired genes had a mean 5 prime block similarity of 0.553 (95% CI of mean: 0.552-0.555), mean 5 prime block similarity in alignments of the 5 prime regions of duplicate genes was 0.723 (95% CI: 0.717-0.729). The distribution of 5 prime block similarities between randomly paired single-copy genes was normally distributed, and was used to deduce the probability P to observe 5 prime block similarity values that were observed in the duplicate gene pairs after correction for multiple testing with the Bonferoni method. Forty-four duplicate gene pairs had average 5 prime block similarities that were not significant (< 0.67, n.s.), but 373 had average block similarities that exceeded random levels (= 0.67, p = 0.01). In total, average 5 prime block similarity between the 5 prime regions of duplicate genes was between 0.6 and 0.7 for 158 (34.6%) duplicate pairs, 0.7-0.8 for 216 (47.3%) pairs, 0.8-0.9 for 32 (7.0%) pairs, and 0.9-1.0 (2.4%) for 11 pairs. Thus, while DiAlign tended to find short sequence
blocks even between 5 prime regions of random pairs of single copy genes, sequence similarity in the set of sin-gle-copy genes generally remained below those deduced from alignments of duplicated genes. For rate calculations below it was assumed that sequence similarities among the 5 prime regions of duplicated genes reflect sequence homo-logy.
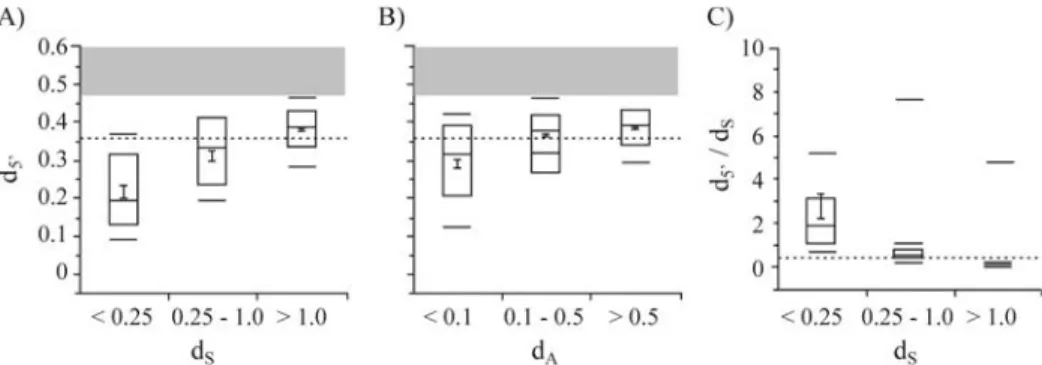
A contrast between d5’and dS should enable infer-ences concerning the role of drift and selection on the evo-lution of the 5 prime regions of duplicated genes. Here it was found that d5’ significantly increased with dS (Fig-ure 2A, p < 0.0001, FRatio= 79.5, R2= 29%, ANOVA). This was less pronounced when d5’was related to dA(Figure 2B, p < 0.0001, FRatio= 24.6, R2= 11%, ANOVA). In addition, a decay of d5’/dSas a function of dS (Figure 2C, p < 0.001, FRatio= 109.8, R2= 36, ANOVA), and to a less systematic degree dA(not shown, p < 0.001, FRatio= 38.9, R2= 16%, ANOVA), was observed. Values for d5’/dS larger than 1 were observed for nearly all, ~50%, and ~10% of duplicate pairs with dS< 0.1, 0.1-0.25, and > 0.25-0.5, respectively. Duplicate gene pairs with dS< 0.25 had mean and median d5’/dSvalues exceeding 1. Thus, rapid rates of 5 prime block evolution close to 1, or exceeding 1, predominantly oc-curred in young duplicated genes, and these high rates were suggestive of relaxed constraint and/or positive selection. In contrast, the rate of 5 prime evolution observed slowed relative to that at synonymous sites, a pattern consistent with purifying selection and functional constraint. How-ever, other homogenizing forces, such as gene conversion, should be considered as well.
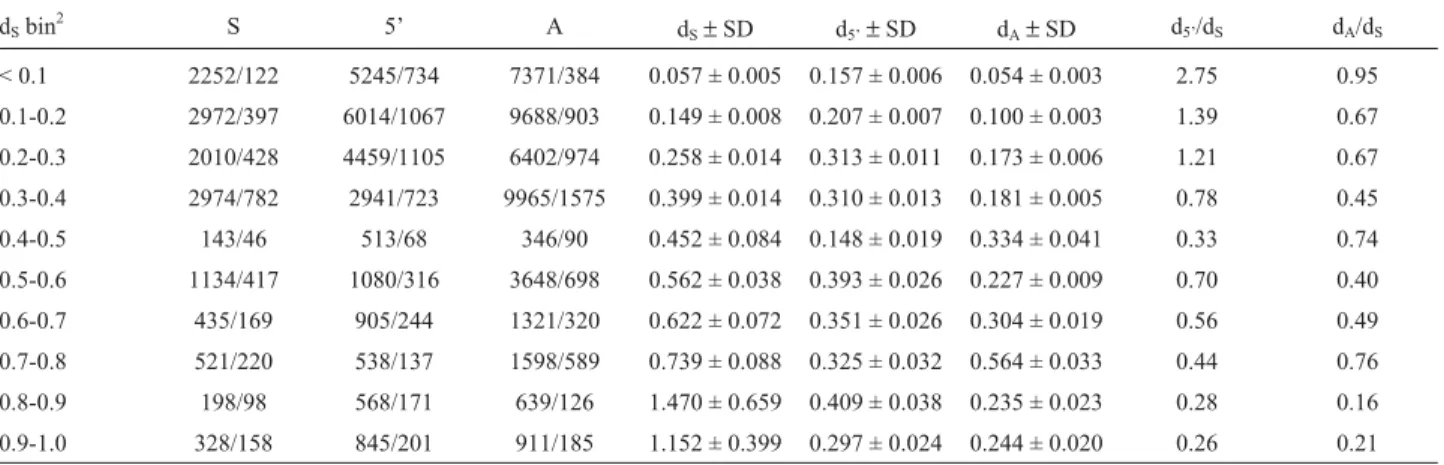
To obtain d5’/dSrates less likely affected by stochastic sampling of sites from individual gene pairs with low dS, the sequences of duplicate gene pairs with dS< 1 were con-catenated in bins (c.f. Table 1). Bins with a weighted aver-age of dS < 0.3 displayed d5’/dS ratios > 1 (Table 1). The corresponding average of dA was 0.173 (Table 1). Thus, high rates of 5 prime sequence block evolution between young duplicate genes were not caused by the inclusion of a few genes with particularly high d5’/dS. The d5’/dSratios of
Figure 1- The distribution of 5 prime block similarity values that were obtained from alignments of the 5 prime regions of duplicate gene pairs of theD. melanogastergenome (filled bars) and alignments of the 5 prime regions of randomly paired single copyD. melanogastergenes (open bars). The shaded area depicts the 99% range of 5 prime block similarity values obtained from alignments of the 5 prime region of randomly paired single copy genes.
Figure 2- The average genetic distance within aligned sequence blocks (d5’) in relation to synonymous (A) and amino-acid site (B) divergence (dSand dA,
respectively), and the evolutionary rate d5’/dS. The following quantiles are shown: 90%, 75%, mean (1 SE), median, 25%, and 10%. The means of the bins
more divergent duplicate gene pairs remained smaller than 1 in the concatenated data sets. The use of the concatenated sequences should provide conservative, i.e. lower, esti-mates for the rate d5’/dS. This was most notable in the diver-gence bin dS< 0.1, where the average rate d5’/dScomputed as the mean over individual duplicate gene pairs yielded a value close to 7 (c.f. Table S2 for divergence estimates and rates derived from individual duplicate gene pairs). In con-trast, when estimated from the concatenated sequences, a d5’/dSvalue of 2.75 was obtained. Similarly, the rates d5’/dS obtained for the remaining divergence bins were lower than the corresponding d5’/dSvalues calculated as the mean over individual duplicate gene pairs. Taken together, the decay of d5’and d5’/dSas function of dSwas suggestive of a phase of accelerated evolution in the 5 prime regions of young du-plicated genes,i.e.those with dS< 25%-30%. This was also true, qualitatively, when each individual duplicate gene pair was examined (Table S2).
Masked sequences in the 5 prime regions of duplicate genes: Besides nucleotide substitution, a range of possible other mutational events following gene duplication may
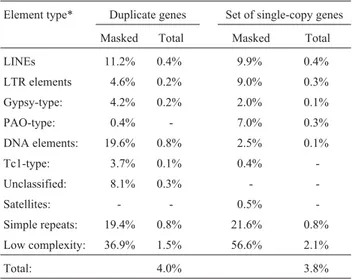
al-ter the functionality of 5 prime regulatory sequences. These involve the insertion or deletion of various types of se-quence elements (retro-elements and low-complexity/re-peat sequences), or the insertion of the duplicate gene copies into regions that already were densely occupied by such sequence elements. As a proxy for the frequency of such events, the percentage of 5 prime sequence occupied by sequence elements that was recognized and masked by the RepeatMasker software was tabulated (Table 2). On av-erage, only 4% of the total sequence data covering the 5 prime regions of duplicate genes were masked. A similar percentage (3.8%) was masked in the single-copy 5 prime regions, indicating that the majority of the duplicated 5 prime regions were not atypical with respect to such se-quence elements when compared to 5 prime regions of sin-gle copy genes.
For about 10% of duplicate pairs masked sequences occupied as much as 18%-77% of the 5 prime region, indi-cating that larger-scale insertions or deletions of elements could affect the function of the 5 prime region. Simple re-peats and low complexity-type sequences occupied the
Figure 3- The relationship between the correlation of gene expression, ln(R), betweenD. melanogasterduplicate gene pairs and their synonymous (A) and amino-acid site (B) divergence (dSand dA, respectively), and the evolutionary rate d5’/dS. Correlation of gene expression is expressed as the
trans-formed Pearson’s correlation coefficient over experimental conditions (see methods). The following quantiles are shown: 90%, 75%, mean (1 SE), me-dian, 25%, and 10%. Only the means of the two bins dS< 0.25 and 0.25 < dS< 1 differ atα= 0.0001 (A) and dA< 0.1 and 0.1 < dA< 0.5 differ atα= 0.0001
(B) (Student’s t-test). No further significant differences were found between any of the remaining bins given in the methods section. The grand mean is de-picted by the dotted line. The shaded area represents the 99% range of ln(R) values obtained from a randomized dataset (c.f. Figure S2).
Table 1- Divergence levels1at synonymous sites (S), in the 5 prime regions (5’), and at amino-acid replacement sites (A) sites, and the resulting rates
d5’/dSand dA/dS.
dSbin2 S 5’ A dS±SD d5’±SD dA±SD d5’/dS dA/dS
< 0.1 2252/122 5245/734 7371/384 0.057 ± 0.005 0.157 ± 0.006 0.054 ± 0.003 2.75 0.95
0.1-0.2 2972/397 6014/1067 9688/903 0.149 ± 0.008 0.207 ± 0.007 0.100 ± 0.003 1.39 0.67
0.2-0.3 2010/428 4459/1105 6402/974 0.258 ± 0.014 0.313 ± 0.011 0.173 ± 0.006 1.21 0.67
0.3-0.4 2974/782 2941/723 9965/1575 0.399 ± 0.014 0.310 ± 0.013 0.181 ± 0.005 0.78 0.45
0.4-0.5 143/46 513/68 346/90 0.452 ± 0.084 0.148 ± 0.019 0.334 ± 0.041 0.33 0.74
0.5-0.6 1134/417 1080/316 3648/698 0.562 ± 0.038 0.393 ± 0.026 0.227 ± 0.009 0.70 0.40
0.6-0.7 435/169 905/244 1321/320 0.622 ± 0.072 0.351 ± 0.026 0.304 ± 0.019 0.56 0.49
0.7-0.8 521/220 538/137 1598/589 0.739 ± 0.088 0.325 ± 0.032 0.564 ± 0.033 0.44 0.76
0.8-0.9 198/98 568/171 639/126 1.470 ± 0.659 0.409 ± 0.038 0.235 ± 0.023 0.28 0.16
0.9-1.0 328/158 845/201 911/185 1.152 ± 0.399 0.297 ± 0.024 0.244 ± 0.020 0.26 0.21
1The number of sites surveyed in base pairs (first number) and the number of divergent sites (second number). 2
largest percentage of the masked sequence (Table 2). There was a trend towards higher percentages of masked se-quence (median > 10%) in comparatively young (dS~25% or less) duplicate gene pairs when compared to the usually less than 5% masked sequence in duplicate gene pairs sepa-rated by dSvalues > 25%. Perhaps, some of these repeats or low-complexity-type sequences are deleterious or form the basis for the evolution of motifs not recognized by RepeatMasker. However, the percentage of 5 prime se-quence masked by RepeatMasker was not significantly re-lated to dS(not shown).
Evolution and expression of 5 prime sequences of du-plicate genes: In yeast, young dudu-plicate gene pairs tend to be more similar in their expression than are old duplicate pairs (Guet al., 2002a; Pappet al., 2003; but see Wagner, 2000). Correlation of gene expression between duplicated genes might be a useful proxy for functional equivalence (Guet al., 2002c). Here, an analysis of the co-regulation of gene duplicates, as inferred from ln(R), showed that about 40% ofD. melanogaster duplicate pairs were above the 99% range of randomly generated ln(R)-values (-0.79 and +0.99) and 10% were below that (c.f. Figure S1). Thus, half of the examined duplicate gene pairs conformed to random expectations. Co-regulation of duplicate genes may be 4 times more common than extreme divergence in regulation.
The correlation of expression of duplicate genes, ex-pressed as ln(R), was found to decay as duplicate genes di-verged at synonymous sites and at amino-acid replacement sites, but the relationships were weak. Specifically, a reduc-tion of ln(R) between dS< 0.25% (mean ln(R) = 1.8±0.2, median 1.49) and dS> 0.25 (mean ln(R) = 0.79±0.1, me-dian 0.64) was observed, but no further systematic trend was observed at higher divergence levels. Moreover, at
high dSthe median and mean of ln(R) remained compatible with random expectations (Figure S1). However, expres-sion was assayed over the whole fly, larvae, and embryos (Spellman and Rubin, 2002), such that only limited power would be expected to detect diversification of expression between gene duplicates e.g. at the level of tissues (c.f. Makova and Li, 2003). Overall, theDrosophiladata fell in between the previously observed strong correlation be-tween ln(R) and dS(Guet al., 2002a) and a much weaker such relationship (Wagner, 2000), both observed in yeast. However, in this study emphasis was placed on the expres-sion divergence after only 25 percent synonymous site di-vergence was observed,i.e. in young pairs of duplicated genes.
Duplicate gene pairs that diverged in their expression patterns displayed rapid rates of 5 prime sequence evolu-tion. Specifically, gene pairs with d5’/dS > 1 displayed higher levels of correlation in gene expression than dupli-cate pairs with d5’/dS< 1 (Figure 3C, median ln(R) = 1.80, mean 1.64 ± 0.23 vs. median ln(R) = 0.69, mean 0.83±0.07, respectively). More than 60% of the duplicate pairs with d5’/dS> 1 had ln(R) values that fell outside the random distribution of ln(R) values (Figure 3C). In con-trast, none had ln(R) values that were below random levels.
5 prime block similarities between duplicate genes were not a good indicator for the co-regulation of expres-sion. When d5’and ln(R) were grouped into those that were compatible with random expectations and those that were not, then one would have expected that random values of 5 prime block similarity values predominantly coincide with random ln(R) values (orvice versa). This was not the case. Only duplicate pairs with d5’higher than 0.8 differed from the remaining duplicate pairs in their correlation of expres-sion (ln(R) > 1.4vs.ln(R) < 0.9). However, for duplicate gene pairs with d5’ exceeding 0.8 ln(R) values as low as -0.61 (c.f. Figure S1) were not uncommon,e.g.they were found in ~10% of the cases. Conversely, ln(R) values as high as 2.7 were found in ~10% of the gene pairs with d5’ less than 0.8. Thus, while there was weak indication that d5’ and ln(R) were dependent variables, the statistical resolu-tion to document such a relaresolu-tionship was either limited or obscured by biological factors or the functional regulatory elements are located in regions that could not be aligned, and thus, d5’ more closely approximates non-functional rates of evolution.
Discussion
The principle onto which ‘phylogenetic footprinting’ is based is that conservation between orthologous coding sequences reflects functional constraint (Fickett and Wasserman, 2000). Conservation between orthologous non-coding sequences also has been viewed as evidence for functional constraint (Tautz and Nigro, 1998; Bergman and Kreitman, 2001; Wassermanet al., 2000; Bergmanet al.,
Table 2- The percentage of masked sequence occupied by various types of sequence elements and the percentages of the total sequence surveyed occupied by them in duplicate genes and the set of single-copy genes.
Element type* Duplicate genes Set of single-copy genes
Masked Total Masked Total
LINEs 11.2% 0.4% 9.9% 0.4%
LTR elements 4.6% 0.2% 9.0% 0.3%
Gypsy-type: 4.2% 0.2% 2.0% 0.1%
PAO-type: 0.4% - 7.0% 0.3%
DNA elements: 19.6% 0.8% 2.5% 0.1%
Tc1-type: 3.7% 0.1% 0.4%
-Unclassified: 8.1% 0.3% -
-Satellites: - - 0.5%
-Simple repeats: 19.4% 0.8% 21.6% 0.8%
Low complexity: 36.9% 1.5% 56.6% 2.1%
Total: 4.0% 3.8%
2002; Webbet al., 2002; Dermitzakiset al., 2003; Haberer
et al., 2006, Thomaset al., 2007). The possibility that nega-tive selection on the 5 prime regions of genes may indeed be prevalent has been raised (Tautz and Nigro, 1998; Stone and Wray, 2001; Dermitzakis et al., 2003; Hahn et al., 2003; Kohnet al., 2004; Andolfatto, 2005; Eyre-Walker, 2006; Hahn, 2007). More rapid rates of substitution take place in regions free of functional constraint (Andolfatto, 2005; Shapiroet al., 2007). In the case of non-coding se-quences rapid rates may be driven by nucleotide substitu-tion, but also by mutational events (insertions, deletions, replication slippage) whose dynamics are not well under-stood (e.g.Comeron, 2001; Eyre-Walker, 2006). The dy-namics of selective constraint on the 5 prime regions ofD. melanogasterduplicate genes over time was manifest in the rate d5’/dS(Figure 2A, and Table 1). Initially, for duplicate pairs separated by dS< 0.25-0.3 d5’/dSwas larger than one. If it is assumed that dS represents neutral divergence (Akashi, 1999), then d5’/dS= 1 indicate selective neutrality and d5’/dS> 1 positive selection. The majority of genes used here had low levels of codon usage bias (ENC 35 or more, Guet al., 2002b) and only 2% of genes had ENC levels be-tween 32 and 35, suggesting that synonymous sites in this dataset should conform to neutrality reasonably well. Thus, as has been assumed by others here it was assumed that syn-onymous site divergence is useful measure for the relative ages of gene duplicate pairs (Kim and Yi, 2006; Wanget al., 2006; Gu and Su, 2007; Guanet al., 2007; Haet al., 2007; Jianget al., 2007; Johnstonet al., 2007; Rothet al., 2007).
Duplicate gene pairs separated by dS> 0.25-0.3 dis-played lower d5’ than dS values (Figure 2, Table 1), i.e. dA/dS1 (Table 2). Thus, levels of constraint on the 5 prime regions of duplicate genes were found to be comparable to those at amino-acid replacement sites once substantial cod-ing sequence divergence levels have been reached. In con-trast, young duplicate pairs may experience reduced levels of constraint on their amino-acid changes (Figure 2B and Table 1) (Clark, 1994; Lynch and Conery, 2000; Kondrashovet al., 2002). The degree to which the 5 prime regions of ancient duplicate pairs, which are fully saturated at synonymous sites, still can be aligned is remarkable. In the absence of constraint neutral sites should be entirely di-verged after a few million years, or at dS~ 1.
However, the constraint imposed on 5 prime regions that can directly be attributed to transcription control may be less than intuition would suggest. During a previous study this conclusion was based on the similar levels of se-quence similarity that can be detected from alignments of 5 prime regions of orthologousDrosophilagenes as well as alignments of introns of orthologous genes (Bergman and Kreitman, 2001). Here, the weak relationship between 5 prime block similarities between duplicates and their weak correlations with expression (Figure 3) indicated that the constraint detected here at best was in part a direct result of
transcription requirements. This could reflect a limited res-olution of this study. However, biological implications of this finding are plausible, as much remains to be learned about regulatory non-coding sequences (e.g. Comeron, 2001; Fesseleet al., 2002; Ludwig, 2002; Hahnet al., 2003; Birdet al., 2006). Additional forces, such as gene conver-sion tracts spanning regions that are not involved in regula-tion can maintain sequence similarity in the 5 prime regions of duplicate genes (Ohta, 1985; Basten and Ohta, 1992; King, 1998; Masideet al., 2003).
It is noteworthy that various other types of sequence elements (retro-elements and low-complexity/repeat se-quences) located in the 5 prime regions ofD. melanogaster
duplicates became increasingly rare as duplicate genes di-verged. Even though this was not further investigated here, the pattern pointed to their reduction over time. In human, repeat sequences occasionally have been linked to deleteri-ous effects when located in the regulatory region of genes (Usdin and Grabczyk, 2000). Many types of low-com-plexity/repeat sequences may act as spurious transcription factor binding sites that are slightly deleterious (Stone and Wray, 2001).
The important assertion made in this report refers to the accelerated evolution in the 5 prime regions of young duplicates. The interpretation of the d5’/dSrates relies on the premise that d5’and dSof duplicate genes may be directly compared to one another, which may be questioned on a number of grounds. Most importantly, while it is quite cer-tain that homologous sites in the coding regions of dupli-cate genes were compared, the possibility remains that non-homologous sites in the 5 prime regions of duplicate genes were compared. However, both the alignment and di-vergence estimation generally should be less problematic in young duplicate pairs compared to the alignment of old duplicate gene pairs. In fact, accelerated evolution in the 5 prime regions of young duplicate gene pairs was deduced from generally longer and more reliable alignments than those alignments of ancient duplicate pairs from which constraint was inferred.
The rapid divergence in the 5 prime regions of young
D. melanogaster duplicates was found to coincide with
neo-func-tionalization (one copy accelerated) and sub-functionali-zation models (both copies accelerated), and to polarize the direction of change.
The possibility that advantageous mutations occur and positive selection acts on duplicate gene promoters has been raised before (Pappet al., 2003; Seoigheet al., 2003; Castillo-Daviset al., 2004; Huminiecki and Wolfe, 2004; Jordanet al., 2004; Lynch and Katju, 2004; He and Zhang, 2005; Crow and Wagner, 2006; Kim and Yi, 2006; Kon-drashov and KonKon-drashov, 2006; Gu and Su, 2007; Jianget al., 2007; Johnstonet al., 2007). Here a pattern consistent with selection in Drosophila was observed. Complex selec-tion patterns (Ohta, 1988; Basten and Ohta, 1992; Forceet al., 1999; Ludwig et al., 2000; Lynch and Force, 2000; Tautz, 2000; Ludwig, 2002; Wagner, 2002a) and the dif-fuse link between sequence context and regulatory function (Carrollet al., 2001; Fesseleet al., 2002) pose considerable challenges to the conclusive documentation of selection. However, the results presented here suggest that rapid evo-lution in the 5 prime regulatory regions of young duplicate genes, which tend to be rather equivalent in their function, appears to be a part of the footprint left by functional diver-sification. That positive selection is driving rates d5’/dSin excess of 1 is conceivable when assuming that single nucle-otide substitutions within 5 prime blocks are their major mode of change.
In sum, the 5 prime regulatory regions of very young
Drosophiladuplicate gene pairs diverge at rates faster than at synonymous sites. If the latter are viewed as a proxy for neutral divergence rates, then we can infer that the evolu-tion of 5 prime sequences in young duplicate genes is driven by positive selection. Conceivably the process is fa-cilitated by initial relaxation of selective constraint due to the overlapping functions of young duplicate pairs. Low levels of nonsynonymous site divergence and an analysis of
Drosophiladuplicate gene expression data presented
sup-ported functional redundancy of young gene duplicates. In contrast, as duplicate genes diverge over time in their cod-ing sequences and expression patterns the 5 prime regula-tory regions of them were found to display divergence rates as low as those at amino-acid replacement sites, suggesting that they evolve under selective constraint. An important next step in the analysis of duplicated gene evolution in
Drosophila would be concerned with the symmetric, or
asymmetric divergence of duplicate genes, which appears to be commonly seen in other organisms (Casneufet al., 2006; Chunget al., 2006; Kim and Yi,2006; Tirosh and Barkai, 2007).
Acknowledgments
I thank Chung-I Wu for stimulating discussions and financial support, and Kevin Thornton, Casey Bergman, Matthias Gerberding, Sebastian Zöllner, Bettina Harr, and Jian Lu and two anonymous reviewers for important feed-back.
References
Akashi H (1995) Inferring weak selection from patterns of poly-morphism and divergence at ‘silent’ sites in Drosophila DNA. Genetics 139:1067-1076.
Akashi H (1999) Within- and between-species DNA sequence variation and the ‘footprint’ of natural selection. Gene 238:39-51.
Andolfatto P (2005) Adaptive evolution of non-coding DNA in Drosophila. Nature 437:1149-1152.
Barrier M, Robichaux RH and Purugganan MD (2001) Acceler-ated regulatory gene evolution in an adaptive radiation. Proc Natl Acad Sci USA 98:10208-10213.
Basten CJ and Ohta T (1992) Simulation study of a multigene family, with special reference to the evolution of compensa-tory advantageous mutations. Genetics 132:247-252. Bergman CM and Kreitman M (2001) Analysis of conserved
noncoding DNA in Drosophila reveals similar constraints in intergenic and intronic sequences. Genome Res 11:1335-1345.
Bergman CM, Pfeiffer BD, Rincon-Limas DE, Hoskins RA, Gnirke A, Mungall CJ, Wang AM, Kronmiller B, Pacleb J, Park S,et al.(2002) Assessing the impact of comparative genomic sequence data on the functional annotation of the Drosophilagenome. Genome Biol 3:0086.1-0086.20. Berman BP, Nibu Y, Pfeiffer BD, Tomancak P, Celniker SE,
Le-vine M, Rubin GM and Eisen, MB (2002) Exploiting tran-scription factor binding site clustering to identify cis-re-gulatory modules involved in pattern formation in the Drosophilagenome. Proc Natl Acad Sci USA 99:757-762. Bird CP, Stranger BE and Dermitzakis ET (2006) Functional
vari-ation and evolution of non-coding DNA. Curr Opin Genet Dev 16:559-564.
Carroll SB, Grenier JK and Weatherbee SD (2001) From DNA to Diversity: Molecular Genetics and the Evolution of Animal Design. Blackwell Science, Malden, 192 pp.
Casneuf T, De Bodt S, Raes J, Maere S and Van de Peer Y (2006) Nonrandom divergence of gene expression following gene and genome duplications in the flowering plantArabidopsis thaliana. Genome Biol 7:R13.
Castillo-Davis CI, Hartl DL and Achaz G (2004)cis-Regulatory and protein evolution in orthologous and duplicate genes. Genome Res 14:1530-1536.
Castresana J (2002) Estimation of genetic distances from human and mouse introns. Genome Biol 3:0028.1-0028.7. Chung WY, Albert R, Albert I, Nekrutenko A and Makova KD
(2006) Rapid and asymmetric divergence of duplicate genes in the human gene coexpression network. Bmc Bioinfo 7:46. Clark AG (1994) Invasion and maintenance of a gene duplication.
Proc Natl Acad Sci USA 91:2950-2954.
Comeron JM (2001) What controls the length of noncoding DNA. Curr Opin Genet Dev 11:652-659.
Conant GC and Wagner A (2002) Genome History - A software tool and its application to fully sequenced genomes. Nucleic Acids Res 30:3378-3386.
Conery JS and Lynch M (2001) Nucleotide substitutions and the evolution of duplicate genes. Pacific Symp Biocomp 6:167-178.
de Meaux J (2006) An adaptive path through jungle DNA. Nat Genet 38:506-507.
Dermitzakis ET, Bergman CM and Clark AG (2003) Tracing the evolutionary history ofDrosophilaregulatory regions with models that identify transcription factor binding sites. Mol Biol Evol 20:703-714.
Eyre-Walker A (2006) The genomic rate of adaptive evolution. Trends Ecol Evol 21:569-575.
Fessele S, Maier H, Zischek C, Nelson PJ and Werner T (2002) Regulatory context is crucial part of gene function. Trends Genet 18:60-63.
Fickett JW and Wasserman WW (2000) Discovery and modeling of transcriptional regulatory regions. Curr Opin Biotechnol 11:19-24.
Force A, Lynch M, Pickett FB, Amores A, Yan Y-L and Postlethwait J (1999) Preservation of duplicate genes by complementary degenerative mutations. Genetics 151:1531-1545.
Gu Z, Nicolae D, Henry H-S and Li W-H (2002a) Rapid diver-gence in expression between duplicate genes inferred from microarray data. Trends Genet 18:609-613.
Gu Z, Cavalcanti A, Chen F-C, Bouman P and Li W-H (2002b) Extend of gene duplication in the genomes ofDrosophila, nematode and yeast. Mol Biol Evol 19:256-262.
Gu Z, Steinmetz LM, Gu X, Scharfe C, Davis RW and Li W-H (2002c) Role of duplicate genes in genetic robustness against null mutations. Nature 421:63-66.
Gu X and Su ZX (2007) Tissue-driven hypothesis of genomic evolution and sequence-expression correlations. Proc Natl Acad Sci USA 104:2779-2784.
Guan YF, Dunham MJ and Troyanskaya OG (2007) Functional analysis of gene duplications inSaccharomyces cerevisiae. Genetics 175:933-943.
Ha M, Li WH and Chen ZJ (2007) External factors accelerate ex-pression divergence between duplicate genes. Trends Genet 23:162-166.
Haberer G, Hindemitt T, Meyers BC and Mayer KFX (2004) Transcriptional similarities, dissimilarities, and conserva-tion ofcis-elements in duplicated genes of arabidopsis. Plant Physiol 136:3009-3022.
Haberer G, Mader MT, Kosarev P, Spannagl M, Yang L and Mayer KFX (2006) Large-scale cis-element detection by analysis of correlated expression and sequence conservation between arabidopsis andBrassica oleracea. Plant Physiol 142:1589-1602.
Hahn MW, Stajich JE and Wray GA (2003) The effects of selec-tion against spurious transcripselec-tion factor binding sites. Mol Biol Evol 20:901-906.
Hahn MW (2007) Detecting natural selection oncis-regulatory DNA. Genetica 129:7-18.
Hasegawa M, Kishino H and Yano T (1985) Dating of the hu-man-ape splitting by a molecular clock of mitochondrial DNA. J Mol Evol 22:160-174.
He XL and Zhang JZ (2005) Rapid subfunctionalization accom-panied by prolonged and substantial neofunctionalization in duplicate gene evolution. Genetics 169:1157-1164. Hughes AL (1994) The evolution of functionally novel proteins
after gene duplication. Proc R Soc London Soc Ser B 256:119-124.
Hughes AL (2002) Adaptive evolution after gene duplication. Trends Ecol Evol 18:433-434.
Huminiecki L and Wolfe KH (2004) Divergence of spatial gene expression profiles following species-specific gene duplica-tions in human and mouse. Genome Res 14:1870-1879. Jiang, HF, Liu DY, Gu ZL and Wang W (2007) Rapid evolution in
a pair of recent duplicate segments of rice. J Exp Zool 308B:50-57.
Johnston CR, O’Dushlaine C, Fitzpatrick DA, Edwards RJ and Shields DC (2007) Evaluation of whether accelerated pro-tein evolution in chordates has occurred before, after, or si-multaneously with gene duplication. Mol Biol Evol 24:315-323.
Jordan IK, Marino-Ramirez L and Koonin EV (2005) Evolution-ary significance of gene expression divergence. Gene 345:119-126.
Kim SH and Yi SV (2006) Correlated asymmetry of sequence and functional divergence between duplicate proteins of Saccharomyces cerevisiae. Mol Biol Evol 23:1068-1075. King LM (1998) The role of gene conversion in determining
se-quence variation and divergence in theEst-5gene family in Drosophila pseudoobscura. Genetics 148:305-316. Kohn MH, Fang S and Wu C-I (2004) Inference of positive and
negative selection on the 5 regulatory regions ofDrosophila genes. Mol Biol Evol 21:374-383.
Kondrashov FA, Rogozin IB, Wolf Y I and Koonin EV (2002) Se-lection in the evolution of gene duplications. Genome Biol 3:0008.1-0008.9.
Kondrashov AS (2005) Evolutionary biology - Fruitfly genome is not junk. Nature 437:1106.
Kondrashov FA and Kondrashov AS (2006) Role of selection in fixation of gene duplications. J Theor Biol 239:141-151. Koop BF (1995) Human and rodent DNA sequence comparisons:
A mosaic model of genomic evolution. Trends Genet 11:367-371.
Li HP and Stephan W (2006) Inferring the demographic history and rate of adaptive substitution inDrosophila. PLoS Genet-ics 2:1580-1589.
Ludwig MZ, Bergman C, Patel NH and Kreitman M (2000) Evi-dence for stabilizing selection in a eukaryotic enhancer ele-ment. Nature 403:564-567.
Ludwig MZ (2002) Functional evolution of noncoding DNA. Curr Opin Genet Dev 12:634-639.
Lynch M and Conery JS (2000) The evolutionary fate and conse-quences of duplicate genes. Science 290:1151-1155. Lynch M and Force A (2000) The probability of duplicate gene
preservation by subfunctionalization. Genetics 154:459-473.
Lynch M and Katju V (2004) The altered evolutionary trajectories of gene duplicates. Trends Genet 20:544-549.
Makova KD and Li W-H (2003) Divergence in the spatial pattern of gene expression between human duplicate genes. Ge-nome Res 13:1638-1645.
Maside X, Bartolome C and Charlesworth B (2003) Inferences on the evolutionary history of the S-element family of Drosophila melanogaster. Mol Biol Evol 20:1183-1187. Morgenstern B (1999) DIALIGN 2: Improvement of the
seg-ment-to-segment approach to multiple sequence alignment. Bioinformatics 15:211-218.
Ohno S (1970) Evolution by Gene Duplication. George Allen and Unwin, London, 160 pp.
Ohta T (1985) A model of duplicative transposition and gene con-version for repetitive DNA families. Genetics 110:513-524. Ohta T (1987) Simulating the evolution of gene duplication.
Ge-netics 115:207-213.
Ohta T (1988) Evolution by gene duplication and compensatory advantegous mutations. Genetics 120:841-847.
Ohta T (1994) Further examples of evolution by gene duplication revealed through DNA sequence comparisons. Genetics 138:1331-1337.
Papp B, Pal C and Hurst LD (2003) Evolution ofcis-regulatory el-ements in duplicated genes of yeast. Trends Genet 19:417-422.
Roth C, Rastogi S, Arvestad L, Dittmar K, Light S, Ekman D and Liberles DA (2007) Evolution after gene duplication: Mo-dels, mechanisms, sequences, systems, and organisms. J Exp Zool Part 308B:58-73.
Seoighe C, Johnston CR and Shields DC (2003) Significantly dif-ferent patterns of amino acid replacement after gene dupli-cation as compared to after speciation. Mol Biol Evol 20:484-490.
Shabalina SA, Ogurtsov AY, Kondrashov VA an Kondrashov AS (2001) Selective constraint in intergenic regions of human and mouse genomes. Trends Genet 17:373-376.
Shapiro JA, Huang W, Zhang CH, Hubisz MJ, Lu J, Turissini DA, Fang S, Wang HY, Hudson RR, Nielsen R,et al.(2007) Adaptive genic evolution in theDrosophilagenomes. Proc Natl Acad Sci USA 104:2271-2276.
Spellman PT and Rubin GM (2002) Evidence for large domains of similarly expressed genes in theDrosophilagenome. J Biol 1:5.
Stone JR and Wray GA (2001) Rapid evolution ofcis-regulatory sequences via local point mutations. Mol Biol Evol 18:1764-1770.
Tautz D (2000) Evolution of transcriptional regulation. Curr Opin Genet Dev 10:575-579.
Tautz D and Nigro L (1998) Microevolutionary divergence pat-tern of the segmentation gene hunchback in Drosophila. Mol Biol Evol 15:1403-1411.
Taylor JS and Raes J (2004) Duplication and divergence: The evo-lution of new genes and old ideas. Annu Rev Genet 38:615-643.
Thomas BC, Rapaka L, Lyons E, Pedersen B and Freeling M (2007)Arabidopsisintragenomic conserved noncoding se-quences. Proc Natl Acad Sci USA 104:3348-3353. Thompson JD, Higgins DG and Gibson TJ (1994) CLUSTAL W:
Improving the sensitivity of progressive multiple sequence alignment through sequence weighting position-specific gap penalties and weight matrix choice. Nucleic Acids Res 22:4673-4680.
Thornton K and Long M (2002) Rapid divergence of gene dupli-cates on theDrosophila melanogasterX chromosome. Mol Biol Evol 19:918-925.
Usdin K and Grabczyk E (2000) DNA repeat expansions and hu-man disease. Cell Mol Life Sci 57:914-931.
Wagner A (2000) Decoupled evolution of coding region and mRNA expression patterns after gene duplication: Implica-tions for the neutralist-selectionist debate. Proc Natl Acad Sci USA 97:6579-6584.
Wagner A (2001) Birth and death of duplicated genes in com-pletely sequenced eukaryotes. Trends Genet 17:237-239. Wagner A (2002a) Selection and gene duplication: A view from
the genome. Genome Biol 3:1012.1-1012.3.
Wagner A (2002b) Asymmetric functional divergence of dupli-cate genes in yeast. Mol Biol Evol 19:1760-1768.
Walsh JB (1995) How often do duplicated genes evolve new func-tions? Genetics 139:421-428.
Wang R, Chong K and Wang T (2006) Divergence in spatial ex-pression patterns and in response to stimuli of tandem-repeat paralogues encoding a novel class of proline-rich proteins in Oryza sativa. J Exp Bot 57:2887-2897.
Wasserman WW, Palumbo M, Thompson W and Fickett JW (2000) Human-mouse genome comparisons to locate regu-latory sites. Nat Genet 26:225-228.
Webb CT, Shabalina SA, Ogurtsov AY and Kondrashov AS (2002) Analysis of similarity within 142 pairs of orthologous intergenic regions of Caenorhabditis elegans and Caenorhabditis briggsae. Nucleic Acids Res 30:1223-1229.
Yang Z (1997) PAML: A program package for phylogenetic anal-ysis by maximum likelihood. Comput Appl Biosci 13:555-556.
Zhang J, Rosenberg HF and Nei M (1998) Positive Darwinian se-lection after gene duplication in primate ribonuclease genes. Proc Natl Acad Sci USA 95:3708-3713.
Zhang J (2003) Evolution by gene duplication: An update. Trends Ecol Evol 18:292-298.
Internet Resources
Web page that contains the information and analysis methods used for the paper on the evolution of duplicate genes by Lynch and Conery (2000), http://www.csi.uoregon.edu/pro-jects/genetics/duplications/D.melanogaster.txt (December 2002).
Berkley Drosophila Genome Project (BDGP, Release 2) (http://www.fruitfly.org) (December 2002).
A non-redundant set of the 5 prime regions ofD. melanogaster genes,
http://www.fruitfly.org/seq_tools/datasets/Drosophila/pro-moter/ (December 2002) (Ohleret al., (2002).
RepeatMasker software, (http://repeatmasker.genome.washing-ton.edu/cgi-bin/RepeatMasker) (Thompsonet al., 1994). Gene expression data from 267 Affymetrix GeneChips
represent-ing six independent investigations onD. melanogaster com-piled by Spellman and Rubin (2002), http://jbiol.com/con-tent/supplementary/1475-4924-1-5-S1.txt (December 2002).
Associate Editor: Louis Bernard Klaczko