Expression and characterization of LTx2, a neurotoxin from
Lasiodora
sp. effecting on calcium channels
A.A. Dutra
a, L.O. Sousa
a, R.R. Resende
b, R.L. Branda˜o
a, E. Kalapothakis
c, I.M. Castro
a,*
aLaborato´rio de Biologia Celular e Molecular, Nu´cleo de Pesquisa em Cieˆncias Biolo´gicas, Departamento de Farma´cia,Universidade Federal de Ouro Preto, Ouro Preto, MG 35400.000, Brazil
bDepartamento de Fisiologia e Biofı´sica, Instituto de Cieˆncias Biome´dicas, Universidade de Sa˜o Paulo, Sa˜o Paulo, Brazil cLaborato´rio de Biotecnologia e Marcadores Moleculares, Departamento de Biologia Geral, Instituto de Cieˆncias Biolo´gicas,
Universidade Federal de Minas Gerais, Belo Horizonte, MG 31270.901, Brazil
1.
Introduction
Previously studied animal toxins have been found to target neuronal receptors, neuronal ion channels and presynaptic
membrane proteins involved in transmitter release [30].
Toxins that modulate ion channels represent a key class of pharmaceutical agents[9,12]. Natural toxins that interact with specific receptors may block the excitation of muscles leading to flaccid paralysis and death. These are desired features for pesticides[1,29].
The BrazilianLasiodoraspider, commonly known as ‘‘car-anguejeiras’’, inhabits southeastern Brazil. While the venom is not considered hazardous to humans, the spider’s urticating hairs can be allergenic. The crude venom and the two major peptide toxins ofLasiodora parahybana(L. parahybana) have been
shown to be toxic to crickets and mice[11]. Fractions derived from ion exchange high-performance liquid chromatography (HPLC) showed little overlap between vertebrate and inverte-brate activity. Although the two toxins (LpTx1 and LpTx2) were isolated and sequenced by Edman degradation, their activity remains unknown. Analysis ofL. parahybanavenom by LC/ESI-QqTof, nanoESI-MS and MALDI-TOF MS provided a peptide profile ofL. parahybanavenom[15].
Many spider venoms contain peptide neurotoxins active on ion channels. On the other hand, the importance of Ca2+as a universal signaling agent in processes such as protein secretion, exocytosis, and muscle contraction has been addressed[5]. Most cells utilize two main sources of Ca2+for
generating calcium signals, one is Ca2+ entry across the
plasma membrane and the other is Ca2+release from internal
a r t i c l e
i n f o
Article history:
Received 29 February 2008 Received in revised form 29 April 2008
Accepted 1 May 2008 Published on line 7 May 2008
Keywords: Spider toxins Lasiodora cDNA Expression Calcium channel Venom
a b s t r a c t
Here, we described the expression and characterization of the recombinant toxin LTx2, which was previously isolated from the venomous cDNA library of a Brazilian spider, Lasiodorasp. (Mygalomorphae, Theraphosidae). The recombinant toxin found in the soluble and insoluble fractions was purified by reverse phase high-performance liquid chromato-graphy (HPLC). Ca2+imaging analysis revealed that the recombinant LTx2 acts on calcium channels of BC3H1 cells, blocking L-type calcium channels.
#2008 Elsevier Inc. All rights reserved.
*Corresponding author. Tel.: +55 31 3559 1722; fax: +55 31 3559 1680. E-mail address:[email protected](I.M. Castro).
a v a i l a b l e a t w w w . s c i e n c e d i r e c t . c o m
j o u r n a l h o m e p a g e : w w w . e l s e v i e r . c o m / l o c a t e / p e p t i d e s
stores. Ca2+release from internal stores occurs primarily from the endoplasmic reticulum (ER) wherein two functionally distinct Ca2+ release channels have been identified, namely inositol 1,4,5-trisphosphate receptors (InsP3Rs) and ryanodine receptors (RyRs)[3,4]. Ca2+entry across the plasma membrane occurs via two distinct pathways, voltage-gated Ca2+channels (VGCCs), and agonist-dependent and voltage-independent Ca2+entry pathways, which are called ‘store-operated’ Ca2+ (SOCs) channels[5].
In the current study, venom was obtained fromLasiodora
sp. collected around Belo Horizonte in the state of Minas Gerais, Brazil.Lasiodorasp. venom has been shown to contain
pharmacological components that inhibit L-type Ca2+
chan-nels and modulate Na+ channels [18,21]; however, these
previous studies analyzed crude venom. Molecular cloning of cDNAs that code for the putative toxins produced by this spider can make direct recombinant protein studies possible. The aim of the present work was to express and characterize the LTx2 toxin fromLasiodorasp. to further our understanding on the mechanism of action of this spider’s venom. To this end, cDNA encoding the LTx2 was inserted into the expression vector pET11a and the translated protein was expressed and purified for functional characterization. Initially, the types and functions of Ca2+channels in plasma membrane and internal Ca2+stores in BC3H1 cells were examined, by Ca2+imaging experiments, as well as the possible involvement of InsP3Rs or
RyRs, and VGCCs or SOCs channels, in [Ca2+]
i oscillations. Additionally, we provide evidence that LTx2 toxin blocks L-type Ca2+channels and inhibits the refill of intracellular Ca2+ store, eliminating the InsP3promoting [Ca2+]ioscillations.
2.
Materials and methods
2.1. Reagents
All reagents were purchased from Sigma (St. Louis, MO) in highest available purity, if not otherwise indicated. Primers used for RT-PCR reactions were purchased from Integrated DNA Technologies (Coralville, IA).
2.2. General molecular biology
Standard recombinant DNA techniques (e.g., phenol extrac-tion, ethanol precipitation and electrophoresis) were carried out as described by Sambrook et al.[35].
2.2.1. DNA sequencing and computer analysis
Small-scale plasmid isolation fromE. coliwas carried out using the alkaline lysis SDS method[35]and purified using Millipore Multiscreen plates (Millipore). DNA sequencing reactions were performed on both strands using chain termination[36]. All reactions were carried out using the MegaBace 500 Sequencing
Analysis System and DyEnamicTM ET dye terminator kit.
Nucleic acids sequences were compared to sequences in the GenBank database[2].
2.2.2. Expression of toxin in E. coli
The plasmid pET11a (Novagen1) was used to express the
mature LTx2 toxin (GenBank accession no. AY794220). The
insert was prepared using a polymerase chain reaction (PCR) with forward (50-CCATATGCTTTTCGAATGTAC-30) and reverse (50-GGGATCCCTAAATCTTCAAAC-30) primers. The forward PCR primer contained an Nde I restriction site including the translation initiation ATG codon, and the reverse primer had a BamH I site at the 30end immediately after the stop codon. PCR conditions included 34 cycles with each cycle with 948C for 1 min, followed by 528C for 1 min, and 728C for 1 min. The reaction was concluded with a 5 min elongation phase at 728C. The gel-purified PCR product was digested with Nde I/BamH I and ligated into the Nde I/BamH I digested pET11a vector to produce the expression plasmid pET11a-LTx2.
CompetentE. colistrain BL21 (DE3) cells were transformed with the recombinant plasmid. The presence of the appro-priate insert was determined using direct colony PCR and DNA sequencing. Bacterial growth, induction with isopropylb-D
-1-thiogalactopyranoside (IPTG) and preparation of cell lysates were performed as described by the manufacturer
(Nova-gen1). Briefly, stocked cultures of transformants were
grown in 4.0 ml of LB-ampicillin medium. One milliliter of inoculum was added to 100 ml fresh medium and incubated until the OD 600 was 0.5–0.7. Protein expression was induced by addition of 0.6 mM IPTG and the cultures were grown for 6 h at 308C. Cells were harvested by centrifugation and resus-pended in 10 ml lysis buffer (50 mM Tris pH 8.0, 100 mM NaCl,
10 mM imidazole, lysozime 1 mg ml 1plus proteases
inhibi-tors (1 mM PMSF, 1 mM iodacetamide, 1mg ml 1 pepstatin,
1 mM EDTA)). The cells were lysed by sonication on ice. After
centrifugation at 20,000g, both fractions – soluble and
inclusion bodies – were stored for further tests. Protein
content was estimated by the Bradford’s protein assay [6]
and samples were analyzed by SDS-PAGE.
2.2.3. SDS-PAGE and immunoblot
Proteins samples were prepared and separated by electro-phoresis on 18% acrylamide gels[22]. Gels were run at 100 V for 1 h and stained with Coomassie Blue G-250 or transferred to a nitrocellulose membrane for immunolabeling[14]using anti-Lasiodora-venom antibodies.
2.3. Purification of recombinant LTx2
The LTx2 recombinant protein was purified from inclusion bodies. Protein refolding was carried out as described by Roberto et al. [33]. Reverse-phase chromatography was per-formed using a PEPMap C8 prepacked column and an HPLC
ActaTM Explorer System (Amersham Biosciences, Uppsala,
Sweden). After equilibrating the column with 0.1% trifluor-oacetic acid (TFA)/deionized water (mobile phase), the protein was eluted with a continuous gradient of a mobile phase containing acetonitrile/0.1% TFA. The eluant profile was monitored continuously at 280 and 214 nm. The fractions were then dialyzed, lyophilized and stored at 208C.
2.4. Pharmacological characterization
2.4.1. Calcium oscillations in BC3H1 cells
2.4.1.1. Cell culture. BC3H1 cells expressing muscle-type
acetylcholine receptors (AChRs) [38] were cultured as
Dulbecco’s modified Eagle’s medium (DMEM, Invitrogen, Carlsbad, CA) supplemented with 10% fetal bovine serum (FBS, Cultilab, Campinas, Brazil), 100 units ml 1 penicillin, 100 (g ml 1streptomycin, and 2 mML-glutamine. For experi-ments, 2.3105BC3H1 cells ml 1were resuspended into 20 ml of 10% FBS medium. The suspension was mixed and 2 ml aliquots were pipetted into each dish. The medium was changed to 1% FBS 24 h after plating on bacterial dishes.
2.4.2. Calcium measurements
BC3H1 cells were loaded with Fluo-3-AM by incubation with
4mM Fluo-3-AM in 0.5% Me2SO and 0.1% of the non-ionic
surfactant pluronic acid F-127 for 30 min at 378C in 140 mM NaCl, 3 mM KCl, 1 mM MgCl2, 2.5 mM CaCl2, 10 mM HEPES, and 10 mM glucose at pH 7.4. After loading with Fluo-3-AM, the cells were washed with incubation buffer and incubated for 20 min to ensure complete de-esterification of the dye. Ca2+ imaging was performed with an LSM 510 confocal microscope (Zeiss, Jena, Germany). Fluo-3 fluorescence emission was excited with a 488 nm line from an argon ion laser and the
emitted light at 515 nm was detected using a band pass filter. At the end of each experiment, 5mM of the ionophore (4-Br-A23187) followed by 10 mM EGTA were used to determine maximal (Fmax) and minimal (Fmin) fluorescence values. Ca2+ concentration was calculated from the Fluo-3 fluorescence emission using a self-ratio equation as described previously
[16,31,32]assuming aKdof 450 nM[17]. The Ca2+imaging data were obtained at 20–228C. The osmolarity of all the solutions ranged between 298 and 303 mosmol l 1. Concentrations were calculated for cell populations containing at least 10 cells in three different experiments.
To evaluate the contribution of VGCC activation to the studied Ca2+signals, the depolarizing stimuli were delivered in the presence of the non-selective VGCC and SOC blocker (100mM Cd2+). Before testing the effects of Cd2+, we evaluated the stability of Ca2+responses to depolarizing stimuli repeated at 5-min intervals. The amplitude of theDF/Fratios in response to the first four stimulations remained fairly stable; those of the
third and fourth transients were, respectively, 4.61.8%
(n= 42) and 7.31.9% (n= 39) smaller than that of the first.
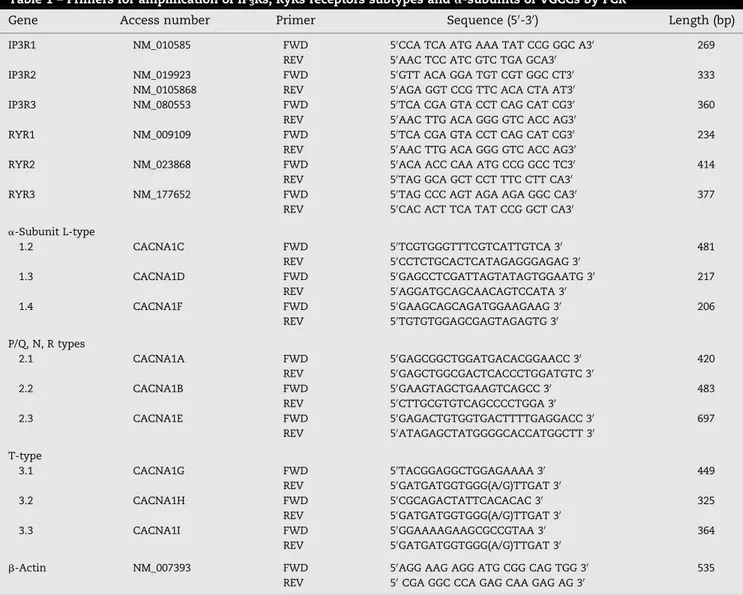
Table 1 – Primers for amplification of IP3Rs, RyRs receptors subtypes anda-subunits of VGCCs by PCR
Gene Access number Primer Sequence (50-30) Length (bp)
IP3R1 NM_010585 FWD 50CCA TCA ATG AAA TAT CCG GGC A30 269 REV 50AAC TCC ATC GTC TGA GCA30
IP3R2 NM_019923 FWD 50GTT ACA GGA TGT CGT GGC CT30 333 NM_0105868 REV 50AGA GGT CCG TTC ACA CTA AT30
IP3R3 NM_080553 FWD 50TCA CGA GTA CCT CAG CAT CG30 360 REV 50AAC TTG ACA GGG GTC ACC AG30
RYR1 NM_009109 FWD 50TCA CGA GTA CCT CAG CAT CG30 234 REV 50AAC TTG ACA GGG GTC ACC AG30
RYR2 NM_023868 FWD 50ACA ACC CAA ATG CCG GCC TC30 414 REV 50TAG GCA GCT CCT TTC CTT CA30
RYR3 NM_177652 FWD 50TAG CCC AGT AGA AGA GGC CA30 377 REV 50CAC ACT TCA TAT CCG GCT CA30
a-Subunit L-type
1.2 CACNA1C FWD 50TCGTGGGTTTCGTCATTGTCA 30 481
REV 50CCTCTGCACTCATAGAGGGAGAG 30
1.3 CACNA1D FWD 50GAGCCTCGATTAGTATAGTGGAATG 30 217 REV 50AGGATGCAGCAACAGTCCATA 30
1.4 CACNA1F FWD 50GAAGCAGCAGATGGAAGAAG 30 206
REV 50TGTGTGGAGCGAGTAGAGTG 30
P/Q, N, R types
2.1 CACNA1A FWD 50GAGCGGCTGGATGACACGGAACC 30 420 REV 50GAGCTGGCGACTCACCCTGGATGTC 30
2.2 CACNA1B FWD 50GAAGTAGCTGAAGTCAGCC 30 483
REV 50CTTGCGTGTCAGCCCCTGGA 30
2.3 CACNA1E FWD 50GAGACTGTGGTGACTTTTGAGGACC 30 697 REV 50ATAGAGCTATGGGGCACCATGGCTT 30
T-type
3.1 CACNA1G FWD 50TACGGAGGCTGGAGAAAA 30 449
REV 50GATGATGGTGGG(A/G)TTGAT 30
3.2 CACNA1H FWD 50CGCAGACTATTCACACAC 30 325
REV 50GATGATGGTGGG(A/G)TTGAT 30
3.3 CACNA1I FWD 50GGAAAAGAAGCGCCGTAA 30 364
REV 50GATGATGGTGGG(A/G)TTGAT 30
b-Actin NM_007393 FWD 50AGG AAG AGG ATG CGG CAG TGG 30 535 REV 50CGA GGC CCA GAG CAA GAG AG 30
2.4.3. Reverse transcription and conventional PCR
Total RNA was isolated using TRIzol (Invitrogen) from undifferentiated BC3H1 cells. Integrity of the isolated RNA was verified by separation on a 2% ethidium bromide-stained agarose gel. DNA was removed from RNA samples by incubation with DNase I (Ambion Inc., Austin, TX).
Primer sequences for reverse transcription and PCR amplification of b-actin, InsP3Rs and RyRs isoforms mRNA are listed in Table 1. Negative controls were realized with water and total RNA non-reverse transcribed. The amplifica-tion reacamplifica-tion mixture (50ml) contained 200 ng of the cDNA sample, 1.25 U of Ampli-Taq DNA polymerase, 1PCR reaction buffer, 200 mM of each primer, 200mM dATP, dCTP, dGTP, and
dTTP, and 1.5 mM MgCl2(Applied Biosystems). The thermal
cycling conditions included 5 min at 958C. Thermal cycling proceeded with 35 cycles of 948C for 30 s, 558C for 30 s, and 728C for 30 s. After amplification, electrophoresis of 10ml reaction mixture on a 2% NuSive:agarose gel (3:1) (FMC product, Rockland, ME) was visualized under UV illumination after staining with ethidium bromide.
3.
Results
3.1. Cloning and expression
The cDNA encoding the mature LTx2 protein was cloned into a pET11a expression vector (pET11a–LTx2), sequenced to confirm the correct frame, and the recombinant toxin was obtained using BL21 (DE3)E. colicells.Fig. 1A showsE. coli extracts electrophoresed on an 18% SDS-PAGE after induction with IPTG. A faint band of approximately 5.7 kDa was detected after 4 h of induction, which is consistent with
previous studies that deduced molecular weight for this toxin to be5.7 kDa. Additionally, immunochemical identification of the recombinant protein using antisera against whole venom is shown inFig. 1B. A second band just below of 5.7 kDa was detected by Western blot and may correspond to a protein degradation product. Crude venom used as a positive control showed a band with a similar molecular weight. In the negative control (non-induced cells), this band was not observed (Fig. 1B).
Fig. 1 – (A) SDS-PAGE (18%) profile expression into pET11a(+) induced by IPTG. Each lane was loaded with 20mg of total protein. (1) Low molecular
weight + aprotinin; (2) empty vector; (3) not induced; lanes (4–7) induced for 1, 2, 3 and 4 h with 0.6 mM IPTG, respectively. The arrow shows increases in expression. (B) Immunochemical identification of recombinant LTx2 in bacterial extracts. C.V., crude venom; N.I., not induced; I.M., induced material.
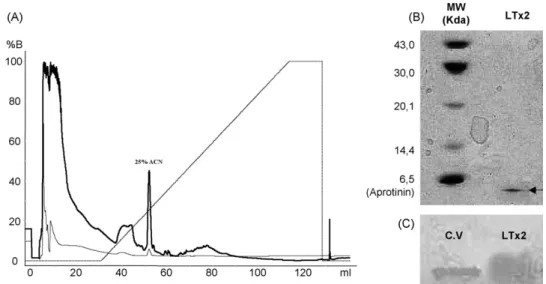
3.2. Purification of LTx2 recombinant
Recombinant LTx2 protein was expressed in transformedE.
coli(BL21 DE3) and found in both the soluble and insoluble fractions. The LTx2 recombinant protein from the insoluble fraction was solubilized (6 M guanidine hydrochloride, 5%b -mercaptoethanol) and after refolding, was purified in a
PepMap C8 RP column (Fig. 2A). The homogeneity of the
eluted fraction was demonstrated by SDS-PAGE and Western blot (Fig. 2B and C). The purified protein was demonstrated to be biologically active by calcium imaging in BC3H1 cells (see Sections3.3.2 and 3.3.3).
3.3. Activity
3.3.1. Ca2+oscillations in BC3H1 cells To investigate the dynamics of [Ca2+]
i in BC3H1 cells, we
performed Fluo-3 imaging experiments. Spontaneous [Ca2+] i oscillations were observed in 47 of 62 cells (76%), in external buffer containing 2.5 mM Ca2+without any stimuli (Fig. 3A). Two major pathways control the [Ca2+]
i: the Ca2+entry across
the plasma membrane and the Ca2+ release from internal
stores. The contributions of each source of Ca2+ to sponta-neous [Ca2+]
i oscillations in BC3H1 cells were evaluated. In Ca2+-free buffer, the spontaneous [Ca2+]
ioscillations contin-ued for a while (Fig. 3B). The registered frequencies for [Ca2+]
i oscillation were not statistically different in Ca2+-free buffer
and Ca2+-containing buffer (the period was 2.7
1.3 min,
n= 31, and 4.21.2 min,n= 38, respectively). Otherwise, the amplitudes of spontaneous [Ca2+]
i oscillation were signifi-cantly decreased by 35.73.8% in free-Ca2+buffer (n= 5;P -value is<0.05 by paired at-test). These results indicate that the
amplitude, but not the frequency of [Ca2+]
i oscillation, is
regulated by Ca2+ entry through the plasma membrane.
Therefore, we speculated that [Ca2+]
i oscillation may be
regulated mainly by Ca2+ release from intracellular stores. In order to test this hypothesis, the ER contribution to generate [Ca2+]
i oscillations was examined. First, the effects of the
specific Ca2+ pump blockers, cyclopiazonic acid (CPA) and
thapsigargin (Thaps) were tested. Application of 1mM Thaps
(not shown) or 10mM CPA inhibited completely [Ca2+]
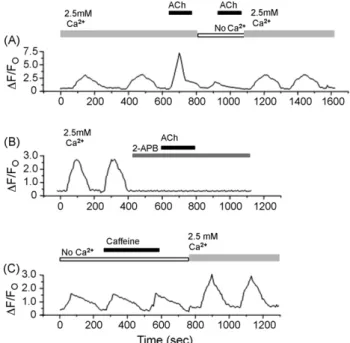
i oscillations (Fig. 3C), suggesting the involvement of Ca2+ release from ER. Two types of Ca2+release channel are present in ER or sarcoplasmic reticulum (SR), RyRs and InsP3Rs. For the next context, the functionality of these receptors in BC3H1 cells was studied. Acetylcholine 100mM (ACh), in Ca2+-free buffer, which would activate only muscarinic receptors producing InsP3 to activate InsP3Rs, did not induce [Ca2+]i transients (53 of 58 cells; Fig. 4A), but in external buffer containing Ca2+ACh induced an increase in [Ca2+]
itransients of 77872 nM (n= 72 cells), calculated as reported in Section
2.4.2. We have also tested the effects of the cell-permeant
InsP3R blocker, 2-aminoethoxydiphenyl borate (2-APB), in
BC3H1 cells [41]. 2-APB (75mM) blocked completely sponta-neous [Ca2+]
ioscillations (23/23 cells) and, as it was expected, a
subsequent application of ACh (100mM) did not induce any
Fig. 3 – Ca2+transients in BC3H1 cells. Cells were loaded with Fluo-3-AM for 30 min. (A) Spontaneous Ca2+ oscillations were registered in external buffer containing 2.5 mM Ca2+and (B) in Ca2+-free external buffer (1 mM EGTA). (C) Application of 10mM cyclopiazonic acid (CPA) blocked completely spontaneous [Ca2+]
ioscillations.
Fig. 4 – Agonist-induced Ca2+release in BC3H1 cells. (A) Addition of 100mM acetylcholine (Ach)-induced [Ca2+]
i transients in external buffer containing 2.5 mM Ca2+. When we substitute the Ca2+-containing to Ca2+-free buffer and 100mM ACh was applied, no [Ca2+]
itransient was induced and [Ca2+]ioscillations was eliminated. When we changed the Ca2+-free to Ca2+-containing buffer [Ca2+]
i increased gradually. (B) After addition of the cell-permeant InsP3R blocker, 2-APB (75mM) [Ca2+]ioscillations were completely blocked and additional application of ACh (100mM) did not induce any increase of [Ca2+]
increase of [Ca2+]
i (32/32 cells; Fig. 4B). In contrast, 10 mM caffeine, which activates most forms of RyRs[25]did not affect the level of [Ca2+]
i (54/54 cells, Fig. 4C). The above results suggest that InsP3Rs mediate the release of Ca2+from ER and generate [Ca2+]
ioscillation in BC3H1 cells.
3.3.2. Ca2+entry pathways through plasma membrane in BC3H1 cells
It has been proposed that the main Ca2+entry pathways in
non-excitable cells is by SOCs channels, which are activated by Ca2+store depletion[10,28]. However, it is not well
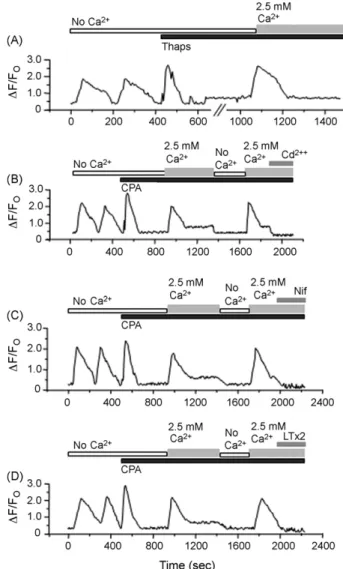
under-stood whether SOCs are present or not in BC3H1 cells, and whether VGCCs channels function in the plasma membrane. Application of 1mM Thaps in Ca2+-free external buffer induced an increase followed by a decrease in [Ca2+]
iin BC3H. Addition of 2.5 mM Ca2+to the external buffer, evoke a slow increase of [Ca2+]
i(28/28 cells), which indicates Ca2+ entry through the plasma membrane (Fig. 5A). In cells treated with 10mM CPA, the level of [Ca2+]
i increased gradually in the presence of
2.5 mM Ca2+and decreased when the buffer was changed to
Ca2+-free buffer. New addition of 2.5 mM Ca2+, resulted in an increase of [Ca2+]
i (32/32 cells; Fig. 5B). These increases of [Ca2+]
iwere abolished by the application of an inhibitor for SOC and VGCCs, 100mM Cd2+ (32/32 cells, Fig. 5B), by an inhibitor for L-type Ca2+channel, 5mM nifedipine (35/35 cells, Fig. 5C), and by 80mM LTx2 toxin (31/31 cells,Fig. 5D), which suggest that LTx2 toxin act upon these channels. The above
results suggest that entry of Ca2+ through the plasma
membrane is mediated mainly via VGCCs and that LTx2 toxin probably acts upon L-type channels.
Fig. 5 – Voltage-gated Ca2+channels were activated by depletion of Ca2+store in BC3H1 cells. (A) Application of 1mM thapsigargin (Thaps) induced a large [Ca2+]
itransient in cells present in Ca2+-free external buffer (no Ca2+). When the Ca2+-free external buffer was changed to 2.5 mM Ca2+-containing buffer [Ca2+]
iincreased gradually. (B) When the Ca2+store was depleted with 10mM cyclopiazonic acid (CPA) [Ca2+]
idecreased markedly. After addition of 2.5 mM Ca2+the [Ca2+]
iincreased gradually. Application of 100mM CdCl2reduced [Ca2+]isignificantly. (C) The same experiment was done in presence of 5mM nifedipine (Nif) or (D) 80mM LTx2. Both, Nif and LTx2 reduced significantly [Ca2+]
i.
Fig. 6 – [Ca2+]
ioscillations in individual BC3H1 cells observed in the presence of 80mM recombinant LTx2 with (lower panel) and without (upper panel) 1mM TTX. BC3H1 cells had Ca2+oscillations before LTx2 was added to bathing medium, even in the presence of TTX. Spontaneous [Ca2+]
ioscillations were abolished and there was a decrease in the basal level of [Ca2+]
3.3.3. LTx2 action on Ca2+channels
BC3H1 cells were loaded with Fluo-3-AM and visualized by confocal microscopy in the presence of the LTx2 without or with Na+channel blocker tetrodotoxin (1mM, TTX) (Fig. 6). Normal Ca2+oscillations (Fig. 6, upper panel) are mediated
by L-type Ca2+ channels and activating sarcoplasmic/
endoplasmic reticulum Ca2+–Mg2+–ATPase (SERCA) inducing action potentials[7,19,24,37], and can be used as antagonists
screening with toxins. When Na+ channel-induced
mem-brane depolarization was blocked, Ca2+channels were the
only alternative for inducing membrane depolarization. We noted that spontaneous [Ca2+]
ioscillations were abolished and that there was a decrease in the basal level of [Ca2+]
iin
the presence of 80mM LTx2 and 1mM TTX (Fig. 6, lower
panel). BC3H1 cells had Ca2+ oscillations before LTx2
was added to bathing medium, even in the presence of
TTX (Fig. 6, lower panel). These data are consistent
with another study [21] that showed similar results with
extracted venom, suggesting the presence of toxins that block L-type Ca2+channels.
3.4. Expression of RyR, InsP3R and VGCCs in BC3H1 cells
only the N-type Ca2+ channel could not be detected (Fig. 7D–F).
4.
Discussion
4.1. Ca2+oscillation and Ca2+release from ER in
BC3H1 cells
Spontaneous [Ca2+]
i oscillations evoked by Ca2+-mobilizing stimuli are present in many types of non-excitable cells, such as pancreatic acinar cells[23,27], oocytes[20], liver cells, and
fibroblasts [8]. As shown in Fig. 3, BC3H1 cells showed
spontaneous [Ca2+]
i oscillations without agonists stimuli
(Fig. 3A). Our data obtained in Ca2+-free external buffer (Fig. 3A) and with Ca2+pump ATPase inhibitors (Fig. 3B and C) clearly indicate that the intracellular Ca2+store is the main source of Ca2+for [Ca2+]
ioscillations. However, Ca2+influx is required to maintain these Ca2+oscillations, which can refill
the intracellular Ca2+ stores by influx across the plasma
membrane. Then, the decrease of amplitudes of [Ca2+]
i oscillations in Ca2+-free external buffer (Fig. 3B) may be explained by absence of Ca2+influx.
InsP3R and RyR receptors are known to participate in
release of Ca2+from the intracellular stores[8], and have been suggested to explain the mechanisms of [Ca2+]
ioscillations [13]. It has been proposed that [Ca2+]
ioscillations are generated by either fluctuating or sustained concentrations of cytosolic InsP3[5]. Recently, it was reported that [Ca2+]ifluctuations are
induced by InsP3 levels through a dynamic and rapid
uncoupling of G-protein coupled receptors[26]. This finding could explain our results of [Ca2+]
ioscillations and calcium entry through by plasma membrane, but additional studies are necessary.
This is the first work which presents the nature and functional roles of the intracellular Ca2+stores in BC3H1 cells. It is not known whether a caffeine/ryanodine-sensitive store exists in BC3H1 cells. We demonstrated Ca2+release from ER
via InsP3Rs (Fig. 3B and C). However, because caffeine
presented no effect in [Ca2+]
i, in BC3H1 cells (Fig. 4C) and because the expression of RyRs mRNA is absent (Fig. 7A), we suggest that RyRs have a minor contribution if any contribu-tion to Ca2+release from internal stores. Taken together, our results demonstrate that InsP3Rs are the major source to Ca2+ release from ER in BC3H1 cells and that RyRs mRNA seem not to be expressed in this cell line at this stage. It has been described that at early stages of development InsP3R mRNA and functional InsP3-gated Ca2+release channels are widely expressed in virtually all tissues in mouse embryos, but RyR mRNA could only be detected in the myotome[34]. Therefore, we could speculate that functional RyRs might be present during or after differentiation to excitable cells.
4.2. Ca2+entry pathway in BC3H1 cells and LTx2 effect
Calcium influx through the plasma membrane plays a central role in controlling cellular activities. In spite of intensive
research, there is no consensus yet on how Ca2+ entry is
controlled in non-excitable cells. In most non-excitable cells examined, the existence of SOC entry has been demonstrated
[10]. In this study, we first demonstrated the functional
expression of SOCs in BC3H1 cell line and the role of LTx2 toxin (Fig. 5D and Fig. 6). We also evaluated whether functional VGCCs are present in this cell line. We conclude here, that Ca2+ entry through plasma membrane is mainly mediated by the SOCs receptors in BC3H1 cell line and that LTx2 blocks L-type Ca2+channels.
Given that LTx1, LTx2 and LTx3 have very similar structures, differing from one another by only 1–3 residues
[40]it is likely that LTx1 and LTx3 also act on Ca2+channels. However, only the expression and biological characterization of the recombinant of LTx1 and LTx3 toxins can reveal their molecular targets.
Acknowledgments
This work was supported by grants from Fundac¸a˜o de Amparo a` Pesquisa do Estado de Minas Gerais (FAPEMIG)—Contract no. CBB 718/05 and Contract no. CBB APQ-4615-4.01/07, PRONEX and by Conselho Nacional de Desenvolvimento Cientı´fico e Tecnolo´gico Process 471080/2006-3. R.R. Resende is supported by a postdoctoral research fellowship from FAPESP. English editing has been performed throughout the text by native English speaker Avishek Adhikari from Department of Biological Sciences, Columbia University, New York, USA.
r e f e r e n c e s
[1] Agrawal N, Malhotra P, Bhatnagar RK. Interaction of gene-cloned and insect cell-expressed aminopeptidase N of Sdoptera liturawith insecticidal crystal protein Cry1C. Appl Environ Microb 2002;68:4582–92.
[2] Altschul SF, Madden TL, Shaffer AA, Zhang J, Zhang Z, Miller W, et al. Gapped BLAST and PSI-BLAST: a new generation of protein database search programs. Nucleic Acids Res 1997;25:3389–402.
[3] Berridge MJ. Inositol trisphosphate and calcium signaling. Nature 1993;361:315–25.
[4] Berridge MJ. Elementary and global aspects of calcium signaling. J Physiol 1997;499:291–306.
[5] Berridge MJ, Lipp P, Bootman MD. The versatility and universality of calcium signaling. Nat Rev Mol Cell Biol 2000;1:11–21.
[6] Bradford MM. A rapid and sensitive method for the quantification of microgram quantities of protein utilizing the principle of protein–dye binding. Anal Biochem 1976;72:248–54.
[7] Bultynck G, De Smet P, Weidema AF, Ver Heyen M, Maes K, Callewaert G, et al. Effects of the immunosuppressant FK506 on intracellular Ca2+release and Ca2+accumulation mechanisms. J Physiol 2000;525:681–93.
[8] Clapham DE. Calcium signaling. Cell 1995;80:259–68. [9] Corzo G, Gilles N, Satake H, Villegas E, Dai L, Nakajima T,
et al. Distinct primary structures of the major peptide toxins from the venom of the spiderMacrothele gigasthat bind to sites 3 and 4 in the sodium channel. FEBS Lett 2003;547:43–50.
[10] Elliot AC. Recent developments in non-excitable cell calcium entry. Cell Calcium 2001;30:73–93.
on the tarantulaLasiodora parahybana. Toxicon 1997;35: 805–6.
[12] Escoubas P, Diochot S, Corzo G. Structure and
pharmacology of spider venom neurotoxins. Biochimie 2000;82:893–907.
[13] Fewtrell C. Ca2+oscillations in non-excitable cells. Annu Rev Physiol 1993;55:427–54.
[14] Guatimosin SCF, Prado VF, Diniz CR, Cha´vez-Olo´rtegui C, Kalapothakis E. Molecular cloning and genomic analysis of TsNTxP; an immunogenic protein fromTityus serrulatus scorpion venom. Toxicon 1999;37:507–17.
[15] Guette C, Legros C, Tournois G, Goyffon M, Ce´le´rier M-L. Peptide profiling by matrix assisted laser desortion/ ionisation time-of-flight mass spectrometry of theLasiodora parahybanatarantula venom gland. Toxicon 2006;47:640–9. [16] Grynkiewicz G, Poenie M, Tsien RY. A new generation of
Ca2+indicators with greatly improved fluorescence properties. J Biol Chem 1985;260:3440–50.
[17] Hallett MB, Dormer RL, Campbell AK. In: Siddle K, Hutton JC, editors. Peptide hormone action: a practical approach. New York: Oxford University Press; 1990. p. 115–50. [18] Kalapothakis E, Kushmerick C, Gusma˜o DR, Favaron GOC,
Ferreira AJ, Gomez MV, et al. Effects of the venom of a Mygalomorph spider (Lasiodorasp.) on the isolated rat heart. Toxicon 2003;41:23–8.
[19] Kidokoro Y. Spontaneous calcium action potentials in a clonal pituitary cell line and their relationship to prolactin secretion. Nature 1975;258:741–2.
[20] Kiselyov K, Xu X, Mozhayeva G, Kuo T, Pessah I, Mignery G, et al. Functional interaction between InsP3 receptors and store-operated Htrp3 channels. Nature 1998;397:255–9. [21] Kushmerick C, Carvalho FM, de Maria M, Massensini AR,
Romano-Silva MA, Gomez MV, et al. Effects of aLasiodora spider venom on Ca2+and Na+channels. Toxicon 2001;39:991–1002.
[22] Laemmli UK. Cleavage of structural proteins during the assembly of the head of bacteriophage T4. Nature 1970;227:680–5.
[23] LeBeau AP, Yule DI, Globlewski GE, Sneyd J. Agonist-dependent phosphorylation of the inositol
1,4,5-trisphosphate receptor: a possible mechanism for agonist-specific calcium oscillations in pancreatic acinar cells. J Gen Physiol 1999;113:851–72.
[24] Mackrill JJ, Challiss RA, O’Connell DA, Lai FA, Nahorski SR. Differential expression and regulation of ryanodine receptor and myo-inositol 1,4,5 trisphosphate receptor Ca2+ release channels in mammalian tissues and cell lines. Biochem J 1997;327:251–8.
[25] McPherson PS, Campbell KP. Characterization of the major brain form of the ryanodine receptor/Ca2+release channel. J Biol Chem 1993;268:19785–90.
[26] Nash MS, Young KW, Challiss RS, Nahorski SR. Intracellular signalling. Receptor-specific messenger oscillations. Nature 2001;413:381–2.
[27] Osipchuk YV, Wakui M, Yule DI, Gallacher DV, Petersen OH. Cytoplasmic Ca2+oscillations evoked by receptor
stimulation, G-protein activation, internal application of inositol triphosphate or Ca2+: simultaneous
microfluorimetry and Ca2+dependent Cl current recording in single pancreatic acinar cells. EMBO J 1990;9:697–704. [28] Parekh AB, Penner R. Store depletion and calcium influx.
Physiol Rev 1997;77:901–30.
[29] Penaforte CL, Prado VF, Prado MAM, Romano-Silva MA, Guimara˜es PEM, Gomez MV, et al. Molecular cloning of cDNAs encoding insecticidal neurotoxic peptides from the spiderPhoneutria nigriventer. Toxicon 2000;38:1443–9. [30] Rash LD, Hodgson WC. Pharmacology and biochemistry of
spider venoms. Toxicon 2002;40:225–54.
[31] Resende RR, Gomes KN, Adhikari A, Britto LRG, Ulrich H. Mechanism of acetylcholine-induced calcium signaling during neuronal differentiation of p19 embryonal cells in vitro. Cell Calcium 2008;43:107–21.
[32] Resende RR, Majumder P, Gomes KN, Brittto LRG, Ulrich H. P19 embryonal carcinoma cells as in vitro model for studying purinergic receptor expression and modulation of N-methyl-D-aspartate-glutamate and acetylcholine receptors during neuronal differentiation. Neuroscience 2007;146:1169–81.
[33] Roberto PG, Kashima S, Soares AM, Chiobato L, Fac¸a VM, Fuly AL, et al. Cloning and expression of an acidic platelet aggregation inhibitor phospholipase A2cDNA fromBohtrops jararacussuvenom gland. Protein Expr Purif 2004;37: 102–8.
[34] Rosemblit N, Moschella MC, Ondriasa´ E, Gutstein DE, Ondrias K, Marks AR. Intracellular calcium release channel expression during embryogenesis. Dev Biol 1999;206: 163–77.
[35] Sambrook J, Fritsh EF, Maniatis T. Molecular cloning: a laboratory manual, 2nd ed., New York: Cold Spring Harbor Laboratory Press; 1989.
[36] Sanger F, Nicklen S, Coulson AR. DNA sequencing with chain termination inhibitors. Proc Natl Acad Sci USA 1977;74:5463–7.
[37] Schlegel W, Winiger BP, Mollard P, Vacher P, Wuarin F, Zahnd GR, et al. Oscillations of cytosolic Ca2+in pituitary cells due to action potentials. Nature 1987;329:719–21. [38] Schubert D, Harris AJ, Devine CE, Heinemann S.
Characterization of a unique muscle cell line. J Cell Biol 1974;61:398–413.
[39] Sine SM, Taylor P. Functional consequences of agonist-mediated state transitions in the cholinergic receptor. Studies in cultured muscle cells. J Biol Chem 1979;254: 3315–25.
[40] Vieira ALG, Moura MB, Baba´ EH, Cha´vez-Olo´rtegui C, Kalapothakis E, Castro IM. Molecular cloning of toxins expressed by the venom gland ofLasiodorasp.. Toxicon 2004;44:949–52.