The influence of animals from embryo transfer on the genetic evaluation
of growth in Simmental beef cattle by using multi-trait models
Rodrigo Reis Mota
1, Paulo Sávio Lopes
1, Luiz Fernando Aarão Marques
2, Luciano Pinheiro da Silva
1,
Marcos Deon Vilela de Resende
3,4and Robledo de Almeida Torres
11
Departamento de Zootecnia, Universidade Federal de Viçosa, Viçosa, MG, Brazil.
2
Departamento de Zootecnia, Centro de Ciências Agrárias, Universidade Federal do Espírito Santo, Alegre,
ES, Brazil.
3
Embrapa Florestas, Colombo, PR, Brazil.
4
Departamento de Engenharia Florestal, Universidade Federal de Viçosa, Viçosa, MG, Brazil.
Abstract
The weight records from Simmental beef cattle were used in a genetic evaluation of growth with or without the inclu-sion of animals obtained by embryo transfer. A multi-trait model in which embryo transfer individuals were excluded (MTM1) contained 29,510 records from 10,659 animals, while another model without exclusion of these animals (MTM2) contained 62,895 weight records from 23,160 animals. The weight records were adjusted for ages of 100, 205, 365, 450, 550 and 730 days. The (co)variance components and genetic parameters were estimated by the re-stricted maximum likelihood method. The (co)variance components were similar in both models, except for maternal permanent environment variance. Direct heritabilities (h2
d) in MTM1 were 0.04, 0.11, 0.20, 0.27, 0.31 and 0.42, while
in MTM2 they were 0.11, 0.11, 0.17, 0.21, 0.22 and 0.26 for 100, 205, 365, 450, 550 and 730 days of age, respec-tively. Estimates of h2
din MTM1 were higher than in MTM2 for the weight at 365 days of age. Genetic correlations
be-tween weights in both models ranged from moderate to high, suggesting that these traits may be determined mainly by the same genes. Animals from embryo transfer may be included in the genetic evaluation of Simmental beef cattle in Brazil; this inclusion may provide potential gains in accuracy and genetic gains by reducing the interval between generations.
Keywords: body weight, (co)variance components, heritability. Received: May 30, 2012; Accepted: October 8, 2012.
Introduction
In beef cattle breeding, dams exert a greater influence on the phenotype of the progeny than sires. In addition to their genetic contribution, females contribute to the mater-nal environment of the progeny. The influence of matermater-nal environment on animal phenotype is known as the maternal effect. Genetic differences among dams are expressed in their offspring through the maternal environmental contri-bution (Willham, 1963).
The efficacy of a breeding program depends on the accuracy of the genetic evaluation to which individuals are submitted. Consequently, there is a need to develop models that can provide more reliable genetic parameters in order to improve the classification of individuals and quantify their contribution to genetic gain. To obtain a more reliable estimate of (co)variance components and achieve better
re-sponses to selection it is essential to consider the produc-tion and genealogy of females so that each effect (additive direct genetic effect, additive maternal genetic effect and maternal permanent environmental effect) can be properly estimated (Pires and Lopes, 2001).
The reproductive rate of beef cattle can be combined with the use of reproductive biotechnologies to accelerate genetic changes in herds (Bilhassiet al., 2010). Among the techniques available, embryo transfer (ET) has been used in cattle and, when coupled with artificial insemination and quantitative genetic techniques, allows large scale genetic gains in animal breeding programs. Selection becomes quicker and more accurate because of an increase in selec-tion intensity and a decrease in the interval between genera-tions due to several offspring per female (Costa and Silva, 2004). Based on simulated data, Souza (Souza GH, 2008, PhD thesis, Universidade Federal de Viçosa, Viçosa, MG, Brazil) reported that over a period of 42 years reproduction by traditional methods would result in only six generations
Send correspondence to Rodrigo Reis Mota. Rua José Teotônio Pacheco 270/301, Clélia Bernardes, 36570-000 Viçosa, MG, Brazil. E-mail: [email protected].
whereas a breeding program that included animals obtained by ET would involve 14 generations.
However, the use of ET creates problems with the ge-netic evaluation of animals because it does not allow esti-mation of the maternal effects of the biological mother (additive genetic effects and permanent environment ef-fect) since the offspring are raised by a foster dam rather than by the biological mother. The most common solution to this problem is to exclude animals produced by ET from the genetic evaluation of traits for which the maternal effect may be important. This is done because the maternal per-manent environmental effect is provided by the foster dam rather than by the biological mother. Besides, in most cases, the offspring of a single biological mother are raised by dif-ferent foster cows. However, the exclusion of these animals can reduce the accuracy of estimates of (co)variance com-ponents and genetic parameters and the prediction of breed-ing values.
An alternative to the foregoing approach would be to include the genealogy of the biological mother in the analy-sis of the additive maternal genetic effect (this would pro-vide more accurate estimates of (co)variance components) and exclude the genealogy of the biological mother (to eliminate the maternal permanent environmental effect provided by foster dams that are usually not Simmental dams). To be possible the estimation of additive direct ge-netic and additive maternal gege-netic effects, this approach includes the foster dams as random effects in the model; however, these dams are included with no known geneal-ogy and no relationship with animals in the solutions vec-tor. In addition, each progeny is considered to originate from a different foster dam,i.e., even if a foster dam has more than one progeny each calf is considered as if the fos-ter dams were different (Van Vleck, 1990).
In a study of Simmental beef cattle using multi-trait models for weight at 100 and 120 days, Bilhassi et al.
(2010) noted that higher direct heritability values were ob-tained with models that included animals obob-tained by ET and concluded that the inclusion of these animals provided greater genetic gains in breeding programs. Since the inclu-sion of animals from ET may lead to greater genetic gains and since few studies have used this approach, the aim of this work was to employ multi-trait models to assess the ef-fect of including animals obtained by ET on genetic evalua-tion in Simmental cattle.
Material and Methods
The database analyzed in this study consisted of the weights of Simmental beef cattle from 485 farms and was provided by the Brazilian Association of Simmental and Simbrasil Breeders (Associação Brasileira de Criadores das Raças Simental e Simbrasil - ABCRSS), located in the mu-nicipality of Cachoeiro de Itapemirim, ES, Brazil. Weight records from the 60thto the 819thdays of age of animals born between 1974 and 2006 were used.
Two data files were prepared for the analysis using multi-trait models (MTM). In the first file (MTM1), ani-mals produced by the ET technique were excluded whereas in the second file (MTM2) these individuals were included. The method proposed by Van Vleck (1990) was used in this analysis. This method includes the genealogy of the biolog-ical mother for estimation of the additive maternal genetic effect and the foster dams with no known genealogy and no relationship with animals present in the solutions vector, thus allowing assessment of the additive direct genetic and additive maternal genetic effect, as well as estimation of the maternal permanent environmental effect.
Calves from cows whose ages at calving were < 700 and > 2340 days were excluded from the analyses. The con-temporary group defined by animals of the same sex, year, season (1 = January to March, 2 = April to June, 3 = July to September and 4 = October to December) and farm of birth was considered as the fixed effect while the age classes (in days) of the cows at calving (class 1: 700-1,109; class 2: 1,110-1,519, class 3: 1,520-1,919 and class 4: 1,920-2,340) were considered as a covariate in the linear and quadratic effect. The additive direct genetic, additive maternal and maternal permanent environmental effects were considered as random effects. Contemporary groups with less than three observations were excluded from the analyses.
The data files used in this study consisted of weights adjusted for ages at 100 (W100), 205 (W205), 365 (W365), 450 (W450), 550 (W550) and 730 (W730) days old; these weights corresponded to values obtained from animals in the age intervals of 60-149, 150-299, 300-419, 420-499, 500-619 and 620-819 days old, respectively.
The weights were adjusted using the expression:
AWi = Wj + [(Wi - Wj)/(Di)] x (Ii)
where AWi = weight adjusted for age i, Wi = weight served close to standard age Ii, Wj = previous weight ob-served at weight Di, Ii = standard age [i = 1 (100 days)... 6 (730 days) and Di = age (in days) of observation Wi.
Weight records outside the ranges defined by the av-erage of the contemporary group (about three standard de-viations) were excluded. After constraints, MTM1 consisted of 29,510 records from 10,659 animals (the prog-eny of 1,289 sires and 7,332 dams) and MTM2 consisted of 62,895 records from 23,160 animals (the progeny of 1,558 sires and 9,699 dams). Tables 1 and 2 summarize the de-scriptive statistics of files MTM1 and MTM2, respectively. Table 3 shows the structure of MTM1 and MTM2 in rela-tion to the number of records per animal. The pedigree of the animals was renumbered using the program Renped de-veloped by Silva (Silva FG, 2011, MSc thesis, Univer-sidade Federal de Viçosa, Viçosa, MG, Brazil). The numerator relationship matrix used in the analyses con-tained 41,904 animals.
(co)variance components were performed with the re-stricted maximum likelihood (REML) method (Patterson and Thompson, 1971) using WOMBAT software (Meyer, 2007). The convergence criterion was defined as the default setting of the software.
Multi-trait model
The traits were analyzed in pairs using two-trait anal-ysis in which n = p(p - 1)/2, where n is the number of analy-ses done and p is the number of traits (total of 15 combinations: W100-W205, W100-W365, W100-W450, W100-W550, W100-W730, W205-W365, W205-W450, W205-W550, W205-W730, W365-W450, W365-W550, W365-W730, W450-W550, W450-W730 and
W550-W730). This analysis provided estimates of the (co)vari-ance components and genetic parameters.
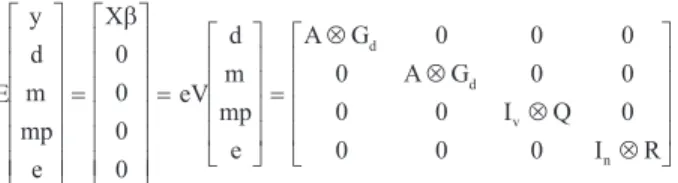
The animal model, with six weight traits (weight at 100, 205, 365, 450, 550 and 730 days of age), was de-scribed in matrix notation as follows:
y=Xb+Z d1 +Z m Z mp e2 + 3 +
where y = vector of observations,b = vector of fixed ef-fects, d = vector of additive direct genetic random efef-fects, m = vector of additive maternal genetic random effects, mp = vector of maternal permanent environmental random effects, X = incidence matrix for fixed effects, Z1, Z2and
Z3= incidence matrices for additive direct genetic, additive
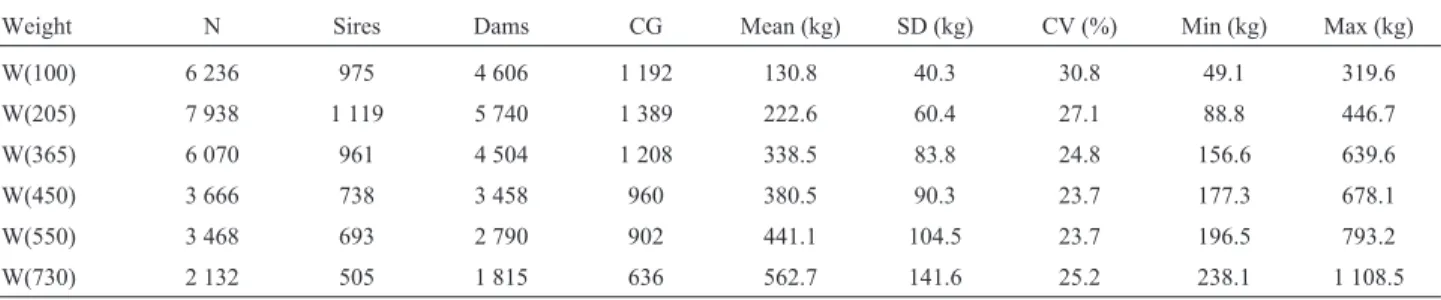
maternal genetic and maternal permanent environmental Table 1- Description of weights from file MTM1 pre-adjusted to 100 (W100), 205 (W205), 365 (W365), 450 (W450), 550 (W550) and 730 (W730) days old.
Weight N Sires Dams CG Mean (kg) SD (kg) CV (%) Min (kg) Max (kg)
W(100) 6 236 975 4 606 1 192 130.8 40.3 30.8 49.1 319.6
W(205) 7 938 1 119 5 740 1 389 222.6 60.4 27.1 88.8 446.7
W(365) 6 070 961 4 504 1 208 338.5 83.8 24.8 156.6 639.6
W(450) 3 666 738 3 458 960 380.5 90.3 23.7 177.3 678.1
W(550) 3 468 693 2 790 902 441.1 104.5 23.7 196.5 793.2
W(730) 2 132 505 1 815 636 562.7 141.6 25.2 238.1 1 108.5
Table 2- Description of weights from file MTM2 pre-adjusted to 100 (W100), 205 (W205), 365 (W365), 450 (W450), 550 (W550) and 730 (W730) days old.
Weight N Sires Dams CG Mean (kg) SD (kg) CV (%) Min (kg) Max (kg)
W(100) 13 102 1 197 6 247 2 029 130.5 38.7 29.7 46.4 319.6
W(205) 16 585 1 352 7 652 2 380 224.1 57.6 25.7 83.7 454.2
W(365) 13 090 1 173 6 155 2 099 341.1 79.6 23.3 154.5 641.1
W(450) 7 930 917 4 260 1 657 383.0 85.1 22.2 177.3 678.1
W(550) 7 551 859 4 037 1 557 447.3 100.1 22.4 193.6 815.8
W(730) 4 637 653 2 746 1 125 566.4 133.5 23.6 238.1 1 108.5
CG - contemporary groups; CV - coefficient of variation; Max - maximum value; Min - minimum value; N - number of observations; SD - standard devia-tion.
Table 3- Number of records per animal in files MTM1 and MTM2.
MTM1 MTM2
Records Number of animals Percentage (%) Number of animals Percentage (%)
Total 10 659 100 23 160 100
Animals with 1 record 2 915 27.35 6 473 27.95
Animals with 2 records 2 401 22.53 5 433 23.46
Animals with 3 records 1 938 18.18 4 352 18.79
Animals with 4 records 1 624 15.23 3 243 14.00
Animals with 5 records 1 203 11.29 2 426 10.48
random effects, respectively, and e = vector of residual ran-dom effects.
In using this model, the following assumptions were:
E y d m mp e X 0 0 0 0 eV d é ë ê ê ê ê ê ê ù û ú ú ú ú ú ú = é ë ê ê ê ê ê ê ù û ú ú ú ú ú ú = b m mp e A G A G I Q I R d d v n é ë ê ê ê ê ù û ú ú ú ú = Ä Ä Ä Ä é ë ê ê ê
0 0 0
0 0 0
0 0 0
0 0 0
ê ù û ú ú ú ú
where Gd= (co)variance matrix of additive direct genetic
effects, Gm= (co)variance matrix of additive maternal
ge-netic random effects, Q = (co)variance matrix of maternal permanent environmental random effects, R = (co)variance matrix of residual random effects, A = numerator relation-ship matrix, Iv= identity matrix whose order is the number
of dams, In= identity matrix whose order is the number of
observations and = Kronecker product operator.
The covariance between additive direct genetic and additive maternal genetic effects was assumed to be equal to zero.
Results and Discussion
Figure 1 shows that the direct genetic variances (s2d)
for both models (MTM1 and MTM2) tended to increase during growth, although the estimates for MTM2 were gen-erally lower than those for MTM1,i.e., the inclusion of ani-mals originating from ET reduced the additive genetic variances. The estimates of additive genetic variances ob-tained here differed from those reported by Bilhassiet al.
(2010) for this same breed of beef cattle.
The estimates of maternal genetic variances (s2m)
showed a similar behavior, except that the values for MTM2 were generally higher than those for MTM1 (Figu-re 1). These estimates inc(Figu-reased up to 205 days of age then decreased from 205 to 365 days, with a new increase from 365 to 450 days and another drop from 450 to 550 days, fol-lowed by a marked increase in the last age interval, espe-cially in MTM2. Increases in the estimates of s2m until
weaning are expected since this period corresponds to the interval of greatest maternal influence. The behavior of ma-ternal genetic variances observed here was similar to that reported by Menezes (Menezes GRO, 2010, PhD thesis, Universidade Federal de Viçosa, Viçosa, MG, Brazil) and Sousa Júnioret al.(2010) for Tabapuã beef cattle.
The behavior of maternal permanent environmental variances (s2mp) in MTM1 and MTM2 diverged at various
intervals along the growth curve (Figure 1). In MTM1, this variance increased progressively along the growth curve, whereas in MTM2 the variance increased up to 365 days and then dropped from 365 to 450 days, followed by a fur-ther increase from 450 to 550 days and a decline from 550 days. Bilhassiet al.(2010) also observed divergent behav-ior for the maternal permanent environmental variance in Simmental cattle. The difference in the behavior ofs2mp
be-tween MTM1 and MTM2 may be a reflection of variation in the average number of calves per cow at different age in-tervals in the same model. In MTM2, the average number of calves per cow was 2.3. At ages W450, W550 and W730, in which the maternal permanent environmental variance oscillated, this average was lower and may have influenced the estimates.
The estimates of residual variance (s2e) increased
with age, with no significant differences between MTM1 and MTM2. This lack of divergence may be a reflection of the decrease in the number of records at more advanced ages, leading to an increase in the residual and scale effect. Likewise, the phenotypic variance (s2p) also increased
al-most linearly with age in both models. This finding agreed with the results of Marqueset al.(1999), Baldi-Reyet al.
(2010), Menezes (2010) and Boligonet al.(2010), who re-ported a similar linear behavior for other beef cattle breeds.
The direct heritabilities (h2d) were of medium
magni-tude and similar in both groups, ranging from 0.04 to 0.42 in MTM1 and from 0.11 to 0.26 in MTM2. However, at older ages, the estimates were higher in model MTM1 com-pared to MTM2 (Table 4). These results were similar to those reported by Marqueset al.(2000), who reported di-rect heritability values of 0.08, 0.13, 0.19 and 0.24 at ages W100, W205, W365 and W550, respectively, in a model similar to MTM1, in this same cattle breed. The similarity in the values for MTM1 and MTM2 seen here may indicate that the inclusion of animals from ET allows congruent or even higher genetic gains in a breeding program, mainly by increasing the accuracy of selecting females and young ani-mals.
The maternal heritability (h2m) estimates were similar
in the two models but tended to be low, with values ranging from zero to 0.06; Marqueset al.(2000) also reported esti-mates of h2mvarying from zero to 0.05 in this same breed.
However, in contrast to h2d, the estimates of h2mfor MTM1
were slightly lower than those for MTM2. The lower mater-nal heritability values for MTM1 may possibly be associ-ated with higher direct heritability values because of differ-ences in the partitioning of additive direct and additive maternal genetic variances for weights from 100 days until maturity.
The proportion of maternal permanent environment variances (mp2) were similar in MTM1 and MTM2, indi-cating that although the foster dams had a different genetic composition there was no difference in the variation be-tween the two groups. In a similar study, Bilhassiet al.
(2010) reported approximate mp2values for analyses with and without animals obtained by ET.
In the two models used here, the direct genetic corre-lations ranged from moderate to high, indicating that the traits are partly determined by the same genes and that se-lection for one of these traits will result in favorable re-sponses for the others,i.e., genetic gains can be obtained at a given age by selection at another (Table 5). These results are similar to those reported by Dibet al.(2008) who re-ported values from 0.84 to 1.0 for several weights in Sim-mental beef cattle. In addition, the high correlation between weight at earlier ages and mature weight indicated that the
selection of animals for greater weight at earlier ages would probably result in greater weight at maturity.
The residual correlations between MTM1 and MTM2 were similar but of lower magnitude when compared with additive direct genetic correlations. These values are coher-ent with those reported for Simmcoher-ental beef cattle (Marques
et al., 2000; Dibet al., 2008; Bilhassiet al., 2010). Table 6 shows estimates of the maternal genetic and maternal permanent environmental correlations. Overall, maternal genetic correlations were high for MTM1 and me-Figure 1- Average estimates of additive direct genetic (s2
d), additive maternal genetic (s2m), maternal permanent environmental (s2mp), residual (s2e)
and phenotypic (s2
p) variances from data files MTM1 (▲) and MTM2 (■) for weights at 100 (W100), 205 (W205), 365 (W365), 450 (W450), 550
dium to high for MTM2. However, these correlations di-verged considerably at certain ages, in which negative estimates were observed for MTM1. These results differ from those reported by Menezes (2010), who obtained high positive correlations in Tabapuã beef cattle. In contrast, the estimates of maternal permanent environmental correla-tions were positive, except for that between W100 and W730 (-0.16) in MTM2; the values in this model were moderate to high and were slightly higher in MTM1 (Ta-ble 6). Medium to high values indicate that the environmen-tal effects promoted by the dam during the pre-weaning phase are of fundamental importance throughout the life of the animal. This finding reinforces the need for cows with a
good maternal ability to ensure the success of breeding programs in beef cattle (Menezes, 2010).
The phenotypic correlations estimated among ages W100, W205, W365, W450, W550 and W730 in MTM1 and MTM2 were of medium magnitude and higher at closer ages (Table 7). These findings were similar to those re-ported by Marques et al. (2000), who rere-ported phenotypic correlations from 0.31 to 0.74.
Conclusions
The influence of including animals obtained by the ET technique in genetic evaluations can be assessed using multi-trait models. In the case of Simmental beef cattle, the inclusion of such animals can lead to gains in the accuracy, as well as greater genetic gains, because of the decrease in the interval between generations.
Table 4- Estimates of direct (h2
d) and maternal (h2m) heritabilities and
proportion of maternal permanent environmental (mp2) and residual
(ec2) variances in relation to total phenotypic variance obtained from data files MTM1 and MTM2 (in parentheses) for weights at 100 (W100), 205 (W205), 365 (W365), 450 (W450), 550 (W550) and 730 (W730) days old.
Weight h2d
a
h2m a
mp2 a ec2 a
W100 0.04 (0.11) 0.01 (0.01) 0.09 (0.14) 0.85 (0.74)
W205 0.11 (0.11) 0.01 (0.02) 0.08 (0.10) 0.81 (0.76)
W365 0.20 (0.17) 0.00 (0.01) 0.08 (0.12) 0.72 (0.71)
W450 0.27 (0.21) 0.01 (0.03) 0.10 (0.10) 0.62 (0.66)
W550 0.31 (0.22) 0.00 (0.01) 0.08 (0.10) 0.61 (0.67)
W730 0.42 (0.26) 0.03 (0.06) 0.06 (0.03) 0.50 (0.65)
a
Average of two-trait analyses for MTM1 and MTM2 (in parentheses).
Table 5- Estimates of direct genetic (above the diagonal) and residual (below the diagonal) correlations obtained from files MTM1 and MTM2 (in paren-theses) for weights at 100 (W100), 205 (W205), 365 (W365), 450 (W450), 550 (W550) and 730 (W730) days old.
Weight W100 W205 W365 W450 W550 W730
W100 - 0.99 (0.82) 0.92 (0.69) 0.66 (0.59) 1.00 (0.75) 0.82 (0.71)
W205 0.63 (0.66) - 0.99 (0.92) 1.00 (0.86) 0.96 (0.87) 1.00 (0.76)
W365 0.21 (0.29) 0.41 (0.49) - 0.94 (0.98) 0.93 (0.95) 0.83 (0.80)
W450 0.35 (0.39) 0.39 (0.47) 0.90 (0.90) - 0.98 (0.97) 0.92 (0.88)
W550 0.16 (0.29) 0.32 (0.41) 0.76 (0.77) 0.87 (0.89) - 1.00 (0.95)
W730 0.06 (0.18) 0.24 (0.35) 0.53 (0.59) 0.65 (0.72) 0.62 (0.74)
-Table 6- Estimates of maternal (above the diagonal) and maternal permanent environmental (below the diagonal) genetic correlations obtained from files MTM1 and MTM2 (in parentheses) for weight at 100 (W100), 205 (W205), 365 (W365), 450 (W450), 550 (W550) and 730 (W730) days old.
Weight W100 W205 W365 W450 W550 W730
W100 - 1.00 (1.00) 1.00 (1.00) 1.00 (1.00) -1.00 (0.48) -1.00 (0.96)
W205 1.00 (0.75) - -1.00 (1.00) -0.19 (0.69) -1.00 (0.64) -0.96 (0.65)
W365 0.88 (0.44) 0.89 (0.57) - 0.08 (1.00) 1.00 (1.00) -1.00 (0.99)
W450 0.69 (0.54) 0.67 (0.96) 1.00 (0.97) - 1.00 (1.00) -1.00 (0.79)
W550 0.82 (0.46) 1.00 (0.53) 0.85 (0.86) 1.00 (0.98) - 0.99 (0.40)
W730 1.00 (-0.16) 1.00 (0.54) 1.00 (0.97) 1.00 (1.00) 1.00 (1.00)
-Table 7- Estimates of phenotypic correlations obtained from files MTM1 (above the diagonal) and MTM2 (below the diagonal) for weights at 100 (W100), 205 (W205), 365 (W365), 450 (W450), 550 (W550) and 730 (W730) days old.
Weight W100 W205 W365 W450 W550 W730
W100 - 0.69 0.34 0.42 0.30 0.19
W205 0.69 - 0.53 0.53 0.46 0.4
W365 0.37 0.57 - 0.91 0.81 0.61
W450 0.44 0.56 0.92 - 0.91 0.74
W550 0.33 0.51 0.81 0.92 - 0.81
-Acknowledgments
The authors thank the Associação Brasileira de Cria-dores das Raças Simental e Simbrasil (Brazilian Association of Simbrasil and Simmental Cattle Breeders -ABCRSS) for providing the data used in this work.
References
Baldi-Rey FS, Alencar MM and Albuquerque LG (2010) Estima-tivas de parâmetros genéticos para características de cresci-mento em bovinos da raça Canchim utilizando modelos de dimensão finita. Braz J Anim Sci 39:2409-2417 (Abstract in English).
Bilhassi TB, Araújo Neto FR, Diaz IDP, Pessoa MC, Oliveira HN and Marques LFA (2010) Efeito da inclusão de animais provindos de transferência de embriões na avaliação ge-nética de medidas ponderais na raça Simental. Proceedings of the 8th Simpósio da Sociedade Brasileira de Melho-ramento Animal, Maringá, PR (Abstract in English). Boligon AA, Mercadante MEZ, Forni S, Lôbo RB and
Albuquer-que LG (2010) Covariance functions for body weight from birth to maturity in Nellore cows. J Anim Sci 88:849-859. Costa PA and Silva FM (2004) Segurança sanitária em
transfe-rência de embriões: Revisão bibliográfia. Rev Bras Reprod Anim 28:253-258.
Dib MG, Araújo Neto FR, Marques LFA, Figueiredo LGG, Curi RA and Oliveira HN (2008) Inferência Bayesiana na estima-ção de parâmetros genéticos e componentes de (co)variância para características de desenvolvimento ponderal da raça Simental. Proceedings of the 7th Simpósio da Sociedade Brasileira de Melhoramento Animal, São Carlos, SP (Ab-stract in English).
Marques LFA, Pereira JCC, Oliveira HN, Pereira CS and Ber-gmann JAG (1999) Componentes de (co)variância e parâ-metros genéticos de características de crescimento da raça Simental no Brasil. Arq Bras Med Vet Zoot 51:363-370 (Abstract in English).
Marques LFA, Pereira JCC, Oliveira HN, Silva MA and Ber-gmann JAG (2000) Análise de característica de crescimento da raça Simental. Arq Bras Med Vet Zoot 52:527-533 (Ab-stract in English).
Meyer K (2007) WOMBAT - A tool for mixed model analyses in quantitative genetics by restricted maximum likelihood (REML). J Zhejiang Univ Sci B 8:815-821.
Patterson HD and Thompson R (1971) Recovery of inter-block in-formation when block sizes are unequal. Biometrics 58:545-554.
Pires AV and Lopes PS (2001) Efeito materno em suínos. Rev Ceres 48:115-125 (Abstract in English).
SAS (2004) Statistical Analysis Software. SAS Institute Inc., Cary, NC.
Sousa Júnior SCS, Oliveira SMP, Albuquerque LG, Boligon AA and Martins Filho R (2010) Estimação de funções de cova-riância para características de crescimento da raça Tabapuã utilizando modelos de regressão aleatória. Braz J Anim Sci 39:1037-1045 (Abstract in English).
Van Vleck LD (1990) Alternative animal models with maternal effects and foster dams. J Anim Sci 68:4026-4038. Willham LR (1963) The covariance between relatives for
charac-ters composed of components contributed by related indi-viduals. Biometrics 19:18-27.
Associate Editor: Bertram Brenig