Estimation of genetic parameters for growth traits in Tabapuã cattle using a
multi-trait model
Gilberto Romeiro de Oliveira Menezes1, Robledo de Almeida Torres2, Roberto Augusto de Almeida Torres Júnior1, Luiz Otávio Campos da Silva1, Andrea Gondo1, Ricardo Frederico
Euclydes2
1 Embrapa Gado de Corte, Campo Grande, MS, Brazil.
2 Departamento de Zootecnia, UFV, Viçosa, MG, Brazil. Productivity fellowship granted by CNPq.
ABSTRACT - To provide information that can contribute to the genetic evaluation and selection in Tabapuã cattle, genetic parameters were estimated for growth traits using a multi-trait animal model. (Co)variance components were estimated by a Bayesian approach using the Gibbs Sampler. Moderate and similar responses to selection are expected when selecting for weights at the four ages evaluated, since the direct heritability estimates were similar and of average magnitude (0.18 to 0.19). The direct and maternal additive genetic correlations between all pairs of weights were higher than 0.70, indicating a high degree of association between the four traits. This suggests that using any of them as selection criteria will result in correlated response in the others and that multi-trait analysis are recommended for the genetic evaluation of growth traits in beef cattle for exploiting this association.
Key Words: Bayesian, beef cattle, (co)variance components, genetic evaluation, selection
Introduction
The current market trend is to work with animals with faster growth, which spend less time on pastures or in feedlots, shortening the production cycle which in turn allows for greater economic return. As a result, selecting animals with higher weights at younger ages has been practiced in beef cattle breeding programs in Brazil (Boligon, 2008).
According to Sarmento et al. (2006), genetic evaluation and subsequent animal selection depend on several factors, including the availability of (co)variance components and genetic parameters estimates for the traits of interest. Among the models that can be used for the estimation of (co)variance components and genetic parameters for growth traits, the multi-trait model is an interesting alternative that has been applied in beef cattle studies, e.g., Boligon (2008), Baldi Rey (2008) and Costa et al. (2011). The choice of multi-trait models aims at achieving greater selection response by more efficiently using the available information, considering the existence of missing values caused by sequential selection and exploiting the correlations between the traits (Marques et al., 2001).
To provide information that will contribute to the processes of genetic evaluation and selection in Tabapuã cattle, (co)variance components and genetic parameters
for growth traits were estimated using a multi-trait animal model under a Bayesian approach.
Material and Methods
Data used were provided by the Brazilian Agricultural Research Corporation (Embrapa), which, since 1987, has been in charge of managing the National Beef Cattle Database for zebu breeds.
As the result of undetermined crossings between zebu cattle, in the 1940s, the Tabapuã zebu breed originated on Água Milagrosa farm, located in Tabapuã city, São Paulo State, Brazil. In 2012, 17,745 animals received birth genealogical registration (RGN) and 8,633 received definitive genealogical registration (RGD), representing 3.76% and 3.44%, respectively, of the total zebu cattle registered that year (ABCZ, 2013).
Weight records from the 75th to the 525th day of age from animals raised exclusively on pasture and born from 1976 to 2009 were used. Animals from embryo transfer (ET) or in vitro fertilization (IVF) and those for which the age at calving of the dam was less than 2.5 years or greater than 14.5 years were excluded from the analysis.
Weight records adjusted for the ages of 120 (W120), 240 (W240), 360 (W360) and 480 days (W480) were used. For the calculation of W120, W240, W360 and W480,
ISSN 1806-9290
www.sbz.org.br R. Bras. Zootec., v.42, n.8, p.570-574, 2013
records taken, respectively, between 75 and 165, 195 and 285, 315 and 405, and 435 and 525 days of age were used. Records out of the range given by the mean for animal sex group ± 3 standard deviations were excluded. Weights at older ages were used only if the animal had all the weights prior to that. The contemporary groups were defined by animals of the same sex, year, season (1 = January to March, 2 = April to June, 3 = July to September, 4 = October to December) and farm of birth. Only contemporary groups with at least five, two, two and two animals for W120, W240, W360 and W480, respectively, were kept. The analyzed data file comprised 214,837 weight records of 84,215 animals, from 1,530 sires, 33,821 dams and 1,564 maternal grandsires (Table 1).
For the elimination of uninformative animals and to reduce computational costs, a recursive algorithm was used to keep only individuals with own records (84,215) and their ancestors in the pedigree file. Thus, numerator relationship matrix comprised only informative individuals, totaling 111,959 animals.
The edition of the file was performed using the softwares SAS (Statistical Analysis System, version 9.0) and MATLAB (version 05.06.13).
The multi-trait animal model, with four growth traits, weight at 120 (W120), 240 (W240), 360 (W360) and 480 days of age (W480), can be described as:
4 1 l ijtk jt jt it i kt i l lgt tkijtk CG [b *z(DAC )] [c *(DBS)] a m mpe e
y
where:
yijtk = observation for trait t on individual i, born from dam j
and raised at contemporary group k; CGtk = fixed effect for
trait t of the contemporary group k, formed by individuals of the same sex, year, season (1 = January to March, 2 = April to June, 3 = July to September, 4 = October to December) and farm of birth; zl(DACi) = l-th function of the quadratic
spline adopted for modeling the effect of the age of dam at calving (DAC - ranging from 2.5 to 14.5 years old), where:
z1(DACi) = (DACi – 2.5)/12;
z2(DACi) = [z1(DACi)]2;
z3(DACi) = {maximum [0, (z1(DACi) – 1/3)]}2;
z4(DACi) = {maximum [0, (z1(DACi) – 2/3)]}2.
blgt = regression coefficient for function l of the model for
DAC for trait t and for individuals belonging to sex g; DBSi = deviation of the birth date of individual i to the
intermediate day of birth for the season at a given year; ckt =
regression coefficient to DBSi, nested within contemporary
group k, for trait t; ait = random direct additive genetic effect
of individual i, for trait t; mjt = random maternal additive
genetic effect of dam j, for trait t; mpejt = random maternal
permanent environmental effect of dam j, for trait t; eijtk =
random residual effect.
The model can be described, in matrix form, as follows: y = Xβ + Z1 a + Z2 m + Z3 p + e
where:
y = observations vector; β = fixed effects vector; a = direct additive genetic random effects vector; m = maternal additive genetic random effects vector; mpe = maternal permanent environmental random effects vector; X = fixed effects incidence matrix; Z1, Z2 and Z3 = direct additive
genetic, maternal additive genetic and maternal permanent environmental effects incidence matrices, respectively; and e = residual random effects vector.
The model is based on the following assumptions:
I R 0 0 0 0 I Q 0 0 0 0 A G A G 0 0 A G A G e mpe m a V e X e mpe m a y E o q m ma am a where:
Ga = 4 × 4 (co)variance matrix of direct additive genetic
effects; Gm = 4 × 4 (co)variance matrix of maternal additive
genetic effects; Gam = Gma’ = 4 × 4 (co)variance matrix
of direct-maternal additive genetic effects; Q = 4 × 4 (co)variance matrix of maternal permanent environmental effects; R = 4 × 4 (co)variance matrix of residual effects; A = numerator relationship matrix; Iq = identity matrix
whose order is equal to the number of dams; Io identity
matrix whose order is equal to the number of individuals with observations; and ⊗ = Kronecker operator.
Table 1 - Number of records (N), mean, standard deviation (SD) and coefficient of variation (CV) in the data file for males and females
Trait1,2 Males Females
N Mean SD CV N Mean SD CV
W120 42,749 125.0 20.7 16.6 41,466 117.2 19.3 16.4
W240 30,442 200.5 31.5 15.7 30,896 185.7 28.6 15.4
W360 19,091 233.7 39.1 16.7 21,762 212.7 35.4 16.6
W480 12,575 280.4 47.4 16.9 15,856 250.2 43.0 17.2
(Co)variance components were estimated by a Bayesian approach using the Gibbs Sampler with software Gibbs2f90. A 700,000-cycle chain with burn-in equal to 100,000 and sampling interval equal to 20, resulting in 30,000 recorded samples was used. Default prioris were considered. Convergence was verified by visual inspection of the chain graphs for each (co)variance component and by checking the effective sample size using the software Postgibbsf90.
Results and Discussion
(Co)variance components were successfully estimated. Visual inspection of the chain graphs for each component showed that stationality was achieved. Additionally, the effective sample sizes for all 56 estimated (co)variance components were over 25, with a mean of 240.
Overall, (co)variance component estimates (Table 2) were higher than those reported by Ferraz Filho et al. (2002) and lower than those reported by Campêlo et al. (2004). Both cited authors worked with Tabapuã cattle, but the first ones applied a single trait model while the last ones applied a two-trait model.
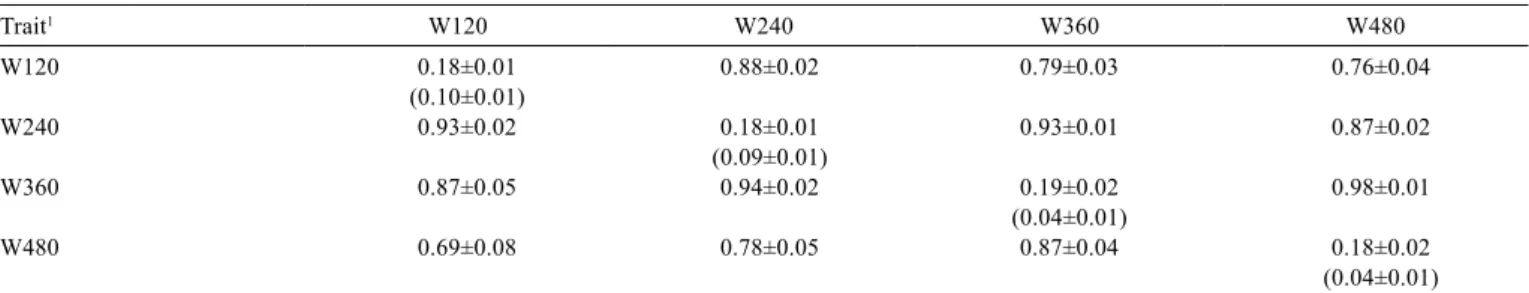
Direct heritability estimates (h2) were higher than those
reported by Ferraz Filho et al. (2002) and lower than those reported by Campêlo et al. (2004) (Table 3).Boligon (2008), Baldi Rey (2008) and Costa et al. (2011), who worked, respectively, with Nellore, Canchim and Angus breeds, reported, using a multi-trait model, higher h2 than this study
(>0.25) for weaning and yearling weights. Moderate and similar responses to selection are expected when selecting for weights at the four evaluated ages, since h2 were similar
and of average magnitude.
Maternal heritability estimates (h2
m) were lower than
those found by Campêlo et al. (2004), who reported h2 m
equal to 0.13 and 0.17 for W120 and W240, respectively (Table 3). Baldi Rey (2008) reported lower h2
m than those
found in this study, 0.03 and 0.02 for weaning and yearling
weights, respectively. Yet Costa et al. (2011) reported h2 m
close to 0.25 and 0.13 for weaning and yearling weight, respectively. A decrease in h2
m for weights at advanced ages
was found, agreeing with Ferraz Filho et al. (2002), Campêlo et al. (2004), Baldi Rey (2008) and Costa et al. (2011). Although of low magnitude, greater selection response for maternal ability in Tabapuã herds can be achieved by selecting on weights near the weaning period (240 days).
Direct and maternal additive genetic correlation estimates for all weight pairs were higher than 0.70, indicating a high association level among the four evaluated traits (Table 3). In the animal breeding context, this means that selection on any of the evaluated traits will significantly impact the others and reinforces how important it is to apply a multivariate approach when working with growth traits. These results agree with those reported by Boligon (2008), Baldi Rey (2008) and Costa et al. (2011). Additionally, these authors reported significantly higher direct additive genetic correlations between weaning weight and/or yearling weight and mature weights, implying that selection for weight at younger ages will lead to an increase in mature weight (Baldi Rey, 2008). According to Boligon (2008), these results reinforce the current concern about cow mature size for most beef cattle breeds, since some studies have shown low direct additive genetic correlation, although unfavorable, between mature weight and reproductive traits.
Maternal permanent environmental correlations estimates were high (Table 4), actually higher than those estimated for the direct and maternal additive genetic correlations. These results corroborate Costa et al. (2011), who reported estimates greater than 0.90 for correlations between weaning weight and weights at one and two years of age.
Direct-maternal additive genetic correlations estimates for W120, W240, W360 and W480 (Table 5) were, in general, similar in magnitude to those reported by Ferraz Filho et al. (2002) and Campêlo et al. (2004), who found
Table 2 - Posteriori means and standard deviations for (co)variance components for adjusted weights at different ages
(Co)variance components Trait1,2
W120 W240 W360 W480
σ2
g 44.1±3.6 97.6±8.3 133.7±12.2 170.3±16.5
σ2
m 23.2±2.1 50.4±5.2 30.9±4.5 34.0±6.0
σ2
mpe 24.5±1.4 57.4±3.7 46.9±4.6 47.9±5.1
σ2
r 157.9±2.1 364.1±5.2 502.0±8.1 708.5±11.8
σgm -8.7±2.2 -14.1±5.0 -10.1±5.8 -15.0±7.8
σ2
p 240.9±1.6 555.4±4.1 703.4±6.1 945.7±9.1
1 Adjusted weights at 120 (W120), 240 (W240), 360 (W360) and 480 days of age (W480). 2 in kg2.
σ2
p = σ2g + σ2m + σ2mpe + σ2r + σgm.
σ2
g - direct additive genetic variance; σ2m - maternal additive genetic variance; σ2mpe - maternal permanent environmental variance; σ2r - residual variance; σgm -direct-maternal additive
genetic covariance; σ2
estimates between -0.20 and -0.40. Costa et al. (2011) reported higher estimates: -0.74 and -0.68 for weaning and yearling weights, respectively. Non-zero direct-maternal additive genetic correlations estimates indicate that it is not advisable to assume a non-existent association between maternal and direct effect. This assumption has been adopted in some studies found in the literature. However, it is important to be aware that an adequate estimation of these effects requires a well structured and informative data file. The results indicated a little antagonism between genetic potential for growth (direct effect) and maternal ability (maternal effect), which should be considered in genetic evaluation and in selection processes.
Conclusions
Moderate genetic gains are expected when using the evaluated growth traits as selection criteria. The use of any one of those traits as selection criteria will result in
correlated response in the others. It is recommended to use multi-trait models in genetic evaluation for growth traits in beef cattle.
Acknowledgments
To National Council for Scientific and Technological Development (CNPq) for providing a doctoral fellowship to the first author. To Drs. Ignacy Misztal and Shogo Tsuruta, from the University of Georgia, USA.
References
ASSOCIAÇÃO BRASILEIRA DOS CRIADORES DE ZEBU - ABCZ. 2013. Estatística total Brasil RGN + RGD - período 1939 a 2012. Available at: <http://www.abcz.org.br/AreaTecnica/ RegistroGenealogico/Estatisticas>. Accessed on: May 20, 2013. BALDI REY, F.S. Estimação de parâmetros genéticos para
características de crescimento em bovinos da raça canchim com modelos de dimensão finita e infinita. 2008. 97f. Tese (Doutorado em Genética e Melhoramento Animal) - Universidade
Table 5 - Posteriori means and standard deviations for direct-maternal additive genetic effects correlation estimates for adjusted weights at different ages
Trait1 W120 W240 W360 W480
W120d -0.27±0.05 -0.25±0.06 -0.36±0.08 -0.38±0.09
W240d -0.25±0.06 -0.20±0.06 -0.31±0.08 -0.33±0.09
W360d -0.24±0.06 -0.21±0.05 -0.15±0.08 -0.20±0.09
W480d -0.23±0.06 -0.21±0.06 -0.18±0.08 -0.19±0.09
1 Adjusted weights at 120 (W120), 240 (W240), 360 (W360) and 480 days of age (W480).
d - direct additive genetic effect; m - maternal additive genetic effect.
Table 3 - Posteriori means and standard deviations for heritabilities and genetic correlations estimates for adjusted weights at different ages
Trait1 W120 W240 W360 W480
W120 0.18±0.01 0.88±0.02 0.79±0.03 0.76±0.04
(0.10±0.01)
W240 0.93±0.02 0.18±0.01 0.93±0.01 0.87±0.02
(0.09±0.01)
W360 0.87±0.05 0.94±0.02 0.19±0.02 0.98±0.01
(0.04±0.01)
W480 0.69±0.08 0.78±0.05 0.87±0.04 0.18±0.02
(0.04±0.01)
1 Adjusted weights at 120 (W120), 240 (W240), 360 (W360) and 480 days of age (W480).
Location of: direct heritabilities - diagonal; maternal heritabilities - diagonal and inside parentheses; direct additive genetic correlations - above the diagonal; maternal additive genetic correlations - below the diagonal.
Table 4 - Posteriori means and standard deviations for maternal permanent environmental (above the diagonal) and residual (below the diagonal) correlations estimates for adjusted weights at different ages
Trait1 W120 W240 W360 W480
W120 - 0.97±0.01 0.95±0.02 0.88±0.04
W240 0.52±0.01 - 0.99±0.01 0.97±0.02
W360 0.39±0.01 0.67±0.01 - 0.97±0.01
W480 0.34±0.01 0.56±0.01 0.72±0.01
Estadual Paulista/Faculdade de Ciências Agrárias e Veterinárias, Jaboticabal.
BOLIGON, A.A. Estimativas de (co)variância genética de pesos do nascimento até a maturidade em rebanhos a raça Nelore usando modelos de regressão aleatória e de características múltiplas. 2008. 87f. Dissertação (Mestrado em Genética e Melhoramento Animal) - Universidade Estadual Paulista/Faculdade de Ciências Agrárias e Veterinárias, Jaboticabal.
CAMPÊLO, J.E.G.; LOPES, P.S.; TORRES, R.A. et al. Maternal effects on the genetic evaluation of Tabapuã beef cattle. Genetic and Molecular Biology, v.27, n.4, p.517-521, 2004.
COSTA, R.B.; MISZTAL, I.; ELZO, M.A. et al. Estimation of genetic parameters for mature weight in Angus cattle. Journal of Animal Science, v.89, p.2680-2686, 2011.
FERRAZ FILHO, P.B.; RAMOS, A.A.; SILVA, L.O.C. et al. Tendência genética dos efeitos direto e materno sobre os pesos à desmama e pós-desmama de bovinos da raça Tabapuã no Brasil. Revista Brasileira de Zootecnia, v.31, n.2, p.635-640, 2002. MARQUES, L.F.A.; OLIVEIRA, H.N.; PEREIRA, J.C.C. Análises
uni e bicaracterística dos pesos de bovinos Simental. In: REUNIÃO ANUAL DA SOCIEDADE BRASILEIRA DE ZOOTECNIA, 38., 2001, Piracicaba. Anais... Piracicaba: Sociedade Brasileira de Zootecnia, 2001. (CD-ROM).