www.bjorl.org.br
Brazilian Journal of
OTORHINOLARYNGOLOGY
1808-8694/$ - see front matter © 2014 Associação Brasileira de Otorrinolaringologia e Cirurgia Cérvico-Facial. Published by Elsevier Editora Ltda. All rights reserved.
DOI: 10.5935/1808-8694.20140010
ORIGINAL ARTICLE
Sound pressure level generated by individual portable sound
equipment
Izabella dos Santos
a,b,*, Maria Francisca Colella-Santos
c, Christiane Marques do Couto
ca Hearing Health Training, Universidade Estadual de Campinas (UNICAMP), Campinas, SP, Brazil
b Postgraduate course in child and Adolescent Health, Universidade Estadual de Campinas (UNICAMP), Campinas, SP, Brazil c Department of Human Development and Rehabilitation, Faculdade de Ciências Médicas, Universidade Estadual de Campinas (UNICAMP), Campinas, SP, Brazil
Received 10 January 2012, accepted 23 August 2013
KEYWORDS
Ear canal;
External auditory canal; Music;
Young adult
PALAVRAS-CHAVE
Orelha externa;
Meato acústico externo; Música;
Adulto jovem
Abstract
Introduction: The use of Personal Digital Audio Players can cause hearing injuries, as the sound is generated directly in the ear canal. It is believed that different types of headphones can
cause different ampliications, since they cause changes in the volume and resonance of the
ear canal according to their depth.
Objective: This study aimed to determine the sound pressure to which young individuals are exposed when using Personal Digital Audio Players with two types of headphones: insertion earphones and anatomical insertion earphones
Materials and methods: This was an experimental study. The probe microphone measurements were made with different headphones in 54 ears (27 young individuals). The resonance peaks were also recorded.
Results: A statistically signiicant difference was observed between the evaluated headphones,
showing that anatomical insertion earphones had higher levels of sound pressure than insertion earphones for all frequencies measured. There was no correlation between the resonance peak of the closed canal and the frequency where the highest sound pressure level was obtained. There
was a signiicant difference between ears at some frequencies with the different headphones.
Conclusion: It was concluded that anatomical insertion earphones generate a higher sound pressure level than insertion earphones.
© 2014 Associação Brasileira de Otorrinolaringologia e Cirurgia Cérvico-Facial. Published by Elsevier Editora Ltda. All rights reserved.
Pressão sonora gerada por equipamentos sonoros portáteis individuais
Resumo
Introdução: O uso de equipamentos portáteis sonoros individuais pode ser um risco auditivo, pois o som é gerado diretamente no meato acústico externo. Acredita-se que fones diferentes proporcionam
ampliicações diferentes, pois causam variações de volume e de ressonância conforme suas inserções.
Objetivos: Veriicar a pressão sonora a que jovens estão expostos quando fazem uso de equi -pamentos sonoros portáteis individuais com dois diferentes fones: de inserção e de inserção anatômico.
Please cite this article as: Santos I, Colella-Santos MF, Couto CM. Sound pressure level generated by individual portable sound equipment.
Braz J Otorhinolaryngol. 2014;80:41-7.
* Corresponding author.
Introduction
Hearing is a sensory system of vital importance for humans who live in a society immersed in sounds and based on oral communication.
It is increasingly observed that the auditory system is ex-posed to high sound pressure levels, mainly by the changes in societal habits, such as venues where the sound is
am-pliied, the use of sound equipment in cars, and the use of
individual portable sound equipment, among others. Young individuals who, in today’s society do not know how to live
in silence and consider ampliied sounds to be common and
normal, are the segment of the population most exposed to
ampliied sounds.1
The technological revolution has greatly contributed to the acquisition of these new habits, launching new devices in the market that allow people to change their experiences. The technological developments that en-able the amplification of sounds are a prime example. In the past, the radio was the only means of communica-tion through which people learned the news. Over time this has evolved from portable radios so that today peo-ple can listen to the radio or to their favorite songs in any environment without affecting those around, as the sound comes from the the headphone and goes directly into the ear. This common attitude of listening to music
at any time and any place characterizes the contempo -rary behavior.2
The technological revolution has been so comprehensive that it improved not only the equipment that allows for the transmission of sound signals, but also the the quality of the headphones, so that the signal suffers no distortion until it reaches the auditory system. However, the technological developments have also allowed many young individuals to listen to their sound equipment for long periods of time, at very high sound intensities, without considering whether this habit can harm the auditory system in the long term.
Many studies have shown that the use of individual por-table sound equipment such as MP3 players and iPods can cause a reduction in the hearing thresholds of young individ-uals, as well as the early onset of auditory symptoms such as tinnitus and hearing problems.3-6
This concern affects everyone. Brazilian Law No. 11,291,
of April 26, 2006,7 requires that manufacturers of individu-al portable sound equipment inform customers that
hear-ing impairment may occur if the equipment is used above
85 dB. Yet, more importantly than disclaimers in products,
it is necessary that the users of these devices are aware of the risk they face.
The Brazilian Regulatory Standard 15 (RS 15),8 which
ad-dresses occupational medicine and safety, particularly the exposure of workers to noise, states that the maximum
al-lowable daily noise exposure for exposure level of 85 dBA is
eight hours. As an increase in sound intensity level occurs, the noise exposure time must decrease (for every 5 dB in-crease, time is halved). Additionally, according to RS 15,
individuals exposed to noise of 85 dBA must wear personal
protective equipment (PPE) to protect their hearing. How-ever, individual portable sound equipment can easily reach higher levels.
Studies have shown that such devices can reach up to 130 dB, which is equivalent to the sound pressure level gen-erated by a jackhammer. In context, the maximum allowed
volume of 85 dB corresponds to 65% of the total equipment
capacity. Based on these studies9 and others, which state
that almost 90% of the assessed young individuals use their
equipment at maximum capacity,6 it is possible to infer that these young individuals exceed the recommended sound pressure levels and can damage their hearing.
Santos and Couto,10 in their study of young individuals,
observed that they use their equipment on average for 1.83 hours a day, at a mean volume of 70% of the total equip -ment capacity. However, this same study observed, through measurements with a probe microphone, that the average equipment can reach peaks of 100 dB.
Speciically regarding the use of individual portable
sound equipment, a question must be raised: does the type
of headphone used favors greater ampliication of the sound
generated by the device? The use of headphones means that young individuals are at greater risk of exposure to high sound pressure levels, considering that the phone is inside the individual’s ear, further amplifying the sound. Addition-ally, the sound pressure level is inversely proportional to the volume of the external ear, which, due to its shape, functions as a resonance tube.11
Therefore, the sound pressure levels that these devices emit, which are measured by decibelimeters, are actually higher when measured in the ear of the young individuals,
near the tympanic membrane, as the ear canal ampliies
the sound.12
Material e método: Trata-se de uma pesquisa experimental. Para tanto, foram feitas medições em 54 orelhas de 27 jovens com idades entre 18 e 30 anos, com os dois tipos de fones. Também foram registrados picos de ressonância da orelha externa com e sem fone.
Resultados: Observou-se que o fone de inserção anatômico apresenta aumento do nível de
pressão sonora estatisticamente signiicante em comparação com o fone de inserção para todas as frequências avaliadas. Não há uma correlação entre o novo pico de ressonância do meato
fechado e a frequência na qual se obteve os maiores níveis de pressão sonora com o fone.
Ob-servou-se diferença estatisticamente signiicativa entre orelhas para algumas frequências com
os diferentes fones.
Currently, earphones available in the market include ex-ternal earphones, insertion earphones (IEs) that are made of rigid material and are located in the anterior portion of the external auditory meatus, and the anatomical insertion earphones (AIEs), which have a silicone tip, making them
more lexible. The latter can be used more internally in the
ear, preventing external sounds from interfering with the desired sound. Due to the insertion of this type of ear-phone inside the external auditory canal, there is proba-bly a change in the volume of the external ear, causing the
sound to be ampliied more.11
Some studies,13 evaluating different types of head-phones and the sound intensity they generate, observed that the output levels of IEs are on average 5.5 dB higher than the output levels of supra-aural headphones when the environmental noise where the person is located increases. Farina and Romagnosi5 developed an artiicial ear and, with the help of a probe microphone placed inside it, performed measurements in order to detect differences in sound pres-sure levels between devices, which reached values from 60
dBA to values greater than 100 dBA (mean 90 dBA). These
values, according to the researchers, are alarming, as they may endanger human hearing, and therefore it is necessary
to minimize the time of use (some equipment must be used
for only a few minutes a day) or reduce the volume of such equipment.
Therefore, this study aimed to determine the difference in sound pressure when young individuals use such equip-ment with AIEs and IEs i.e., to compare the levels of sound intensity obtained in each ear when exposed to the same
input signal and to verify statistically signiicant differenc -es between them. Furthermore, this study inv-estigated the correlation between the peak intensity with the AIE and the resonance frequency of the external ear.
Material and methods
Sample
The study included 27 young individuals aged between 18 and 30 years, of whom 29.63% (8 subjects) were males and 70.37% (19 subjects) were females, with a mean age of 23 years. Individuals aged < 18 or > 30 years, or those who had
any external auditory canal (EAC) impairment that could prevent the assessment were excluded from the study.
Equipment
The study was performed using measurement equipment
with probe microphone, the Hearing Aid Analyzer - Afinity® (Interacoustics). The equipment has a central unit (hard-ware) connected to a computer, a microphone system (one reference microphone and one probe microphone with an
internal diameter of 1.8 mm), a high-resolution compressor
connected to a speaker, a video monitor, and a printer for recording the results.
The equipment generates, through the speaker, a
sig-nal in free ield and a reference microphone ensures that
the initially set level of sound pressure remains unchanged
throughout the measurement. It allows the performance
of the examination in the frequency range of 125-8,000 Hz
with a frequency resolution option of 12 or 24 steps/octave.
Recorded frequency accuracy is within ± 3%. For the test,
the speaker was turned off and music generated by the pa-tient’s electronic device was be used. The equipment has an
intensity test range of 40-90 dB SPL with accuracy of ± 1.5 dB and harmonic distortion of the stimulus < 1%. The range of in -tensity measured with the probe microphone is 40 to 140 dB SPL, with a variation of ± 2 dB.
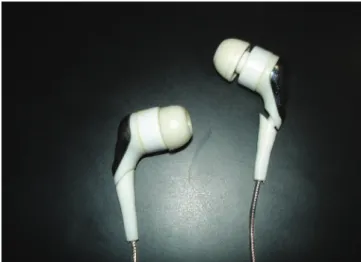
The sound device used was a Philips MP4 player®, Sony IE® (Fig. 1) and Sony AIE® (Fig. 2).
An analog caliper was used to measure the depth, in millimeters, of AIE penetration in the external ear, using the tragus as the starting point.
Procedures
The study involved the collaboration of volunteers. First, the subjects were informed about the study and signed an informed consent. The project was presented to the re-search ethics committee of the institution, and approved
under number 229/2008. Additionally, the project is in ac
-cordance with resolution 196/96 of the Brazilian National
Health Council.
Figure 1 Insertion earphones.
First, the external auditory canal was inspected to verify whether the participants had middle ear disorders. Then, aiming to obtain the sound pressure level of the individual portable audio equipment, measurements were performed with a probe microphone in each ear. The subjects were
positioned at 40 cm from the speaker at 0° azimuth. The
probe microphone was introduced in the external auditory canal, to an approximate depth of insertion of 27 mm from the tragus, which guaranteed the position of the probe
mi-crophone at a distance of 8 mm from the tympanic mem -brane.
The resonance curve of the external ear canal was
as-sessed in each subject irst. With the probe microphone thus
positioned, the sound pressure level curve was traced from a stimulus originating from the individual portable audio equipment of each volunteer. All subjects underwent the following order of data collection: 1) IE in the right ear, 2) IE in the left ear; 3) AIE in the right ear; 4) AIE in the left ear.
The characterization of the stimulus followed the proce -dure described in the study by Santos and Couto.10 To per-form the measurements, a rock and roll-style song was used as stimulus. The song chosen was “I Love Rock and Roll” by ACDC. Furthermore, the equipment volume remained
constant for all measurements, and 70% of the total device
capacity was used.
Regarding the probe microphone measurement, it is noteworthy that the equipment used in this study to perform the measurements provided values of intensity achieved at each frequency instead of a quadratic mean of all values obtained (all tested frequencies), as it is possible to obtain with the use of other equipment available in the market. Therefore, the peak intensity and frequency values obtained in this study were used to perform the statistical correlations.
It is also worth noting that after the irst measurement
in each ear, the earphone was removed with care so as not to dislodge the probe microphone. Thus, the AIE was intro-duced and the distance from the tip of the earphone to the individual’s tragus was measured with the aid of a caliper. Based on this measurement (mm) and the resonance peak obtained at the beginning of the examination, the new
res-onance peak of the ear was measured, as its size was re -duced by the introduction of the AIE. Therefore, the formu-la shown in Fig. 3 was used.
After obtaining the value of the external auditory canal
length, the size of the earphone obtained with the caliper
was subtracted, and the formula was again applied in order to obtain the new resonance frequency.
These data were used in the statistical analysis in or-der to verify whether there was an association between the peak intensity obtained with the probe microphone while listening to the music and the resonance peak of the ear.
The evaluations involved in this study are described in the literature as non-invasive and painless for the patient. Such procedures are controlled by the equipment itself, in accordance with pre-established safety standards, so as not to cause injury to the auditory system.
Data analysis
A quantitative and statistical evaluation of data was per-formed. To compare the the sound pressure level between
two phones, between the ears, and between the two gen-ders, two-way factorial analysis of variance (ANOVA) for
repeated measures was used, followed by the proile test by contrasts to analyze the pressure differences between
the devices and the sides, and Tukey’s test was used for comparison between the genders. The variables were sub-mitted to rank transformation due to the absence of normal distribution.
Spearman’s correlation coeficient was used to assess
the association between numerical variables due to the lack
of normal distribution. The signiicance level for statistical tests was set at 5%, i.e., p < 0.05The results that showed statistically signiicant differences are highlighted in bold.
Results
Initially, the results obtained per frequency in each gender
with each of the earphones used, IE and AIE, were analyzed
(Figs. 4 and 5)
Fig. 6 presents the peak intensity obtained for each ear-phone. Fig. 7 shows resonance peaks obtained without the earphone and the new resonance peak calculated from the measurement of the earphone insertion in the external ear canal.
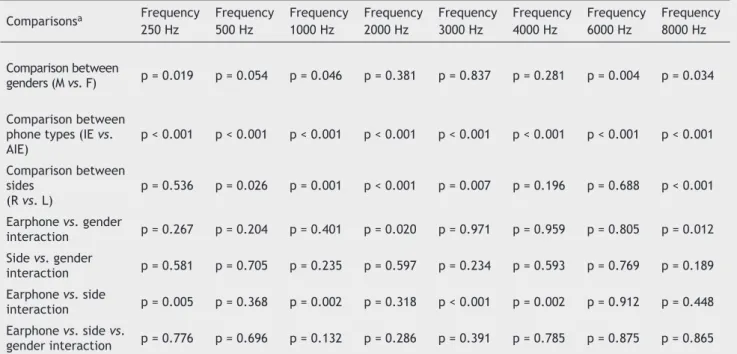
Table 1 shows the ANOVA results for repeated measures to compare the sound pressure level between the two ear-phones, the two ears (right and left), and the two genders. These results are given for each frequency assessed. Table 2 presents the ANOVA results for repeated measures to com-pare the sound pressure level between the two phones, both
Figure 3 f, resonant frequency; vs, sound velocity; l, length of the ear canal
Figure 4 Sound pressure level with the two types of earphones and in both ears in female gender.
250 500 1,000 2,000 3,000 4,000 6,000 8,000
Sound pressure level in the female gender
80
70 60 50 40 30 20 10 0
IE Fem RE IE Fem LE AIE Fem RE AIE Fem LE
Figure 5 Sound pressure level with the two types of ear phones and in both ears in male gender. IE, insertion earphone; AIE, anatomic insertion earphone; RE, right ear; LE, left ear.
Figure 7 Resonance peaks. PR1, resonance peak with an open ear; PR2, resonance peak using IE; RE, right ear; LE, left ear.
Table 1 ANOVA results for repeated measures for comparison (sound pressure level between headphones, sides, and genders) consi-dering the tested frequencies.
Comparisonsa Frequency
250 Hz Frequency 500 Hz Frequency 1000 Hz Frequency 2000 Hz Frequency 3000 Hz Frequency 4000 Hz Frequency 6000 Hz Frequency 8000 Hz Comparison between
genders (M vs. F) p = 0.019 p = 0.054 p = 0.046 p = 0.381 p = 0.837 p = 0.281 p = 0.004 p = 0.034
Comparison between phone types (IE vs. AIE)
p < 0.001 p < 0.001 p < 0.001 p < 0.001 p < 0.001 p < 0.001 p < 0.001 p < 0.001
Comparison between sides
(R vs. L)
p = 0.536 p = 0.026 p = 0.001 p < 0.001 p = 0.007 p = 0.196 p = 0.688 p < 0.001
Earphone vs. gender
interaction p = 0.267 p = 0.204 p = 0.401 p = 0.020 p = 0.971 p = 0.959 p = 0.805 p = 0.012 Side vs. gender
interaction p = 0.581 p = 0.705 p = 0.235 p = 0.597 p = 0.234 p = 0.593 p = 0.769 p = 0.189
Earphone vs. side
interaction p = 0.005 p = 0.368 p = 0.002 p = 0.318 p < 0.001 p = 0.002 p = 0.912 p = 0.448 Earphone vs. side vs.
gender interaction p = 0.776 p = 0.696 p = 0.132 p = 0.286 p = 0.391 p = 0.785 p = 0.875 p = 0.865 IE, insertion earphones; AIE, anatomical insertion earphones; M, male gender; F, female gender; R, right ear; L, left ear.
a Variables submitted to rank transformation due to the absence of normal distribution.
sides, and both genders. These results were compared with the values obtained with the peak frequency (PF), peak in-tensity (PI), and peak resonance obtained (PR1 and PR2).
Table 3 presents the results of the correlation between peak resonance calculated from the measurement of the IE insertion in the external auditory canal and the peak fre-quency at which higher sound pressure level was observed.
Discussion
The use of individual portable sound equipment has become increasingly common among young individuals, who use it with their respective earphones in numerous locations. The use of the earphone allows the individuals to listen to music
PR 1 Fem RE PR 2 Fem RE PR 1 Fem LE PR 2 Fem LE PR1 Male RE PR 2 Male RE PR 1 Male LE PR 2 Male LE
250 H z
500 H z
1,00 0 Hz
2,00 0 Hz
3,00 0 Hz
4,00 0 Hz
6,00 0 Hz
8,00 0 Hz
Sound pressure level in the male gender Resonance peak
70 60 50 40 30 20 10 0
IE Male RE IE Male LE AIE Male RE AIE Male LE
Figure 6 Peak intensity in each earphone. F, female; M, male; RE, right ear; LE, left ear; IP, intensity peak; IE, insertion earphone; AIE, anatomic insertion earphone.
IP Fem RE - IE 62.7 70.36 58.55 71.29 59.53 70.6 57.63 72 IP Male RE - IE IP Fem
LE - IE
IP Male LE - IE IP Fem
RE - AIE
IP Male RE - AIE IP Fem
LE - AIE
IP Male LE - AIE
Intensity peak per earphone
Table 2 ANOVA results for repeated measures for comparison (sound pressure level between headphones, sides, and gen-ders) considering PF, PI, PR1, and PR2.
Comparisonsa PF PI PR1 PR2
Gender
M vs. F p = 0.191 p = 0.401 p = 0.041 p = 0.569 Earphones
(IE ×AIE) p < 0.001 p < 0.001 - -RE vs. LE p = 0.144 p = 0.222 p = 0.364 p = 0.336 Earphone
vs. gender p = 0.253 p = 0.220 -
-Side vs.
gender p = 0.816 p = 0.203 p = 0.043 p = 0.150 Earphone
vs. side p = 0.277 p = 0.023 -
-Earphone vs. side vs. gender
p = 0.631 p = 0.772 -
-PF, peak resonance frequency, PI, peak resonance intensity; PR1, first measurement of peak resonance; PR2, second measurement of peak resonance; M, male; F, female; RE, right ear; LE, left ear; IE, insertion earphones; AIE, anatomical insertion earphones.
a Variables submitted to rank transformation due to the
absence of normal distribution.
Table 3 Correlation between numerical variables.
IE PF RE IE PF LE
PR2 RE p = 0.9049
-PR2 LE - p = 0.3679
without bothering those around them. Within this scenario,
there has been a technological revolution in relation to ear-phones. Previously, the most often used type of earphones were IEs, which were made of a durable material and were
one-size-its-all, regardless of the user.
Recently, AIE phones have appeared in the market; these are made of silicone and the user can change the outer cas-ing of the earphone, allowcas-ing an adjustment to the user’s
ear canal size. Due to these factors, this phone tends to
penetrate more deeply into the external auditory canal,
thus changing its size, and consequently, the resonance fre -quency of the external ear. It is worth noting that both ear-phones alter the resonance; however, the AIE changes the length and position of the ear canal contour, causing major changes to the external ear resonance.
The external ear, in turn, has the physiological function of amplifying the sound. One study14 has demonstrated that
the broadest range of sound ampliication by the outer ear without occlusion in children is on average at 2,937.56 Hz, ranging between 2,180.00 and 4,407.00 Hz. Mean data ob -tained in the present study are higher than those ob-tained by the abovementioned study; however, the values are
within the same range (Figs. 4 and 5). It was observed that
the resonance peaks obtained are, on average, 3,164.2 Hz in the right ear and 3,025.3 Hz in the left ear for the female gender, and 2,632.5 Hz in the right ear and 3,005 Hz in the
left ear for the male gender.
When comparing the sound pressure levels between the
IEs and AIEs, this study demonstrated that there is a
statis-tically signiicant difference (Figs. 4 and 5) for both genders
and both ears. The AIE had higher levels of sound pressure than the IE. This difference was observed for all
frequen-cies, except the frequency of 4,000 Hz and for the peak
intensity observed.14 This fact was expected, since accord-ing to the laws of physics, when comparaccord-ing the same pres-sure in two volumes, the former tends to be greater when the volume is smaller. Thus, the use of AIEs, which decrease the volume of the external ear, increases the sound pressure to a higher level than the observed when using IEs.
In addition to assessing the sound pressure levels, this study also evaluated the frequencies at which the highest levels of sound pressure (Figs. 6 and 7) were observed.
When using IEs, the peak frequency where the highest sound pressure level occurs is around 3,000-3,600 Hz. However,
when performing the same measurement with the AIEs, it was observed that the peak frequency is around 1,300 to
1,700 Hz. It was believed that, due to the smaller volume,
the resonance peak would be more acute, which was not observed in the present study. This fact may be correlated with the frequency range of the phone itself.
Other factors may inluence the results obtained, for in -stance, the frequency band where the earphone operates,
which can inluence the peak sound pressure obtained.
However, it was not possible to obtain such technical data
from the earphone’s manufacturer. When comparing the
peak frequency and intensity of both earphones, a
statisti-cally signiicant difference was observed.
When comparing the sound pressure levels obtained
with the two phones between males and females, there was
a statistically signiicant difference at lower frequencies (250 and 1,000 Hz), demonstrating that males had a higher sound pressure level than females. A statistically signiicant difference in the high frequencies (6 and 8 kHz) was also ob -served, showing that females exhibit higher sound pressure levels than males (Figs. 4 and 5).
This is mainly due to the fact that the female peak res-onance is shifted more towards high frequencies than that found in males, as the length of the external auditory ca-nal of women is shorter, making their resonance peak more acute than that of men.15
This inding regarding the difference of female and male
resonance regarding the open ear was proven by ANOVA (Ta-ble 1) for the results obtained for the resonance frequency variable for each gender. Thus, this test shows that there is a difference in the resonance frequency of the ear canal between genders.
In relation to ears, when comparing the sound pressure levels obtained with different earphones, it was observed
that there was a statistically signiicant difference for some
frequencies (Table 1). In these cases, the left side always showed higher sound pressure levels than the right side. This difference does not occur when the gender variable is added to this association. One might infer that this
would be counterbalanced by the difference in size between genders. Although there is no signiicant anatomical differ -ence between the two sides, studies16,17 evaluating the performance of different ears in some tests have shown that there is a difference between the two, and that the left ear always has worse results than the right ear.
When correlating the frequency at which the peak sound
pressure was obtained and the new resonance frequency, a positive correlation was observed between the two. This fact may be because IEs amplify sound as a whole, rather
than a speciic frequency alone. Another possible explana
-tion for this event is the sample size, i.e., it would be nec
-essary to perform further studies with larger sample sizes
in order to verify whether this correlation remains absent.
Conclusion
There was a statistically signiicant difference between the
earphones evaluated, showing that AIEs have higher sound pressure levels than IEs for all assessed frequencies.
There was no correlation between the frequency at which the highest sound pressure levels were obtained with the AIE and the resonance peak of the closed canal. There
was a statistically signiicant difference between ears for
some tested frequencies.
Conlicts of interest
The authors declare no conlicts of interest.
References
1. Lacerda ABM, Gonçalves CGO, Zocoli AMF, Diaz C, Paula K. Há -bitos auditivos e comportamento de adolescentes diante das
atividades de fazer ruidosas. Rev Cefac, 2011;13:322-9.
2. Castro GGS. Para pensar o consumo da música digital. Revista
FAMECOS. 2005;28:30-6.
3. Bhagat SP, Davis AM. Modiication of otoacoustics emissions
following ear-level exposure to MP3 player music. Int J Audiol.
2008;47:751-60.
4. Borjas ALV, Sousa BFE, Ramos MM, Araujo RPC. O que os jovens
adolescentes sabem sobre perda induzidas pelo excesso de ru
-ído?. R Ci Med Biol. 2002;1:86-98.
5. Farina A, Romagnosi GD. A study of hearing damage caused by personal MP3 players. Paper presented at Audio Enginnering Convention. New York. 2007.
6. Russo ICP, First D, Abut NDB. El uso de stereo personal: el cono-cimento y la conciencia de los adolescents. Fonoaudiologica.
2009;55:22-37.
7. BRASIL. Presidência da Republica. Dispõe sobre a inclusão nos
locais indicados de aviso alertando sobre os malefícios resul-tantes do uso de equipamentos de som em potência superior a
85 (oitenta e cinco) decibéis. Lei 11291 de 26 de abril de 2006. 8. BRASIL. Ministério do Trabalho. Limite de tolerância. Portaria
3214 de 08 de junho de 1978 -NR 15 - anexo 11.
9. Swensson JRP, Swensson RP, Swensson RC. Ipod, mp3 players e a audição. Rev Fac Cienc Med Sorocaba. 2009;11:4-5.
10. Santo I, Couto CM. Emissões otoacústicas e hábitos auditivos de universitários que fazem uso de equipamentos sonoros por -táteis individuais [Monograph]. Campinas: Faculdade de
Ciên-cias Médicas da Universidade Estadual de Campinas: 2009.
11. Couto CM, Carvallo RMM. O efeito das orelhas externa e
média nas emissões otoacústicas. Braz J Otorhinolaryngol. 2009;75:15-23.
12. Fligo B, Meinke, D. Safe listening myths for personal music
players. The ASHA Leader. 2009.
13. PORTNUFF CDF, FLIGOR BJ. Output levels of portable digital
music players.[cited 19 Dec 2011]. Available from: http://
www.hearingconservation.org/docs/virtualpressroom/portnu-ff.html.
14. Anton H, Bivens I, Davis S. Aplicações da integral deinida na geometria, ciências e na engenharia. Cálculo. 2005;1:442-96. 15. Bortholuzzi SMF, Albernaz PLM, Iorio MCM. Ressonância da
orelha externa em crianças. Rev Bras Med Otorrinolaringol.
1995;2:171-8.
16. Kahari K, Zachau G, Eklof M, Sandfo L, Moller C. Assessment os hearing and hearing discords in rock/jazz musicians. Int J Audiol. 2003;42:279-88.
17. Harger MRHC, Barbosa-Branco A. Efeitos auditivos decorrentes da exposição ocupacional ao ruído em trabalhadores de