www.bjorl.org
Brazilian
Journal
of
OTORHINOLARYNGOLOGY
ORIGINAL
ARTICLE
Power
reflectance
testing
in
newborns
and
infants
夽
,
夽夽
Ticianna
Garambone
de
Cerqueira
Lima
a,∗,
Helena
Maria
Gonc
¸alves
Becker
b,
Celso
Gonc
¸alves
Becker
b,
Daniele
Barreto
da
Cunha
Ferreira
c,
Camilo
Brandão
de
Resende
b,d,
Roberto
Eustáquio
Santos
Guimarães
b,eaUniversidadeFederaldeMinasGerais(UFMG),BeloHorizonte,MG,Brazil
bMedicineSchool,UniversidadeFederaldeMinasGerais(UFMG),BeloHorizonte,MG,Brazil
cNewbornHearingScreeningTeam,HospitaldasClínicas,UniversidadeFederaldeMinasGerais(UFMG),BeloHorizonte,MG,
Brazil
dGraduatePrograminAeronauticalEngineeringandMechanics,InstitutoTecnológicodeAeronáutica(ITA),SãoJosédosCampos,
SP,Brazil
eUniversidadedeSãoPaulo(USP),RibeirãoPreto,SP,Brazil
Received30April2014;accepted2November2014 Availableonline7September2015
KEYWORDS
Hearingtests; Middleear; Neonatalscreening
Abstract
Introduction:Auditoryscreeninginnewbornsallowsfordetectionofhearingproblemsearlyin life.However,middleeardiseasescanmakethediagnosismoredifficult.
Objective:Toevaluatethepowerreflectancetestasanindicatorofthemiddleeardiseaseand tocompareittotympanometry.
Methods:Casestudyevaluating105newbornsandinfantswhoparticipatedintheaudiology screeningin2013.Thefollowingexamswereperformed:transientotoacousticemissions,power reflectance,andtympanometry.
Results:Intheoptoacousticemissionevaluation,approximately95%ofthesubjectspassedthe test.Thespecificityofpowerreflectanceinallfrequenciesstudiedrangedfrom75.3%to95.9%, andthatoftympanometryat1000Hzrangedfrom83%to87.2%;therewasagreementamong theseexams.
Conclusion:Theoutcomeofpowerreflectancetestsat2000Hzand3000Hzshoweda corre-lationwith tympanometryandotoacoustic emissions,andthesewere themostappropriate frequenciestodeterminemiddleeardiseasethroughpowerreflectancemeasurement.Itwas alsoobservedthatvaluesofpowerreflectanceabovereferencelevelssuggestedthepresence offluidinthemiddleear,andthusaconductivehearingloss.
© 2015Associac¸ãoBrasileira de Otorrinolaringologiae CirurgiaCérvico-Facial. Publishedby ElsevierEditoraLtda.Allrightsreserved.
夽
Pleasecitethisarticleas:LimaTGC,BeckerHMG,BeckerCG,FerreiraDBC,deResendeCB,GuimarãesRES.Powerreflectancetesting innewbornsandinfants.BrazJOtorhinolaryngol.2015;81:610---5.
夽夽Institution:MedicineSchool,UniversidadeFederaldeMinasGerais(UFMG),BeloHorizonte,MG,Brazil.
∗Correspondingauthor.
E-mail:[email protected](T.G.C.Lima). http://dx.doi.org/10.1016/j.bjorl.2015.08.008
PALAVRAS-CHAVE
Testesauditivos; Orelhamédia; Triagemneonatal
Oestudodareflectânciadepotênciaemneonatoselactentes
Resumo
Introduc¸ão: Atriagemauditivaneonatalnospermiteidentificarprecocementealterac¸ões audi-tivas.Entretanto,doenc¸asdaorelhamédiapodemdificultarodiagnóstico.
Objetivo: Avaliaroexamedereflectânciadepotênciacomoumindicadordedoenc¸adeorelha médiaecompará-locomatimpanometria.
Método: Estudodecasosemqueforamavaliados105neonatoselactentesquefizeramparte datriagem auditivaem 2013. Foramrealizadososseguintes exames:emissões otoacústicas transientes,reflectânciadepotênciaetimpanometria.
Resultados: Naavaliac¸ãodasemissõesotoacústicas,cercade95%passaram.Aespecificidade dareflectânciadepotênciaemtodasasfrequênciaspesquisadasvarioude75,3%até95,9%eda timpanometriaem1.000Hzvarioude83%até87,2%ehouveconcordânciaentreessesexames. Conclusão:Oresultadodoexamedereflectâncianasfrequênciasde2.000Hze3.000Hz apre-sentou correlac¸ão com os resultados da timpanometria e com as emissões otoacústicas, e foramestasasfrequênciasmaisadequadasparaadeterminac¸ãodedoenc¸adeorelhamédia pelareflectânciadepotência.Observou-sequevaloresdareflectânciadepotênciaacimados padrõessugerempresenc¸adelíquidoemorelhamédia,portantoumaalterac¸ãocondutiva. ©2015Associac¸ãoBrasileiradeOtorrinolaringologiaeCirurgiaCérvico-Facial.Publicado por ElsevierEditoraLtda.Todososdireitosreservados.
Introduction
Deafness affects oneto threeper 1000 children at birth, accordingtotheJointCommitteeonInfantHearing.1Ofall
birthdefects,deafness isthemostcommon.Early diagno-sisof hearingloss anditstypeallowsappropriate careof children with disabilities. Transient otoacoustic emissions (TOAE) are used in obtaining diagnosis. When performing otoacoustic emissions, cochlear function is assessed.2 For
theseemissionstoreachthecochlea,theymustpassthrough theexternalandmiddleear.Ifthereisanydisease affect-ingtheircourse,theemissionswillnotproducearesponse, andthecochleawillnotbeevaluatedproperly.3Therefore,
othertestsareusedtoassistintheassessmentoftheorigin ofhearingimpairment.Tympanometryisthegoldstandard forevaluationofthemiddleear;thistestrevealstympanic membrane-auditory ossicle mobility.4 Tympanometry with
the use of high frequency (1000Hz) is recommended for diagnostictestingofchildrenunder4months,accordingto JointCommitteeonInfantHearing,1becausethistechnique
is moresensitive tomiddle eardysfunctions comparedto 226Hztympanometry.5---7
Wideband reflectance (WBR) is a new technique for assessing middle ear that has been studied in the last decade. WBR represents the acoustic energy incident on tympanicmembrane(TM);itisreflectedandreturnstothe externalauditorycanal,thusallowinganevaluationofthe middle ear as a whole.8 WBR includes a set of measures
thatcanbeusedtorepresenttheacousticbehaviorofthe ear,e.g.,power reflectance(PR), absorption,impedance, transmittance,admittance,soundpressurelevel,andsound intensity.Inthisstudy,PRwasevaluatedatfrequenciesof 1000;2000;3000,and4000Hz,sincethepowerreflectance measuredatanypointintheauditorymeatusisequaltoPR inthetympanicmembrane.9,10
Theoverall aimofthisstudy wastoanalyzethe corre-lationofPRwithtympanometryinthedetectionofmiddle earchangeinnewbornspresentingTOAE.
Methods
Thiswasanobservationalcross-sectionalstudythat evalu-atedTOAE,PR,andtympanometrytests.
Thesampleconsistedof105infantsundertheageof40 days,ofbothgenders(58femaleand47male),allattendees oftheNeonatalHearingScreeningProgram(NHSP)fromJuly toSeptember2013.Allat-termnewbornswithnoriskfactor forhearinglossaccordingtotheJointCommitteeonInfant Hearing,1referredbyNHSPforthefirsttest,andwhose
par-entsor guardiansconsented totheinclusion ofdata from theirexams in the study and signed an informedconsent wereincludedinthestudy.Newbornswhoseanamnesis pro-tocolandresultsdidnotcontainallinformationnecessary toconducttheresearchwereexcluded.Thesamplesize cal-culationwasconductedthroughpopulationaverage,which determinestheminimumsizeofasampletoestimatea sta-tisticalparameter,11basedonasamplingerrorof5%,witha
significancelevelof5%andstandarddeviation,and consid-eringameanof7%ofabnormaltests.
ThisstudywasapprovedbytheResearchEthics Commit-tee,CAAENo.0673.0.203.000-11.
Hearing screening was conducted in the Audiology Departmentandconsisted ofanamnesis, behavioraltests, andTOAE. Neonateswere referred to the Otolaryngology Departmentfor performance of PR andtympanometry by theinvestigator.Thebabieswereinnaturalsleepduringthe tests.The firsteartobeevaluatedwaschosen depending onthepositionofthechildinthemother’slap.
device(Otodynamics ).Theemissionregistrationprotocol adoptedusednon-linearclickstimuliatanintensityof80dB SPLwithatestingwindowof12ms,with512stimuli.TOAE wereconsideredpresentwhenreproducibility≥70%andS/N
(signal/noise)ratio≥6dB.
PR wasperformed using a middle ear acoustic energy analyzer (Middle Ear Power Analyzer [MEPA], version 3.3 --- Mimosa AcousticsTM) with hardware incorporated into
the DPOAE Measurement System (StarkeyTM) at
frequen-cies of 1000Hz, 2000Hz, 3000Hz, and 4000Hz, with chirpstimulation12andarubber-typeprobe(MimosaStudy
standard).13
Chirp stimulus is the bestfor most patients, as it has betterresolutionoffrequency,isfaster,andworksbestina quietenvironment.Thestimuluspressurelevelwas0---80dB SPLandthemeasurementtimewas10s.12
Powerreflectancecalculationdependsontheearcanal area.Huangetal.14showedthatWBRmeasurementsrequire
that Thevenin15 equivalents of the acousticmeasurement
systemaredeterminedwithloadsmeasuringbetween10% and15%oftheactualdiameteroftheearcanal.TheMimosa AcousticsSystem13 calculatesthe earcanal areabasedon
theprobetipdiameter;thissystemusestheThevenin cal-ibrationparameter.15Withthissystem,theareaoftheear
canal is estimated asbeing 4.5mm (rubber tip cavity) or 7.5mm(foamtipcavity);thisstudyusedtherubbertip.The diameterof theearcanalofneonates wasmeasured with 4.4mmdiameters16,17;thus,calibrationsusingthe‘‘rubber
tipcavity’’Mimosamethod(usedinthisstudy)were appro-priate.
The following patterns were usedto determine which earspassedthePRtest:
At1000Hz:0.2---0.75,or20---75% At2000Hz:0.1---0.50,or10---50% At3000Hz:0---0.50,or0---50% At4000Hz:0---0.70,or0---70%
Tympanometry at 1000Hz was obtained using an ImpedanceAudiometer AT235(InteracousticsTM)devicein
thepressure recording protocol; it allowed a variationof +300PAto−300PA,andthetypeApatternwasadoptedas
normal,withalterationsinthecurvesC,B,andPD.18,19
This study used ExcelTM for preparation of a database
withinformationfromrightandleftearsofthe105patients includedintheproject.A‘‘Passed’’(P)testoccurredwhen
the babypresentedotoacoustic emissionsin allevaluated frequencies.PRwasevaluatedatfrequenciesof1000,2000, 3000,and4000Hz,andtheresultofeachfrequencywas ana-lyzedseparately.AnalyseswereperformedwithRsoftware version2.7.1,andwithEpiInfosoftwareversion6.04,both ofwhicharepublicdomain.A5%significancelevelwasset. Consideringthatinthisstudymorethantwotestswere evaluated,itwasnecessarytousemultiplecoefficientfor
estimating thedegree ofcorrelation betweentests.20 The
classificationsofcalculatedcoefficients21wereasfollows:
low(<0.20);reasonable(0.21---0.40);moderate(0.41---0.60); good (0.61---0.80), and verygood (0.80---1.00). For tympa-nometryandPRtests,specificitywascalculatedconsidering theTOAEtestasthegoldstandard.Specificitywas consid-eredastherateofpatientswhopassedthetestofinterest andwhoalsopassedTOAE.
Results
IntheoverallassessmentofTOAE,thatis,thoseinfantswho passedthethreefrequenciesevaluated, itwasfound that ontherightside,97(92.4%)passedthetestandeight(7.6%) failed;andontheleftside,96(91.4%)passedthetestand nine(8.6%)failed.
Itwasfoundthat,inthetympanometryfortherightside, 86(85.1%)infantshadanormalcurve,15(14.9%)exhibited alterationsinthecurve,andtherewasnoinformationfor four children.On the leftside, 81 (79.4%)children had a normalcurve,21(20.6%)exhibitedalterationsinthecurve, andtherewasnoinformationforthreechildren.Cases with-outinformationwerethosewithnocurveformation,orfor whichtherewasnobilateralseal.
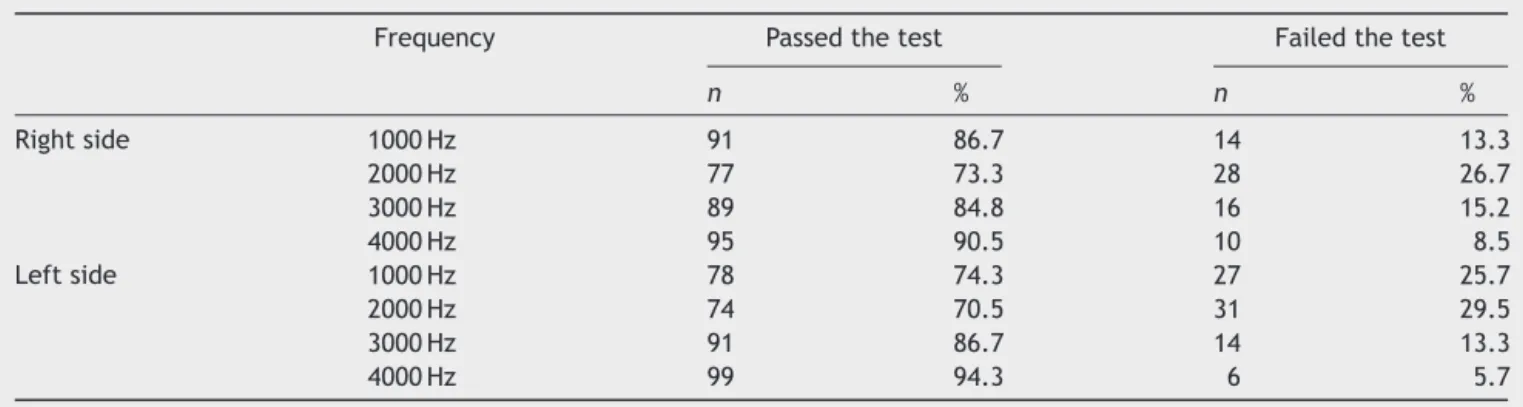
Table1showsthedescriptionofPRtestforrightandleft sidesofthe105infantsevaluated.
Agreementbetweentests
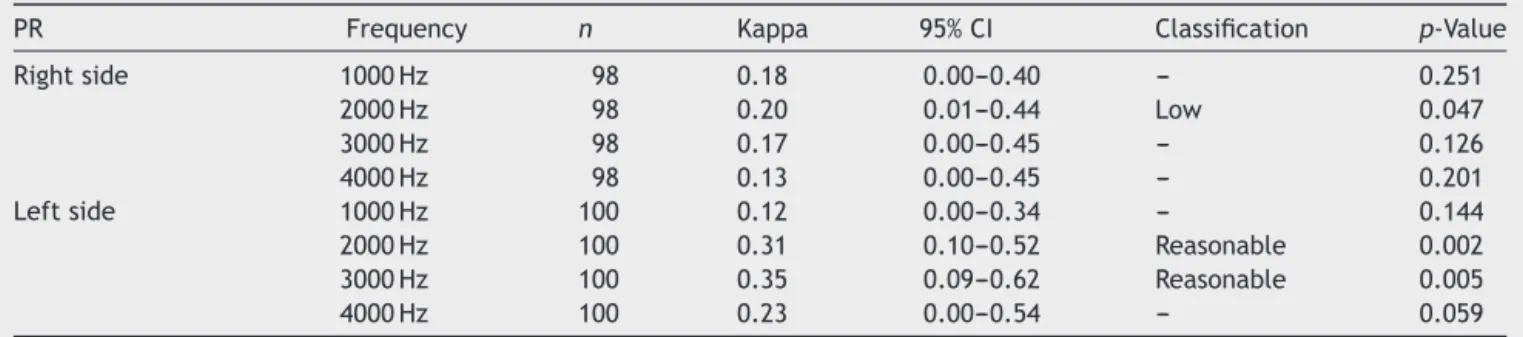
Table 2 presents Kappa coefficients and respective confi-denceintervalsamongstthethreetestsassessedtogether. Therewasalowagreement(p≤0.05)amongtheresultsof
tympanometry,TOAE,andPRatafrequencyof2000Hzon theright side. Withrespecttothe leftside,areasonable agreement (p≤0.05) wasseen amongthe results of
tym-panometry, TOAE, and PR (at 2000 and 3000Hz). Table 3
showsthecoefficientandtheconfidenceintervalbetween
Table1 Descriptionofpowerreflectance(PR)testin105newbornsevaluated.
Frequency Passedthetest Failedthetest
n % n %
Rightside 1000Hz 91 86.7 14 13.3
2000Hz 77 73.3 28 26.7
3000Hz 89 84.8 16 15.2
4000Hz 95 90.5 10 8.5
Leftside 1000Hz 78 74.3 27 25.7
2000Hz 74 70.5 31 29.5
3000Hz 91 86.7 14 13.3
Table2 KappacoefficientforagreementamongstTOAE,tympanometry,andPRtestsin105newbornsevaluated.
PR Frequency n Kappa 95%CI Classification p-Value
Rightside 1000Hz 98 0.18 0.00---0.40 --- 0.251
2000Hz 98 0.20 0.01---0.44 Low 0.047
3000Hz 98 0.17 0.00---0.45 --- 0.126
4000Hz 98 0.13 0.00---0.45 --- 0.201
Leftside 1000Hz 100 0.12 0.00---0.34 --- 0.144
2000Hz 100 0.31 0.10---0.52 Reasonable 0.002 3000Hz 100 0.35 0.09---0.62 Reasonable 0.005
4000Hz 100 0.23 0.00---0.54 --- 0.059
n,Caseswithinformationonallthreetests;95%CI,95%confidenceinterval;---,non-significantagreement.
Table3 AgreementbetweentympanometryandPRexamsin105newbornsevaluated.
Tests PR(1000Hz) PR(2000Hz) PR(3000Hz) PR(4000Hz)
Rightside
Tympanometry 0.01 0.29 0.22 0.16
Confidenceinterval (0---0.15) (0.12---0.47) (0.02---0.42) (0---0.36)
Leftside
Tympanometry 0.04 0.32 0.37 0.17
Confidenceinterval (0---0.20) (0.15---0.49) (0.18---0.56) (0---0.35)
testresults(takentwobytwo)for tympanometryandPR. Forboth sides, there wasreasonable agreementbetween tympanometryandPRat2000and3000Hz.
Tympanometryspecificity
Table4 presentsthe specific measuresfor tympanometry. Interpretingtheexaminationofthecurvefortherightside, aspecificityof87.2%(78.4---92.9)wasfound.Thisindicates that 87.2%of thosepatients thatpassed TOAE hada nor-mal result for the curve. Interpreting the examination of thecurvefortheleftside,aspecificityof83%(73.5---89.7) wasfound. This indicates that 83% of thosepatients who havepassedTOAEhadanormalresultofthecurve.
Powerreflectancespecificity
Table 5 presents the specific measures for PR test in the evaluatedfrequencies.
Discussion
The importance of the NHSP is unquestionable, demon-strating that for every 1000 children examined, two to three(0.2---0.3%)willpresent innereardisease,according totheJointCommitteeonInfantHearing1;and,according
Table 4 Tympanometry specificity in 105 newborns evaluated.
Side Specificity
Right 87.2%(78.4---92.9)
Left 83.0%(73.5---89.7)
toYang,22100children(10%)willpresentconductivehearing
losscausedbymiddleeardysfunction.
Keefe23,24recommendedamiddleearstudyinassociation
with the newborn hearing screening using tympanometry and/orpowerreflectance,consideringthathearing screen-inginterpretationwouldbemoreappropriate.
DescriptiveanalysisofTOAE,PR,and tympanometryresults
IntheoverallassessmentofTOAEin105children(210ears), 92.4%passedintherightearand91.4%intheleftear;these resultsweresimilartothosedescribedbyThompson.25
Tympanometryreveals the middle earcondition and is themost widely usedtest for this evaluation. Incases of conductiveloss,alteredtympanometrycanbeseen.Inthis study,usingthetympanometrytest,changeswereobserved in 14.9% of the neonates on the right side in and 20.6% onthe left side; these are higher percentages compared
Table5 PRtestspecificityinevaluatedfrequenciesin105 newbornsevaluated.
Side Frequency Specificity
tothosepublishedbyYang. Itmaybethatthesefindings werefoundbecausethepresentstudyanalyzedonlythe fre-quencyof1000Hzwhich,accordingtotheJointCommittee onInfantHearing1andtheUnitedKingdomNewbornHearing
ScreeningProgram,26 is therecommendedtone forinfants
agedunder6months.However,inthestudybyYang,22
fre-quenciesof226and1000Hzwereanalyzed.Nonetheless,it hasbeenobservedthattympanometryresultsobtainedwith alow-frequencyprobetone (226Hz)canbeconsidered as normal,eveninthepresencemiddleearchanges.27,28
PRmeasurestheenergytransferredpassivelytothe mid-dleearandrevealsthestateoftheexternalauditorycanal andtheTM. The resultsobtained fromtheevaluated fre-quenciesshowedthat,at1000Hz,13.3%ofneonatesfailed ontherightsideand25.7%failedontheleftside;at2000Hz, 26.7%failedontheright sideand29.5%failedontheleft side;at 3000Hz, 15.2% failedontheright side and13.3% failedontheleftside;andfinallyat4000Hz,8.5%failedon therightsideand5.7%failedontheleftside.Theseresults showthatthefrequenciesof2000Hzand3000Hzwerebest suitedforthedeterminationofmiddleeardisease,agreeing withthefindingsofRoswski29andVoss,30whoreportedthat
whenthevalueofPRiscloseto1,at2000and3000Hznearly allincidentenergyinthesefrequenciesisreflectedbyTM, withlittleenergyabsorptionbymiddleandinnerears.The maximumenergytransmitted tothe structuresbehindTM occurswhenPRhasitsvaluesbetween0.3and0.4at1000 and4000Hz,whichagreeswiththeresultsofthisstudy.
Keefe16examinedPRmeasurementfrom125to10,700Hz
in adults and in term neonates aged 1---24 months, and hypothesizedthatthefrequenciesof2000---4000Hzmaybe usefulin clinical testsfor middle earevaluation, because these frequencies better absorb the sound energy that returnstotheauditorycanal.Thisfindingwasalsoreported byPiskorskietal.31;theseauthorsstatedthatsuch
frequen-ciescanpredictthepresenceofconductivehearinglossin childrenaged2---11years.
TympanometryandPRspecificities
Using the results of newborns that passed TOAE as the goldstandardinhearingassessment,tympanometryandPR specificitieswerecalculated.ThespecificityofPRatall fre-quenciesstudied ranged from 75.3%to 95.9%. This shows that5---25%of newbornshave changesdetected byPRnot detectedbyTOAE.The specificityoftympanometryshows that13---17%ofnewbornshadchangeswithTOAEpresent.
Thesevaluesareclosetothe10%ofconductivechange prevalenceinneonatesdescribedbyYang.22Onecould
ques-tionwhetherPRandtympanometrytestswouldbeableto detectsubclinicalalterationsinthemiddleearthatdonot causeinterferencewithTOAEcapture.
AsdescribedbyHunter,13WBRwassignificantlydifferent
inearsthatfailedvs.earsthatpassedthedistortion-product otoacousticemissions (DPOAE)testing, showingsignificant resultstopredictDPOAEstatus.
Evidenceof a middle eardisorder asamajor causeof earsthatfailDPOAEtestsisascribedtothepassiveenergy transferthatoccursinthemiddleear,asmeasuredbyWBR, whichwhenalteredisrelatedtomiddleeardisease,andnot tocochlearfunction.
Inaddition,inchildrenretestedwithindays,intheface ofWBRimprovement,thepercentageofsuccess(i.e., chil-drenwhopassedthetest)alsoimproved,showingastrong relationshipbetweenchangesofstatusinDPOAEandWBR. NoscientificstudyhasyetbeenpublishedwithTOAEandRBL or PR aspredictive value; however, considering thatboth DPOAEandTOAEareacceptedasscreeningtests,thisstudy wascomparedtotheaforementioned study,and obtained similarresults.
Inthisstudy,itwasobservedthatPRvaluesabove pre-determinedequipmentreferencelevelsintheMimosa-type study13 suggestthepresenceoffluidinthemiddleear.
TheseresultsareinagreementwiththoseofRoswski29;
thatauthorreportedthatwhenthevalueofPRiscloseto1 atfrequenciesof2000and3000Hz,almostallenergy inci-dentinthesefrequenciesisreflectedbytheTM,resultingin littleabsorptionofenergythroughmiddleandinnerear.The frequenciesconsideredmostsuitableformiddleeardisease detectionwere2000and3000Hz,becausethesefrequencies showreasonableagreementwithtympanometryat1000Hz (themostoftenusedtestformiddleeardiseasedetection) andalsoforpresentingthehighernumberofearsthatfailed PR. Similarlytothepresent results,Feeney andSanford32
andotherinvestigatorsfoundhigherchangesforPRvalueat 2000Hz.
The maximum energy transmitted to the structures behindTMoccuredwhenPRvalueswerebetween0.3and 0.4 at the frequencies of 1000 and 4000Hz,29 which are
similartotheresultsfoundinthisstudy.
Inthepresentstudy,itwasnotedthatPR valuesabove thereferencelevelssuggestpresenceoffluidinthemiddle ear, and therefore a conductive alteration,a finding first describedbyVoss.30
Conclusion
PRat2000and3000HzcorrelatedwiththeresultsofTOAE andtympanometrytests.Frequenciesof2000and3000Hz were the most suitable for middle ear disease detection using PR. It was also noted that the findingof PR values abovethereferencelevelssuggestpresenceoffluidinthe middle ear, andthus, a conductivealteration. The speci-ficityofPRatallfrequenciesstudiedrangedfrom75.3%to 95.9%,andoftympanometryat1000Hz,rangedfrom83%to 87.2%.
Thisstudypointedouttheneedforfurtherstudyofthe PR test,inordertovalidatePR asan appropriatetoolfor middleearassessment.
Conflicts
of
interest
Theauthorsdeclarenoconflictsofinterest.
References
1.American Academy ofPediatrics, JointCommittee on Infant Hearing.Year2007position statement: Principlesand guide-linesfor early hearingdetection and interventionprograms. Pediatrics.2007;120:898---921.
3.Hall JW, Smith SD, PopelkaGR. Newborn hearing screening withcombined otoacousticemissionsandauditorybrainstem responses.JAAA.2004;15:414---25.
4.LidenG,HarfordE,HallenO.Automatictympanometryin clin-icalpractice.Audiology.1974;13:126---39.
5.Margolis RH, Bass-Ringdahl S, Hanks WD, Holte L, Zapala DA.Tympanometryin newborninfants--- 1kHznorms.JAAA. 2003;14:383---92.
6.BaldwinM. Choice of probetone and classification oftrace patterns in timpanometry undertaken in early infancy. IJA. 2006;45:417---27.
7.Calandruccio L, Fitzgerald TS, Prieve BA. Normative mul-tifrequency tympanometry in infants and toddlers. JAAA. 2006;17:470---80.
8.Keefe DH, Ling R, Bulen JC. Method to measure acoustic-impedanceandreflectioncoefficient.JAMA.1992;91:470---85. 9.HunterLL, Tubaugh L, Jackson A, Propes S. Wideband
mid-dle ear power measurement in infants and children. JAAA. 2008;19:309---24.
10.MerchantGR,HortonNJ,Voss SE.Normativereflectanceand transmittancemeasurementsonhealthynewbornand 1-month-oldinfants.EarHear.2010;31:746---54.
11.TriolaMF.In:TriolaMF,editor.Introduc¸ãoàEstatística.7ed. RiodeJaneiro:LTC;1999.p.1---410.
12.HearID5.1+MEPA3ModuleUser’sManual.StimulusSelection; 2012.
13.HunterLL,FeeneyMP,LapsleyM,JudiA.Widebandreflectance innewborns: normative regions and relationship to hearing-screeningresults.EarHear.2010;31:599---610.
14.HuangLH. Comparison ofsensitivity of audiological teststo identifyotitismediawitheffusioninnewborninfants.Zhonghua ErBiYanHouTouJingKeZaZhi.2008;43:886---90.
15.VanValkenburgME.In:VanValkenburgMF,editor.Perspectives inBiologyandMedicine.2nded.EnglewoodCliffs,NJ: Prentice-Hall;1964.p.1---492.
16.Keefe DH.Ear-canal impedance and reflection coefficient in humaninfantsandadults.JASA.1993;94:2617---38.
17.Qi L. A nonlinear finite-element model of the newborn ear canal.ASA.2006;120:3789---98.
18.JergerJ.Diagnosticuseofimpedancemeasures.In:JergerJ, editor.HandbookofClinicalImpedanceAudiometry.Acton,MA: AmericanElectromedicsCorporation;1975.p.128---40.
19.MargolisRH,Smith P.Tympanometryininfants: stateofart. In:HarfordE,KleinJ,editors.Impedancescreeningofmiddle eardiseaseinchildren.NewYork:GruneandStratton;1978.p. 41---56.
20.SiegelS,CastellanNJ.Nonparametricstatisticsforbehavioral sciences.2nded.NewYork:Mc-GrawHillBookCompany;1988. 21.LandisJR,KochGG.Themeasurementofobserveragreement
forcategoricaldata.Biometrics.1977;33:159---74.
22.YangEY,StuartA,MencherGT.Auditorybrainstemresponses toair-andboneconductedclicksintheaudiologicalassessment ofat-riskinfants.EarHear.1993;14:175---82.
23.KeefeDH.Identificationofneonatalhearingimpairment: ear-canalmeasurementsofacousticadmittanceandreflectancein neonates.EarHear.2000;21:443---61.
24.Keefe DH. Ear-meato acoustic admittance and reflectance effects in human neonates. I. Predictions of otoacous-tic emission and auditory brainstem responses. JASA. 2003;113:389---406.
25.Thompson DC, McPhillips H, Davis RL. Universal newborn hearing screening: summary of evidence. JAMA. 2001;286: 000---10.
26.BaldwinM,editor.Neonatalhearingscreeningandassessment. Timpanometryinbabiesunder6months.ARecommendedTest Protocol.2008.
27.ParadiseJL,SmithCG,BluestoneCD.Tympanometricdetection ofmiddleeareffusionininfantsandyoungchildren.Pediatrics. 1976;58:198---210.
28.HunterLL,MargolisRH.Multifrequencytympanometry:current clinicalapplication.JAAA.1992;1:33---43.
29.Rosowski. An overview of wideband immitance measure-mentstechniquesandterminology:yousayabsorbance,Isay reflectance.EarHear.2013;34:9---16.
30.VossSE,MerchantGR,HortonNJ.Effectsofmiddle-ear disor-dersonpowerreflectancemeasuredincadavericearcanals. EarHear.2012;33:195---208.
31.Piskorski P, Keefe DH, Simmons JL. Prediction of conduc-tivehearing lossbasedon acousticear-canal response using a multivariate clinical decision theory. J Acoust Soc Am. 1999;105:749---64.