ABSTRACT
Evaluating resin-enamel bonds by microshear
and microtensile bond strength tests: effects of
composite resin
1 2, Alessandra REIS3, Alessandro Dourado LOGUERCIO3,
Eugenio Jose GARCIA4 5
1- DDS, PhD student, Dental School, Department of Dental Materials, University of São Paulo, São Paulo, SP, Brazil. 2- DDS, PhD, Professor, Dental School, Department of Dentistry, University of North of Paraná, Londrina, PR, Brazil.
3- DDS, PhD Adjunctive Professor, Dental School, Department of Restorative Dentistry, State University of Ponta Grossa, Ponta Grossa, PR, Brazil. 4- DDS, MS, PhD student, Dental School, Department of Dental Materials, University of São Paulo, São Paulo, SP, Brazil.
5- DDS, PhD Associate Professor, Dental School, Department of Dental Materials, University of São Paulo, São Paulo, SP, Brazil.
Corresponding address: Rosa Helena Miranda Grande - Faculdade de Odontologia - Universidade de São Paulo - Departamento de Materiais Dentários - Av. Lineu Prestes, 2227 - Butantã - 05508-000 - São Paulo - SP - Brasil - e-mail: [email protected] - Phone/fax: +55-11-30917840
!!" #$%&'!!"($)*&'!!
Objectives: The aims of this study were to evaluate the effect of resin composite (Filtek Z250 and Filtek Flow Z350) and adhesive system [(Solobond Plus, Futurabond NR (VOCO) and Adper Single Bond (3M ESPE)] on the microtensile (PTBS) and microshear bond strength (PSBS) tests on enamel, and to correlate the bond strength means between them. Material and Methods: Thirty-six extracted human molars were sectioned to obtain two tooth halves: one for PTBS and
the other one for PSBS. Adhesive systems and resin composites were applied to the enamel
ground surfaces and light-cured. After storage (370C/24 h) specimens were stressed (0.5 mm/ min). Fracture modes were analyzed under scanning electron microscopy. The data were analyzed
using two-way ANOVA and Tukey’s test (D
estimated with Pearson’s product-moment correlation statistics (D
!" # # $ !%&#!& ' * # # $ +# positive and linearly correlated and can therefore lead to similar conclusions.
Key words: Enamel. Adhesives. Resins.
INTRODUCTION
Various conventional mechanical test methods, 1 1 # * 6 1 $ been used to assess dental adhesion. Tensile and shear tests are the most commonly used1. However, problems related to the validity of the measurements obtained began to arise as cohesive failures in the substrate were frequently observed with new adhesives that yielded improved bond strengths. According to some researchers30, the explanation for this fact was that stresses were mostly concentrated in the substrate, thus causing it to fail prematurely, before failure at the interface itself. Another point that has drawn fundamental criticism concerns the non-uniform nature of stress distributions along tested interfaces7.
To improve stress distribution and the range of
bond strength values, shear and tensile tests were almost completely replaced by the microtensile bond strength (PTBS) test, introduced by Sano, et al.21 (1994). The main characteristic of this test is the reduced specimen size, which provides a higher bond strength mean22. More recently, some authors25,26 have advocated a new test method using specimens with reduced dimensions, as a substitute for the conventional shear test: the so-called “microshear” bond strength (PSBS) test.
for sectioning procedures to obtain specimens, as these laboratory procedures themselves may induce early micro-cracking within the specimen8,20,25-27. Whether or not this has any effect on the overall conclusions reached, these methods deserve further investigations, since few studies have compared them12,16.
The data from bond strength studies may depend largely on experimental factors such as the type of composite, stress rate, sample size and geometry, and the actual test method16,18,29. With regard to
1 * 10,17,23
instead of microhybrid composites6,10
tube in PSBS testing due to their easy placement. However, to the best of our knowledge no study has so far addressed the effects of this variation in method on the number of cohesive failures and bond strength values. Therefore, the objective of the present investigation was two-fold: 1) to evaluate the effect of the type of resin composite and adhesive system on the bond strength values obtained both in PSBS r and PTBS tests; and 2) to correlate the bond strength means gathered from these mechanical tests to verify whether they are able to reach similar conclusions.
MATERIAL AND METHODS
Thirty-six extracted, caries-free human molars were used in this study. The teeth were collected after obtaining the patients’ informed consent. The Research Ethics Committee of the University of São Paulo reviewed and approved this study under Protocol Number 193/06. Teeth were disinfected24, cleaned by removing all debris and calculus, and stored in distilled water for 48 h. The teeth were decoronated and the crowns were sectioned transversally in a buccolingual direction, using a diamond disc at slow speed (Isomet, Buehler, Lake Bluff, IL, USA) in order to obtain two tooth halves. One half was used for the PTBS test and the other half was used for the PSBS test. The enamel surfaces were ground on wet # 180 and 600 Si-C papers (60 s).
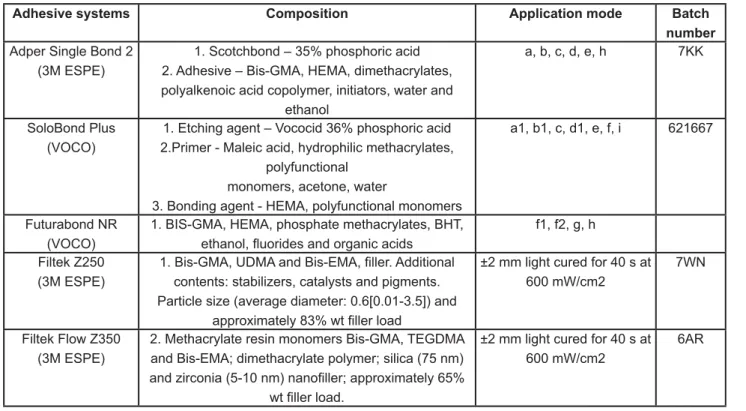
A three-step etch-and-rinse system Solobond Plus (VOCO, Cuxhaven, LS, DEU), a two-step etch-and-rinse system Adper Single Bond 2 (3M ESPE, St. Paul, MN, USA) and a one-step self-etch adhesive Futurabond NR (VOCO, Cuxhaven, LS, DEU) were used in the present investigation together with the microhybrid composite Filtek Z250 (3M ESPE) and * ?@G!GJKQXK The composition, application mode and batch number of each material are shown in Figure 1.
Microtensile bond strength test
Thirty-six tooth halves were randomly divided into six groups of equal size according to the
combination of the main factors Adhesive and Composite. After conditioning procedures, adhesives were applied and light polymerized using a quartz-tungsten halogen Optilux 501 unit (Kerr Corp., Orange, CA, USA) set at 600 mW/cm2. Resin composite build-ups were constructed in two 20 mm-thick increments, which were individually light polymerized for 40 s. All bonding procedures were carried out by a single operator at a room temperature of 24°C. For placement of Filtek Flow Z350, an individual matrix was placed around the enamel slices.
After storage in distilled water (37°C/24 h), the specimens were sectioned longitudinally perpendicular to the adhesive interface by means of a diamond saw in an ISOMET machine, producing 0.9-mm-thick rectangular slabs. Next, each slab was visually analyzed to select the areas with * # #$# sticks with cross sectional areas of about 0.8 mm. The cross-sectional area of each specimen was measured with a digital caliper (Absolute Digimatic, Mitutoyo, Tokyo, TYO, JPN) to the nearest 0.01 mm and recorded for measuring the bond strength. Cyanoacrylate adhesive (Super Bonder Gel, Loctite, ` ? {#1Q|X1QX1+} #6 specimens to a microtensile testing device used in a universal testing machine (Instron model 5565, Canton, MA, USA) at 0.5 mm/min. The number of prematurely debonded sticks per tooth was recorded.
Microshear bond strength test
The other 36 tooth halves were randomly divided into six groups of equal size according to the combination of the main factors Adhesive and Composite. After enamel conditioning, the adhesives were applied and light polymerized using the Optilux 501 unit, set at 600 mW/cm2.
A plastic tube 54-HL (TYGON® Medical Tubing, Saint Gobain, Akron, OH, USA) with an approximate internal diameter of 0.7 mm and height of 0.4 mm was placed on the enamel surface. Resin composite was injected into the tube; a clear cellophane sheet was placed over the resin composite, pressed gently and photo-irradiated (40 s/600 mW/cm2).
1 # # * against the resin-enamel interface. A shear force was applied to each specimen at a crosshead speed of 0.5 mm/min until failure occurred. All fractured specimens after PTBS and PSBS tests were mounted on aluminum stubs, sputter-coated and observed under a scanning electron microscope (JEOL 5600 LVj, JEOL Ltd., Tokyo, TYO, JPN). The bond failure # $ # # # three types: mixed (adhesive + cohesive failure of the neighboring substrates), cohesive (failure exclusively within enamel or resin composite) and adhesive (failure exclusively in adhesive interface).
Analysis of etching pattern under SEM
The effect of conditioning with 35% phosphoric acid and self-etching adhesive on the ground $ # ! treatment) were cut into two halves longitudinally in a mesial/distal direction. A deep lingual slit was prepared with a diamond bur to facilitate subsequent fracture of the etched surfaces. Phosphoric acid-etched enamel was rinsed with water spray for 15 s. Enamel etched with self-etch adhesive was rinsed
with ethanol and acetone to remove the monomers. After that, the same specimens were fractured to provide a sagittal view of the etched enamel. After 12 h in a desiccator, they were mounted on aluminum stubs for SEM analysis.
Statistical analysis
The mean bond strength of all specimens from the same hemi-tooth was averaged for statistical purposes. The cohesive failures and the pre-testing failures were not included in the statistical analysis. The bond strength mean for every tested group was expressed as the average of the six teeth used per group. The data from PTBS and PSBS were subjected to a two-way analysis of variance (Adhesive vs. Composite Resin) and Tukey’s test for pair-wise comparison (D
The correlation between the two bond strength test methods was analyzed by simple linear regression. The strength of the association between these two properties was estimated with Pearson’s product-moment correlation statistics (D The correlation was tested in two different ways. First, the mean bond strength value of each tooth
Adhesive systems Composition Application mode Batch
number Adper Single Bond 2
(3M ESPE)
1. Scotchbond – 35% phosphoric acid 2. Adhesive – Bis-GMA, HEMA, dimethacrylates, polyalkenoic acid copolymer, initiators, water and
ethanol
a, b, c, d, e, h 7KK
SoloBond Plus (VOCO)
1. Etching agent – Vococid 36% phosphoric acid 2.Primer - Maleic acid, hydrophilic methacrylates,
polyfunctional monomers, acetone, water
3. Bonding agent - HEMA, polyfunctional monomers
a1, b1, c, d1, e, f, i 621667
Futurabond NR (VOCO)
1. BIS-GMA, HEMA, phosphate methacrylates, BHT, f1, f2, g, h
Filtek Z250 (3M ESPE)
contents: stabilizers, catalysts and pigments. Particle size (average diameter: 0.6[0.01-3.5]) and
!"#$&'
±2 mm light cured for 40 s at 600 mW/cm2
7WN
Filtek Flow Z350 (3M ESPE)
2. Methacrylate resin monomers Bis-GMA, TEGDMA and Bis-EMA; dimethacrylate polymer; silica (75 nm) *<=>!?J!"Q=&
'
±2 mm light cured for 40 s at 600 mW/cm2
6AR
a- acid-etching (15 s); a1- acid-etching (30 s); b- rinsing (15 s); b1- rinsing (20 s); c- air-drying (30 s); d- two coats of adhesive were lightly applied (15 s); d1- one coat of primer was lightly applied(30 s); e- air-dry for 10 s at 20 cm; f- one coat of adhesive was applied (15 s); f1- mix one drop of liquid A and one drop of liquid B(5 s); f2- one coat of adhesive was lightly applied (20 s); g- air dry for s at 20 cm; h- light-polymerization (10 s - 600 mW/cm2); i- light polymerization (20 s -600 mW/cm2) Bis-GMA: bisphenol A diglycidyl methacrylate; HEMA: 2-hydroxyethyl methacrylate; BHT: butylated hydroxy toluene; UDMA: urethane dimethacrylate; TEGDMA: Triethylene glycol dimethacrylate; Bis-EMA: Bisphenol A polyethylene glycol diether dimethacrylate.
half was paired (total of 36 means) and the values were tested by the Pearson correlation test at D # $ means for each group were paired and tested using the same test (total of 6 means).
RESULTS
The fracture pattern mode (%) and the number of pre-testing failures observed in this experiment are shown in Table 1. The overall number of cohesive failures was higher with Filtek Flow Z350
(~60%) when compared with Filtek Z250 (~48%). A higher overall number of pre-testing failures was obtained with the PTBS test (14.2% or 68 out of 484) when compared to the PSBS test (4.4% or 4 %G $ mode observed in the present investigation for each test can be seen in Figure 2.
The mean cross-sectional area of the PTBS specimens ranged from 0.67 to 0.75 mm2, with a mean value of 0.71±0.1 mm2, while the bonding area of the PSBS specimens was 0.44 mm2. For the PTBS, two-way ANOVA detected that the
Figure 2- XY\\!^Y!<_>>?<?!<`>?<{?
tests. In (A), one can see an adhesive fracture pattern (white star). (B) and (E) represents cohesive resin failure. Black star shows resin composite in the same surface of both fractured specimens. (C) and (F) are mixed failures. Enamel is represented by the pointer, adhesive by the white star and resin composite by the black star. (C) represents a cohesive failure in enamel
<>?<=@?? Composite resin Adhesive
system
Cohesive in resin
Cohesive in enamel
H Adhesive Pre-testing
failures
Filtek Z250 Solobond Plus 46.8 (36) 2.6 (2) 44.2 (34) 1.3 (1) 5.2 (4)
Single Bond 41.8 (33) 6.3 (5) 35.4 (28) 0 (0) 16.5 (12)
Futurabond NR 49.4 (39) 11.4 (9) 29.1 (23) 1.3 (1) 8.9 (7)
Filtek Flow Z350 Solobond Plus 62.7 (47) 1.1 (1) 23.2(20) 0 (0) 20.9 (18)
Single Bond 54.1 (46) 2.4 (2) 17.7 (15) 0 (0) 25.9 (22)
Futurabond NR 55.1 (49) 0 (0) 25.8 (23) 1.1 (1) 18 (16)
<>@?? Composite resin Adhesive
system
Cohesive in resin
Cohesive in enamel
H Adhesive Pre-testing
failures
Filtek Z250 Solobond Plus 71.4 (10) 0 (0) 28.6 (4) 0 (0) 0 (0)
Single Bond 40 (6) 0 (0) 60 (9) 0 (0) 0 (0)
Futurabond NR 31.3 (5) 0 (0) 62.5 (10) 0 (0) 6.25 (1)
Filtek Flow Z350 Solobond Plus 70.6 (12) 0 (0) 23.5 (4) 0 (0) 5.9 (1)
Single Bond 45.5 (5) 0 (0) 45.5 (5) 0 (0) 9 (1)
Futurabond NR 50 (10) 0 (0) 45 (9) 0 (0) 5 (1)
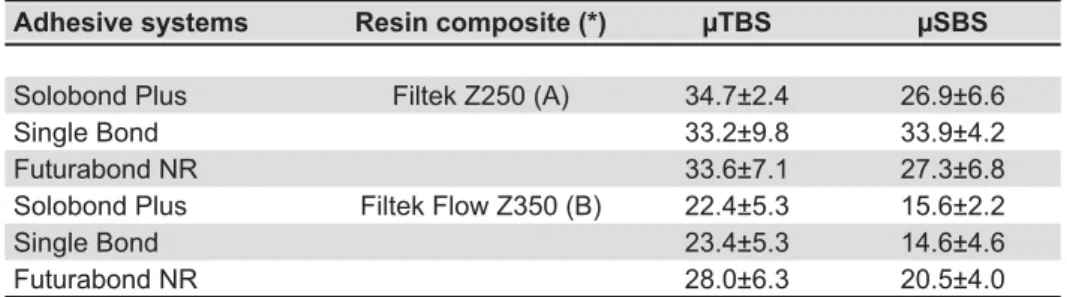
'# ! }# $ ! !& The means and standard deviations (MPa) of this test are shown in Table 2. It can be observed that higher PTBS values were obtained with the microhybrid Filtek Z250 composite. With regard to the PSBS, only the main factor resin composite !& # # standard deviations (MPa) can be seen in Table 2.
Similarly to the PTBS test, higher bond strength values were observed with Filtek Z250.
Pearson’s correlation test detected a positive !%&#!&& between the two bond strength tests, only when the means of each experimental group were paired. When the bond strength values from the same tooth #1 ?! %1 $ !G! G
SEM micrographs of the etching pattern produced by 35% phosphoric acid and by the self-etch
Figure 4- Scanning eletron microscopy micrographs of the 35% phosphoric acid etching (A) and the self-etch Futurabond NR (B) patterns. Selective demineralization of enamel prism periphery can be observed (white arrow, type 2 pattern). Prism '"!*^<?<?!*^"\ adhesive resembles the type 2 pattern, prism peripheries were demineralized more deeply than prism cores. A shallower demineralization is observed in comparison to that produced by the phosphoric acid treatment
Adhesive systems Resin composite (*) μTBS μSBS
Solobond Plus Filtek Z250 (A) 34.7±2.4 26.9±6.6
Single Bond 33.2±9.8 33.9±4.2
Futurabond NR 33.6±7.1 27.3±6.8
Solobond Plus Filtek Flow Z350 (B) 22.4±5.3 15.6±2.2
Single Bond 23.4±5.3 14.6±4.6
Futurabond NR 28.0±6.3 20.5±4.0
Table 2- Microtensile (μTBS) and microshear bond strength (μSBS) values and, respective standard deviations (MPa)
(*) Groups with different letters are statistically different for tests (Tukey’s test, p<0.05).
Futurabond NR are depicted in Figure 4. Although the enamel crystallite dissolution pattern produced by the self-etch system is similar to that produced by phosphoric acid, as both treatments created selective etching of prism cores and peripheries, there is contrast, as the demineralization produced # # # the one produced by phosphoric acid.
DISCUSSION
At present, with the improvements in adhesive system bond strength to enamel and dentin, new micro bond tests need to be developed22,25. However, each test method has both advantages and limitations. In view of this fact, the selection and use of the most feasible test method appears to be an important parameter when conducting a laboratory evaluation12.
According to the results of the present study, both PTBS and PSBS tests showed that the bond strength of the self-etch adhesive system Futurabond NR to ground enamel was as high as the bond strengths of the two etch-and-rinse adhesive systems tested. However, this is not consensual in the literature4,11,14. Although no data were found in the literature with regard to bond tests using Solobond Plus and Futurabond NR to ground enamel, there are some studies that have used similar bonding approaches, which corroborate the # $# # enamel is abraded, some strong and intermediately strong self-etch systems may reach bond strength values as high as those obtained with phosphoric acid based adhesives4,11.
The analysis of the self-etch adhesive etching pattern improves the understanding of the present #Q # # on the micromechanical interlocking of a low-viscosity resin through the formation of tag-like resin extensions into the enamel microporosities, it seems that, apart from the mechanical properties of the adhesive itself, the extent, depth and pattern #* evaluated adhesive19. Although the etching pattern provided by Futurabond NR, an intermediate strong !`& 1 # # evident as that provided by phosphoric acid etching, selective enamel etching could be observed, which may have played a role in the good performance of this adhesive.
However, more important than the adhesives was the type of composite used. Filtek Z250 achieved higher bond strength values in both tests indicating *
# + # 2, low
viscosity composites were developed to achieve a better sealing of the cavity margins28. In some
# * of this composite is favorable. This explains why some authors have chosen this type of composite to #PSBS testing10,17,23 instead of the conventional microhybrid composite6. This # # # regarding lower mechanical properties and higher polymerization shrinkage when compared with traditional hybrid composites2. The elastic modulus # # (30-50%) when compared with traditional hybrid composites3.
This fact might explain the high number of cohesive failures (~60%) and the lower resin-enamel bond strength means measured in both bond test methods with composite Filtek Flow Z350. In addition, the higher polymerization shrinkage of the low-viscosity composite could potentially create more stress in the interface areas than traditional composites during composite polymerization. Flowable composites do not support higher stresses, particularly when subjected to the PSBS bond }#
strength analyses181 *
in PSBS testing concentrates more stress around # $ # composites.
Most studies that use the PTBS test usually report premature failures8,23,20 during specimen ## $ # the present study. In comparison with PSBS testing, the PTBS test showed a higher overall percentage of pre-testing failures. This result indicates that the rather aggressive slicing procedure used in specimen preparation for PTBS testing might induce several structural enamel defects and cracks, leading to premature failures. It can be assumed that this might happen due to the intrinsic brittleness of the enamel tissue in the reduced surface areas used in the PTBS specimens. This could be an advantage of the PSBS over the PTBS test since it does not require any slicing of the enamel substrate prior to testing.
In a previous scanning electron microscopy investigation of unloaded specimens prepared for PTBS testing8, all the specimens revealed the presence of structural defects, which would possibly * # $ # # The authors pointed out that these defects were more frequent in enamel than in dentin specimens. It was then speculated that the brittleness and low elasticity of enamel may render these specimens intrinsically more prone to defects and failure. This observation is in agreement with other studies that found that enamel specimens can easily crack during the action of trimming20,27.
#1 $ reached by both tests was the same when the adhesives were tested in enamel. This was # $ # found between these two bond strength tests in the present investigation. It is noteworthy to mention that this situation might be different in dentin, since no cracking of the substrate is expected to occur when PTBS test is performed and higher bond strength values are to be measured8. If a bond strength test is capable of measuring higher values, an increase in the sensitivity of the test makes it capable of detecting subtle differences between groups.
The ideal scenario would be to choose a test that produces only interfacial failures and high bond strengths values13. However, other factors should be considered before choosing the bond test method. For instance, determination of bond strengths to erosion/abrasion cavities in tooth substrates or box-like cavities should be better achieved with the PTBS test15. However, the PSBS test should be # * a cut tube can be placed. Moreover, in the case of measuring bond strengths in complex preparations with high C-factors, only a PTBS test, which can isolate the required area, can be chosen. It is useful for measuring regional variations in resin bond strength to endodontic posts or the inside of root
canals15 *
* #1 PSBS test could be used.
It may be hypothesized that the selection of the bond strength test seems to be much more dependent on the experimental design of the study. Researchers need to understand the limitations of their test technique and must be sure to document how they conducted the test13 because it is imperative to understand all conditions that act on the test protocol in in vitro testing9. Some authors claim that shear stress is considered more representative of the clinical situation5. Nevertheless, it has been pointed out that the stress distribution in this test is non-uniform7,30. While this shear stress is considerably lower than the stresses occurring in the shear test arrangement, it is by no means suggested that tensile testing is ideal. In the case of PTBS test, although irregular stress distributions due to geometry are avoided, the interfacial stress may not be uniformly tensile due to the changes in elastic modulus of the bonding components29.
Both the PTBS and the PSBS tests can be used # # $ 1$# # # are cautiously interpreted, since differing methods of load application clearly lead to differing stress distributions23. Tensile and shear loadings seem to be equally good for laboratory testing of the
adhesive quality of resin systems16.
CONCLUSIONS
Within the limitations of the present investigation, it may be concluded that a microhybrid resin composite should preferably be used for PTBS and PSBS testing due to the reduced number of cohesive failures, and due to the number of high bond strength values obtained, which makes the test more sensitive for measuring differences among experimental conditions. Moreover, both methods seem to be positive and linearly correlated, and can therefore lead to similar conclusions.
ACKNOWLEDGMENTS
# # for PhD degree (AMA) at the University of São Paulo (USP). The authors are grateful to Dr. Mário Fernando de Goes for his assistance with the microshear tests, and to VOCO and Saint Gobain for the donation of the materials used. Grants: Conselho Nacional de $$ ' !'X 473101/2006-8, 305870/2004-1, 135807/2006-9 and 307319/2006-7.
REFERENCES
1- Al-Salehi SK, Burke FJ. Methods used in dentin bonding tests: an analysis of 50 investigations on bond strength. Quintessence Int. 1997;28:717-23.
2- Bayne SC, Thompson JY, Swift EJ Jr, Stamatiades P, Wilkerson J} * Am Dent Assoc. 1998;129:567-77.
3- Behle C. Flowable composites: properties and applications. Pract Periodontics Aesthet Dent. 1998;10:347-50.
4- Brackett WW, Tay FR, Looney SW, Ito S, Haisch LD, Pashley DH. Microtensile dentin and enamel bond strengths of recent self-etching resins. Oper Dent. 2008;33:89-95.
5- Cardoso PE, Braga RR, Carrilho MR. Evaluation of micro-tensile, shear and tensile tests determining the bond strength of three adhesive systems. Dent Mater. 1998;14:394-8.
6- Carvalho CN, Oliveira Bauer JR, Loguercio AD, Reis A. Effect of ZOE temporary restoration on resin-dentin bond strength using different adhesive strategies. J Esthet Restor Dent. 2007;19:144-52.
` X`1 }$ 1 @ # element analysis of the shear bond test. Dent Mater. 1995;11:126-31.
8- Ferrari M, Goracci C, Sadek F, Eduardo P, Cardoso C. Microtensile bond strength tests: scanning electron microscopy evaluation of sample integrity before testing. Eur J Oral Sci. 2002;110:385-91. 9- Foxton RM, Nakajima M, Tagami J, Miura H. Adhesion to root canal dentine using one and two-step adhesives with dual-cure composite core materials. J Oral Rehabil. 2005;32:97-104. 10- Garcia RN, Reis AF, Giannini M. Effect of activation mode of dual-cured resin cements and low-viscosity composite liners on bond strength to dentin. J Dent. 2007;35:564-9.
12- Ishikawa A, Shimada Y, Foxton RM, Tagami J. Micro-tensile and micro-shear bond strengths of current self-etch adhesives to enamel and dentin. Am J Dent 2007;20:161-6.
13- McDonough WG, Antonucci JM, He J, Shimada Y, Chiang MY, Schumacher GE, et al. A microshear test to measure bond strengths of dentin-polymer interfaces. Biomaterials. 2002;23:3603-8. 14- Moura SK, Reis A, Pellizzaro A, Dal Bianco K, Loguercio AD, Arana-Chavez VE, et al. Bond strength and morphology of self-etching adhesive systems with different acidities. J Appl Oral Sci. 2009;17:315-25.
15- Pashley DH, Carvalho RM, Sano H, Nakajima M, Yoshiyama M, Shono Y, et al. The microtensile bond test: a review. J Adhes Dent. 1999;1:299-309.
&X??Q1+J1J * sectional shape and surface area on the microtensile bond test. Dent Mater. 1998;14:212-21.
17- Pivetta MR, Moura SK, Barroso LP, Lascala AC, Reis A, Loguercio AD, et al. Bond strength and etching pattern of adhesive systems to enamel: effects of conditioning time and enamel preparation. J Esthet Restor Dent. 2008;20:322-35.
18- Placido E, Meira JB, Lima RG, Muench A, Souza RM, Ballester Q $ # stress analysis. Dent Mater. 2007;23:1086-92.
19- Rotta M, Bresciani P, Moura SK, Grande RH, Hilgert LA, Baratieri LN, et al. Effects of phosphoric acid pretreatment and substitution of bonding resin on bonding effectiveness of self-etching systems to enamel. J Adhes Dent. 2007;9:537-45.
20- Sadek FT, Cury AH, Monticelli F, Ferrari M, Cardoso PE. The * ## # microtensile specimens. Dent Mater. 2005;21:1144-9.
21- Sano H, Ciucchi B, Matthews WG, Pashley DH. Tensile properties of mineralized and demineralized human and bovine dentin. J Dent Res. 1994;73:1205-11.
22- Sano H, Shono T, Sonoda H, Takatsu T, Ciucchi B, Carvalho R, et al. Relationship between surface area for adhesion and tensile bond strength - evaluation of a micro-tensile bond test. Dent Mater. 1994;10:236-40.
23- Senawongse P, Sattabanasuk V, Shimada Y, Otsuki M, Tagami J. Bond strengths of current adhesive systems on intact and ground enamel. J Esthet Restor Dent. 2004;16:107-15.
24- Shaffer SE, Barkmeier WW, Gwinnett AJ. Effect of disinfection/sterilization on in-vitro enamel bonding. J Dent Educ. 1985;49:658-9.
25- Shimada Y, Antonucci JM, Schumacher GE, McDonough WG, Tagami J. Effects of regional tooth structure and sectioning orientation on micro-shear bond strength. In: 3rd International
Kuraray Symposium Advanced Adhesive Dentistry, 1999, Granada, Espanha. Annals of 3rd International Kuraray Symposium Advanced
Adhesive Dentistry, 1999. p. 91-103.
26- Shimada Y, Kikushima D, Tagami J. Micro-shear bond strength of resin-bonding systems to cervical enamel. Am J Dent. 2002;15:373-7.
27- Shimada Y, Tagami J. Effects of regional enamel and prism orientation on resin bonding. Oper Dent. 2003;28:20-7. 28- Unterbrink GL. Liebenberg WH. Flowable resin composites as ## $ $ # # Quintessence Int. 1999;30:249-57.
29- Van Noort R, Cardew GE, Howard IC, Noroozi S. The effect of local interfacial geometry on the measurement of the tensile bond strength to dentin. J Dent Res. 1991;70:889-93.