DOI: http://dx.doi.org/10.5007/1980-0037.2014v16n1p96
original article
Licence Creative Commom CCRBCDH
1 Universidade Federal do Rio Grande do Norte. Programa de Pós-Graduação em Educação Física. Natal, RN, Brasil.
2 Universidade Federal do Rio Grande do Norte. Departamento de Pediatria. Natal, RN, Brasil.
3 Universidade Federal do Rio Grande do Norte. Hospital de Pediatria. Natal, RN, Brasil.
4 Universidade Federal do Rio Grande do Norte. Graduação em Educação Física. Natal, RN, Brasil.
Received: 16 February 2013 Accepted: 06 August 2013
Discriminant analysis of pubertal
maturation in young males based on
anthropometric characteristics
Análise discriminante da maturação puberal de jovens
do sexo masculino, a partir das características
antropométricas
Radamés Maciel Vítor Medeiros1
Ricardo Fernando Arrais2
Jenner Chrystian Veríssimo de Azevedo3
Jason Azevedo de Medeiros¹ Ricardo Dias de Andrade4
André Igor Fonteles1
Jeferson Tafarel Pereira do Rêgo1
Paulo Moreira Silva Dantas1
Abstract– he relationship between anthropometric variables and maturation stages is important for a more detailed monitoring of pubertal development and may provide a suitable tool for clinical diagnosis. he aim of this study was to analyze the predictive contribution of anthropometric variables to pubertal maturation using multivariate discri-minant analysis. A total of 190 boys aged 8 to 18 years, from public and private schools in Natal, Brazil, participated in the study. hirty-two anthropometric variables were measured and pubertal maturation was evaluated objectively by observing pubic hair development. Measures of central tendency and dispersion, inferential analysis of variance, and multi-variate discriminant analysis were used for statistical analysis. Pubertal advancement was accompanied by signiicant changes in anthropometric variables (p<0.05). Discriminant analysis identiied eight variables with a high predictive capacity of pubertal maturation: age, sitting height, biacromial breadth, acromiale-radiale, trochanterion-tibiale laterale and tibiale laterale bone lengths, and abdominal and forearm girths. he anthropometric variables showed a high correlation with the classiication of pubertal maturation, dem-onstrating a high predictive level among them. hese indings indicate the possibility of developing a predictive equation for pubertal stages.
Key words: Anthropometry; Discriminant analysis; Puberty; Sexual maturity.
Considered one of the most complex phases of human development, puberty is understood as the process of transformation from the child’s body into an adult body capable of reproduction. his process is directly
related to events of mental, somatic and sexual maturation1,2. During this
phase, the activation of the production of adrenal androgens is the result of maturation of the adrenal cortex, a process known as “adrenarche”. his event manifests as clinical signs such as the appearance of armpit odor, an increase in skin oiliness, and growth of axillary and/or pubic
hair (“pubarche”)3,4.
In addition to pubic hair, the clinical evaluation of male genital and female breast development is the standard method to monitor pubertal development, since it identiies the progression of secondary sexual
char-acteristics2,5-7. he method proposed by Marshall and Tanner8 is the most
commonly used for this purpose, which describes the main changes in external sexual characteristics that occur during the period before (stage 1) and ater puberty (stage 5).
In boys, these stages are marked by an increase in the production of sex hormones. hese hormones are responsible for morphological modiications and, consequently, for the process of physical growth and
diferentiation of body composition and anthropometric measures9,10. he
relationship between maturation stages and anthropometry is important for a more detailed monitoring of pubertal development, since external
characteristics are more visible for clinical diagnosis5,9,11. In this respect,
anthropometric assessment is a potentially adequate and suitable tool for the evaluation of pubertal stages, since it avoids more delicate situations such as embarrassment and/or lack of privacy during the observation of
secondary sexual characteristics11,12.
However, the analysis of this relationship should not only take into account a perspective of causality, but also the inter-relations between variables, by evaluating the capacity of one or more dependent variables to predict an independent variable. herefore, in this study multivariate discriminant analysis of pubertal maturation was performed based on anthropometric variables, identifying the inter-relation between variables and their predictive capacity.
METHODOLOGICAL PROCEDURES
Sample
stand-Relationship between anthropometric variables and pubertal maturation Medeiros et al.
ard deviation, and standard error of the estimate of the data. A minimum sample size of 181 subjects was deined.
Only subjects whose parents or legal guardian signed the free informed consent form were submitted to the evaluations. he initial sample con-sisted of 198 boys. However, on the basis of criteria previously established by the researchers, eight subjects were excluded because of the presence of some genetic syndrome, cognitive deicit, treatment with growth hormone, gonadotrophin-releasing hormone agonists and sex steroids, or a diagnosis of chronic diseases that would compromise the interpretation of the results. he study was approved by the Research Ethics Committee of UFRN (Protocol No. 618/11).
Anthropometric assessment
he following 30 anthropometric variables were measured according to the recommendations of the International Society for the Advancement of
Ki-nanthropometry (ISAK)13: body mass, stature, sitting height, ive breadths
(biacromial, biiliocristal, transverse chest, biepicondylar humerus, and biepicondylar femur), ive bone lengths (acromiale-radiale, radiale-stylion, midstylion-dactylion, trochanterion-tibiale laterale, and tibiale laterale), 10 girths (head, neck, arm relaxed, arm lexed and tensed, forearm, wrist, chest, waist, hip, and calf), and seven skinfolds (triceps, subscapular, bi-ceps, abdominal, supraspinale, iliac crest, and medial calf). In addition,
abdominal girth was evaluated as described by Martins and Lopes14, and leg
length was calculated as the diference between sitting height and stature. Body mass was measured with a Welmy (model W110H) electronic scale (capacity of 300 kg) to the nearest 50 g. Stature was measured with a height ruler (scale of 1.00 to 2.00 m) to the nearest 0.1 cm. A Sanny anthropometric measuring tape (2 m long) was used to measure girths and sitting height to the nearest 0.1 cm. Breadths and bone lengths were measured to the nearest 0.1 cm with a Sanny segmometer (2 m long) and a Cescorf metal pachymeter, respectively. A Harpenden caliper (John Bull British Indicators Ltd), with a scale of 0.2-mm units and interpolation of 0.1 mm, was used for skinfold measurements.
Technical error of measurement
A study including 26 subjects was conducted in parallel to calculate the inter- and intraobserver technical error of measurement (TEM). Frontal thigh skinfold and thigh girth presented an error of 7.59% and 4.50%, re-spectively, and were excluded from the study since these results are higher than the cut-of values reported in the literature (5% for skinfolds and 1% for the other anthropometric variables).
Evaluation of pubertal maturation
Two pediatric endocrinologists from HOSPED-UFRN evaluated pubertal
stage based on the Tanner stages for pubic hair (P1-P5)15. he coeicient of
First, analysis of the distribution of the data by the Shapiro-Wilk and Levene tests showed that all skinfold variables presented a nonparametric distribution. hese variables were corrected by base 10 logarithmic trans-formation. Next, descriptive analysis was performed using measures of central tendency and dispersion. One-way analysis of variance (ANOVA), with the Schefé post hoc test, was used for inferential analysis.
Multivariate discriminant analysis was performed by simultaneous estimation in order to generate a function that would identify the inter-relation between pubertal stages and anthropometric variables. Discrimi-nant analysis is the most adequate statistical method for this purpose as
recommended by Hair et al.17 and reported in recent studies11, 12. In addition,
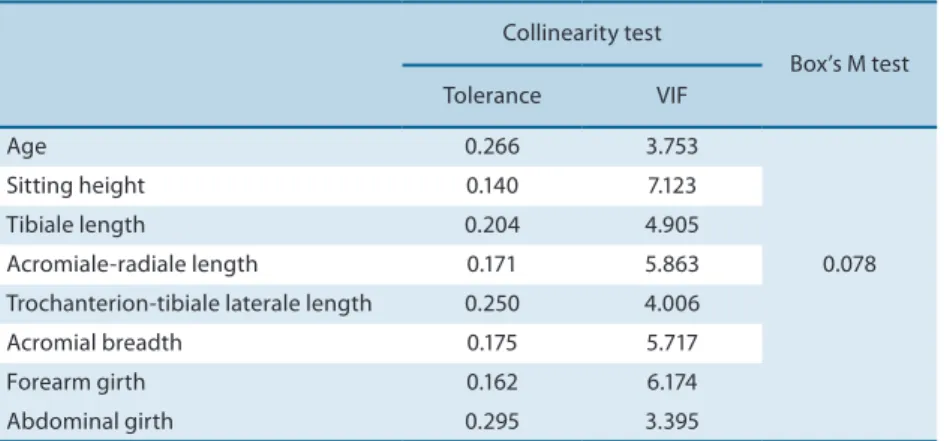
the assumptions of discriminant analysis of normality, multicollinearity (tolerance > 0.1 and variance inlation factor < 10) and homogeneity of the
covariance matrix (p > 0.05), were determined as shown in Table 1.
he Statistica 6.0 program and SPSS 19.0 package (SPSS Inc., Chicago, IL,
USA) were used for data analysis, adopting a level of signiicance of p < 0.05.
Table 1. Collinearity tests and homogeneity of the covariance matrix.
Collinearity test
Box’s M test Tolerance VIF
Age 0.266 3.753
0.078
Sitting height 0.140 7.123
Tibiale length 0.204 4.905
Acromiale-radiale length 0.171 5.863 Trochanterion-tibiale laterale length 0.250 4.006 Acromial breadth 0.175 5.717
Forearm girth 0.162 6.174
Abdominal girth 0.295 3.395
VIF: variance inlation factor.
RESULTS
Relationship between anthropometric variables and pubertal maturation Medeiros et al.
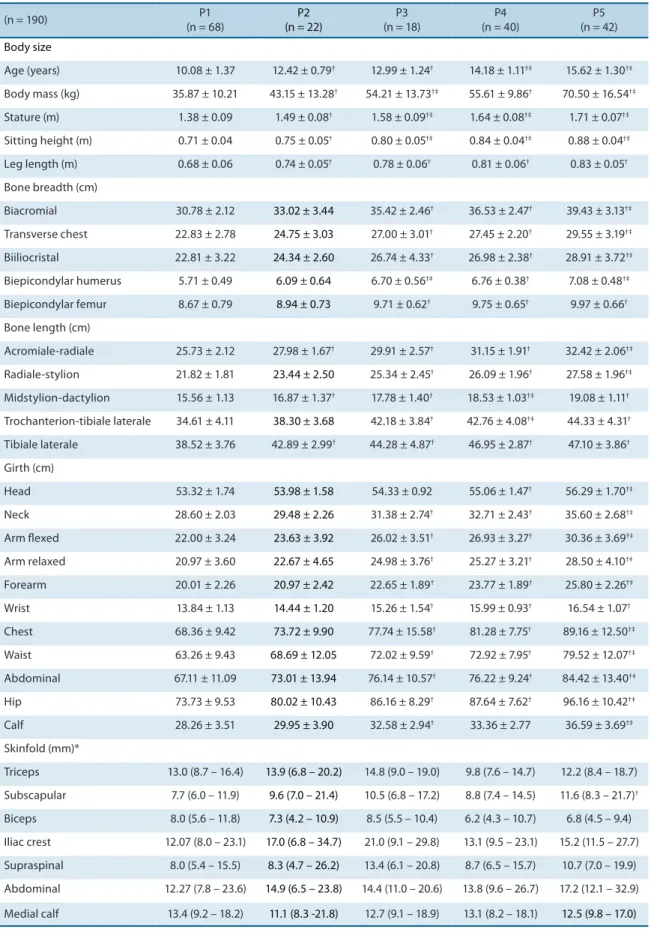
Table 2. Mean and standard deviation of the anthropometric variables according to pubertal stage of pubic hair development.
(n = 190) P1
(n = 68)
P2 (n = 22)
P3 (n = 18)
P4 (n = 40)
P5 (n = 42)
Body size
Age (years) 10.08 ± 1.37 12.42 ± 0.79† 12.99 ± 1.24† 14.18 ± 1.11†‡ 15.62 ± 1.30†‡
Body mass (kg) 35.87 ± 10.21 43.15 ± 13.28† 54.21 ± 13.73†‡ 55.61 ± 9.86† 70.50 ± 16.54†‡
Stature (m) 1.38 ± 0.09 1.49 ± 0.08† 1.58 ± 0.09†‡ 1.64 ± 0.08†‡ 1.71 ± 0.07†‡
Sitting height (m) 0.71 ± 0.04 0.75 ± 0.05† 0.80 ± 0.05†‡ 0.84 ± 0.04†‡ 0.88 ± 0.04†‡
Leg length (m) 0.68 ± 0.06 0.74 ± 0.05† 0.78 ± 0.06† 0.81 ± 0.06† 0.83 ± 0.05†
Bone breadth (cm)
Biacromial 30.78 ± 2.12 33.02 ± 3.44 35.42 ± 2.46† 36.53 ± 2.47† 39.43 ± 3.13†‡
Transverse chest 22.83 ± 2.78 24.75 ± 3.03 27.00 ± 3.01† 27.45 ± 2.20† 29.55 ± 3.19†‡
Biiliocristal 22.81 ± 3.22 24.34 ± 2.60 26.74 ± 4.33† 26.98 ± 2.38† 28.91 ± 3.72†‡
Biepicondylar humerus 5.71 ± 0.49 6.09 ± 0.64 6.70 ± 0.56†‡ 6.76 ± 0.38† 7.08 ± 0.48†‡
Biepicondylar femur 8.67 ± 0.79 8.94 ± 0.73 9.71 ± 0.62† 9.75 ± 0.65† 9.97 ± 0.66†
Bone length (cm)
Acromiale-radiale 25.73 ± 2.12 27.98 ± 1.67† 29.91 ± 2.57† 31.15 ± 1.91† 32.42 ± 2.06†‡
Radiale-stylion 21.82 ± 1.81 23.44 ± 2.50 25.34 ± 2.45† 26.09 ± 1.96† 27.58 ± 1.96†‡
Midstylion-dactylion 15.56 ± 1.13 16.87 ± 1.37† 17.78 ± 1.40† 18.53 ± 1.03†‡ 19.08 ± 1.11†
Trochanterion-tibiale laterale 34.61 ± 4.11 38.30 ± 3.68 42.18 ± 3.84† 42.76 ± 4.08†‡ 44.33 ± 4.31†
Tibiale laterale 38.52 ± 3.76 42.89 ± 2.99† 44.28 ± 4.87† 46.95 ± 2.87† 47.10 ± 3.86†
Girth (cm)
Head 53.32 ± 1.74 53.98 ± 1.58 54.33 ± 0.92 55.06 ± 1.47† 56.29 ± 1.70†‡
Neck 28.60 ± 2.03 29.48 ± 2.26 31.38 ± 2.74† 32.71 ± 2.43† 35.60 ± 2.68†‡
Arm lexed 22.00 ± 3.24 23.63 ± 3.92 26.02 ± 3.51† 26.93 ± 3.27† 30.36 ± 3.69†‡
Arm relaxed 20.97 ± 3.60 22.67 ± 4.65 24.98 ± 3.76† 25.27 ± 3.21† 28.50 ± 4.10†‡
Forearm 20.01 ± 2.26 20.97 ± 2.42 22.65 ± 1.89† 23.77 ± 1.89† 25.80 ± 2.26†‡
Wrist 13.84 ± 1.13 14.44 ± 1.20 15.26 ± 1.54† 15.99 ± 0.93† 16.54 ± 1.07†
Chest 68.36 ± 9.42 73.72 ± 9.90 77.74 ± 15.58† 81.28 ± 7.75† 89.16 ± 12.50†‡
Waist 63.26 ± 9.43 68.69 ± 12.05 72.02 ± 9.59† 72.92 ± 7.95† 79.52 ± 12.07†‡
Abdominal 67.11 ± 11.09 73.01 ± 13.94 76.14 ± 10.57† 76.22 ± 9.24† 84.42 ± 13.40†‡
Hip 73.73 ± 9.53 80.02 ± 10.43 86.16 ± 8.29† 87.64 ± 7.62† 96.16 ± 10.42†‡
Calf 28.26 ± 3.51 29.95 ± 3.90 32.58 ± 2.94† 33.36 ± 2.77 36.59 ± 3.69†‡
Skinfold (mm)*
Triceps 13.0 (8.7 – 16.4) 13.9 (6.8 – 20.2) 14.8 (9.0 – 19.0) 9.8 (7.6 – 14.7) 12.2 (8.4 – 18.7) Subscapular 7.7 (6.0 – 11.9) 9.6 (7.0 – 21.4) 10.5 (6.8 – 17.2) 8.8 (7.4 – 14.5) 11.6 (8.3 – 21.7)†
Biceps 8.0 (5.6 – 11.8) 7.3 (4.2 – 10.9) 8.5 (5.5 – 10.4) 6.2 (4.3 – 10.7) 6.8 (4.5 – 9.4) Iliac crest 12.07 (8.0 – 23.1) 17.0 (6.8 – 34.7) 21.0 (9.1 – 29.8) 13.1 (9.5 – 23.1) 15.2 (11.5 – 27.7) Supraspinal 8.0 (5.4 – 15.5) 8.3 (4.7 – 26.2) 13.4 (6.1 – 20.8) 8.7 (6.5 – 15.7) 10.7 (7.0 – 19.9) Abdominal 12.27 (7.8 – 23.6) 14.9 (6.5 – 23.8) 14.4 (11.0 – 20.6) 13.8 (9.6 – 26.7) 17.2 (12.1 – 32.9) Medial calf 13.4 (9.2 – 18.2) 11.1 (8.3 -21.8) 12.7 (9.1 – 18.9) 13.1 (8.2 – 18.1) 12.5 (9.8 – 17.0)
age) were submitted to multivariate discriminant analysis. Of these, only eight variables were selected as the best predictors of pubertal stage: age, sitting height, biacromial breadth, acromiale-radiale, trochanterion-tibiale laterale and tibiale laterale bone lengths, and abdominal and forearm girths. his analysis permitted the creation of four discriminant functions that represent the discriminatory power of the eight variables selected to predict pubertal maturation.
he validity of the four discriminant functions was tested based on eigenvalues, canonical correlations and Wilk’s lambda values. In general, the irst function explained most of the variance (94.8%) in the prediction of pubertal stages. On the other hand, the fourth function showed a poor
prediction rate, as indicated by a very low eigenvalue and a p value higher than
0.05. his inding shows that this function has a low capacity of observing diferences between groups and its use becomes unnecessary further analysis.
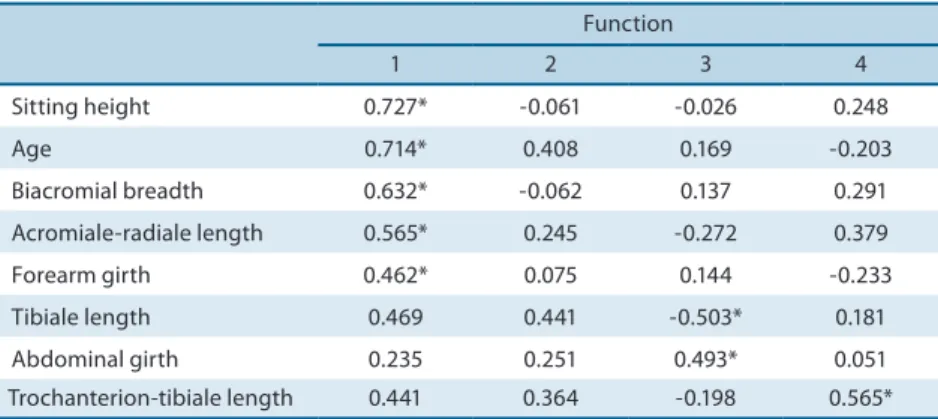
Table 3. Contribution load of each variable to the discriminant functions.
Function
1 2 3 4
Sitting height 0.727* -0.061 -0.026 0.248
Age 0.714* 0.408 0.169 -0.203
Biacromial breadth 0.632* -0.062 0.137 0.291 Acromiale-radiale length 0.565* 0.245 -0.272 0.379 Forearm girth 0.462* 0.075 0.144 -0.233 Tibiale length 0.469 0.441 -0.503* 0.181 Abdominal girth 0.235 0.251 0.493* 0.051 Trochanterion-tibiale length 0.441 0.364 -0.198 0.565*
* Highest absolute correlation between each variable and any discriminant function.
he contribution of each anthropometric variable to the formation of the four discriminant functions is shown in Table 3. Age and sitting height were the most important variables to explain the diference between subjects classiied as P1 to P5, followed by biacromial breadth, acromiale-radiale bone length and forearm girth. Tibiale and trochanterion-tibiale lengths and abdominal girth were more important for the formation of discriminant functions 3 and 4, conirming their relationship with ad-vanced maturation stages, but more discretely.
Table 4. Mean values of the discriminant functions (centroids) according to pubertal stage.
Pubic hair Function
1 2 3 4
Stage 1 -2.780 -0.299 0.001 -0.037 Stage 2 -1.094 1.075 0.280 -0.142
Stage 3 0.346 0.165 0.130 0.577
Relationship between anthropometric variables and pubertal maturation Medeiros et al.
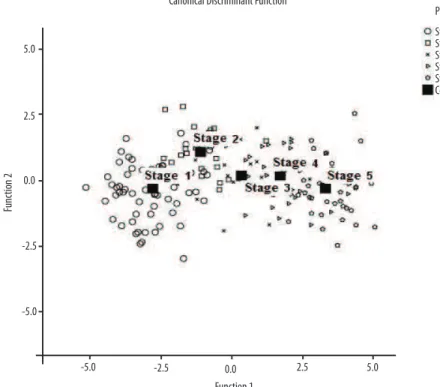
Figure 1. Graphic representation of central values (centroids) for the prediction of pubertal maturation based on anthropometric variables.
Table 4 shows the centroids of the discriminant functions, which are deined as the mean value of discriminant Z scores obtained for each group, i.e., each centroid corresponds to the cut-ofs necessary to separate the ive groups analyzed. hese values permit visual analysis of the distance between pubertal stages, as illustrated in Figure 1.
Analysis of the rate of successful prediction of pubertal maturation based on the anthropometric variables showed good results. his analysis,
called classiication matrix, is considered to be analog to the R2 of multiple
linear regression and permits to determine the predictive signiicance of discriminant functions. In the present study, 77.4% of the groups were classiied correctly, demonstrating satisfactory prediction of maturation stages when based on the eight anthropometric variables selected by dis-criminant analysis. he minimum percent value found was 64.8% for P3, whereas the maximum value was 85.1% for P1.
DISCUSSION
Analysis of the relationship between the advancement of puberty and changes in the anthropometric proile of boys is an important noninvasive diagnostic tool of maturation stage in these subjects, especially because it reduces the invasion of the patient’s privacy.
In this respect, Table 2 demonstrates the inluence of pubic hair de-velopment on the anthropometric variables studied, in agreement with
the literature6,15,18. he hormone-regulated metabolic processes that occur
crease in body mass .
No signiicant diference in skinfolds was observed between pubertal stages, except for subscapular skinfold thickness between P4 and P5. In addition, these variables showed a nonparametric distribution. his inding demonstrates the need to control for the nutritional status of the subjects which may interfere with the progression of each stage. his was a limita-tion of the present study.
However, the absence of signiicant diferences in the distribution of body adiposity is a common feature during puberty, since the increase in body mass is more related to a gain in muscle mass and consequent
stabilization of fat mass18,19.
Multivariate discriminant analysis of the variables studied identiied eight variables with a high predictive power for pubertal stages, with the observation of a high inter-relation index. Using the same method in young
Venezuelan swimmers, Pérez et al.12 obtained a high predictive index based
on eight anthropometric variables, indicating that this is a habitual number for discriminant analysis in subjects of this age group.
On the basis of the canonical correlations, we observed that function 1 explained 86% of the variance of discriminant analysis, a value considered
to be high17, thus identifying this function as the most important. his
perspective is conirmed by Wilks’ lambda test, a test used to calculate the signiicance of discriminant functions, with this being found only in the irst three functions of this study, and identifying the low estimation of the fourth function for continuation of the analysis.
As can be seen in Table 3, age, sitting height, biacromial breadth, acromiale-radiale bone length and forearm girth presented the highest contribution loads for the formation of function 1. In young swimming
athletes, Pérez et al.12 identiied stature, body mass, calf and relaxed arm
girth, and stylion-dactylion and trochanterion-tibiale bone lengths. Al-though samples with diferent characteristics were studied, the variables selected in the two studies and their relationships were similar.
he centroid values showed the level of dispersion between pubertal stages. Function 1 more eiciently predicts the separation of pubertal stages into three diferent groups based on the grouping P1+P2, only on stage P3, and on the grouping P4+P5. Despite the cross-sectional design, these results are likely to be related to the period of deceleration in anthropo-metric changes during the early stages of pubertal development, followed by acceleration in stage 4 which is determined mainly by the occurrence
of peak growth velocity in boys18.
Similarly, the centroid values of function 2 permit the separation of pubertal stages into three distinct groups (P1, P2-P3-P4, P5), in agreement
with Tanner15 who proposed three phases of pubic hair development, i.e.,
Relationship between anthropometric variables and pubertal maturation Medeiros et al.
related to each maturation stage, concretely conirming the suitability of this method. his interpretation can be better understood by inspection of Figure 1, which clearly illustrates the degree of separation between the ive stages. he predictive index of pubic hair stages was 77.4% based on only seven anthropometric variables. his value is considered to be high and is within the limits established in the literature. his index is thus adequate for the determination of the inter-relation between the variables analyzed
and the predictive value that one has over the other17,21.
However, a more detailed analysis indicated caution with respect to stage 3, since this stage showed a moderate correlation with the anthro-pometric variables and may be underestimated in predictive analyses. In addition, we observed a percent error of 23.9%, which exposed the main limitation of the study, i.e., the biases found in anthropometric assessment which, in addition to requiring training, are strongly inluenced by the skills of the observers as well as by inter- and intraobserver errors. Despite the control of these errors in the present study, we identiied this to be an essential problem for future studies.
CONCLUSIONS
Discriminant analysis revealed a strong relationship between the anthro-pometric variables and pubertal stages, demonstrating the suitability of this observation method as a noninvasive tool for the diagnosis of pubertal maturation in boys. However, the bias in anthropometric assessment should be taken into account. On this basis, we identiied eight variables with a high predictive capacity of pubertal stages, thus conirming the possibility of developing predictive equations using these variables.
Acknowledgements
We thank Coordenação de Aperfeiçoamento de Pessoal de Nível Superior (CAPES) for granting a Master’s fellowship.
REFERENCES
1. Sun SS, Deng X, Sabo R, Carrico R, Schubert CM, Wan W, et al. Secular trends in
body composition for children and young adults: he fels longitudinal study. Am J Hum Biol 2012;24(4):506-14.
2. Bagiu R, Dorotei S, Fira-Mladinescu C, Putnoky S, Petrescu C, Suciu O, et al.
Features of pubertal maturation in adolescents from Timis County. Rev Med Chir Soc Med Nat Iasi 2012;116(1):299-303.
3. Mouritsen A, Aksglaede L, Soerensen K, Hagen CP, Petersen JH, Main KM, et
al. he pubertal transition in 179 healthy Danish children: associations between pubarche, adrenarche, gonadarche, and body composition. Eur J Endocrinol 2013;168(2):129-36.
4. Rege J, Rainey WE. The steroid metabolome of adrenarche. J Endocrinol
2012;214(2):133-43.
5. Boyne MS, hame M, Osmond C, Fraser RA, Gabay L, Reid M, et al. Growth, body
Corresponding author
Radamés Maciel Vítor Medeiros Universidade Federal do Rio Grande do Norte.
Centro de Ciências da Saúde. Departamento de Educação Física. Avenida Salgado Filho, s/ nLagoa Nova59072-900 - Natal, RN, Brasil
E-mail: [email protected]
2012;19(3):197-203.
7. Herman-Giddens ME, Stefes J, Harris D, Slora E, Hussey M, Dowshen SA, et al.
Secondary sexual characteristics in boys: data from the Pediatric Research in Oice Settings Network. Pediatrics 2012;130(5):1058-68.
8. Marshall WA, Tanner JM. Variation in the pattern of pubertal changes in boys.
Arch Dis Child 1970;45:13-23.
9. Zhang Y, Wang S. Secular trends in growth and body proportion among
chil-dren and adolescents from 1985 to 2005 in Shandong, China. Anthropol Sci 2009;117(2):69-76.
10. Nandi AM, Chaudhur ABD. Anthropometric - hormonal correlation: An overview.
J Life Sci 2010;2(2):65-71.
11. Veldre G, Jurimae T. Anthropometric parameters and sexual maturation in 12- to
15-year-old Estonian boys. Anthropol Anz 2004;62(2):203-15.
12. Pérez BM, Vásquez M, Landaeta-Jiménez M, Ramírez G, Macías-Tomei C.
Anthro-pometric characteristics of young venezuelan swimmers by biological maturity status. Rev Bras Cineantropom Desempenho Hum 2006;8(2):13-8.
13. Marfell-Jones M, Olds T, Stewart A, Carter L. International standards for anthro-pometric assessment. Potchefstroom: ISAK; 2006.
14. Martins MO, Lopes MA. Perímetros. In: Petroski EL, editor. Antropometria:
téc-nicas e padronizações. 3ª ed. Blumenau: Nova Letra; 2007. p. 57-69.
15. Tanner J. Growth at adolescent. Oxford: Blackwell Scientiic; 1962.
16. Azevedo JCV, Brasil LMP, Macedo TBMA, Pedrosa LFC, Arrais RF. Comparação
entre avaliação objetiva e autoavaliação da maturação sexual em crianças e ado-lescentes. J Pediatr (Rio J) 2009;85(2):135-42.
17. Hair JF, Anderson RE, Tatham RL, Black WC. Análise multivariada de dados. 5ª
ed. ed. Porto Alegre: Bookman; 2005.
18. Ma HM, Chen SK, Chen RM, Zhu C, Xiong F, Li T, et al. Pubertal development
timing in urban Chinese boys. International Journal of Andrology 2011;34(5 Pt 2):e435-e45.
19. Kryst L, Kowal M, Woronkowicz A, Sobiecki J, Cichocka BA. Secular changes in
height, body weight, body mass index and pubertal development in male children and adolescents in Krakow, Poland. J Biosoc Sci 2012;44(4):495-507.
20. Barbosa KBF, Franceschini SCC, Priore SE. Inluência dos estágios de maturação
sexual no estado nutricional, antropometria e composição corporal de adolescentes. Rev Bras Saúde Matern Infant 2006;6(4):375-82.
21. Krzanowski WJ. Discrimination and classiication using both binary and