Adriano Luiz de Paula* Institute of Aeronautics and Space São José dos Campos, Brazil [email protected]
Mirabel Cerqueira Rezende Institute of Aeronautics and Space São José dos Campos, Brazil [email protected]
Joaquim José Barroso National Institute for Space Research São José dos Campos, Brazil [email protected]
*author for correspondence
Experimental measurements
and numerical simulation of
permittivity and permeability of
Telon in X band
Abstract: Recognizing the importance of an adequate characterization of radar absorbing materials, and consequently their development, the present study aims to contribute for the establishment and validation of experimental determination and numerical simulation of electromagnetic
materials complex permittivity and permeability, using a Telon® sample. The present paper branches out into two related topics. The irst one is
concerned about the implementation of a computational modeling to
predict the behavior of electromagnetic materials in conined environment
by using electromagnetic three-dimensional simulation. The second topic re-examines the Nicolson-Ross-Weir mathematical model to retrieve the constitutive parameters (complex permittivity and permeability) of a
homogeneous sample (Telon®), from scattering coeficient measurements.
The experimental and simulated results show a good convergence that guarantees the application of the used methodologies for the characterization of different radar absorbing materials samples.
Keywords: Electric permittivity, Magnetic permeability, Radar absorbing material, Computational modeling.
INTRODUCTION
Knowledge of complex permittivity, ε*, and permeability,
µ*, of materials proves to be of great interest in scientiic
and industrial applications. The measurement of ε*
and µ* in the microwave frequency range inds direct
application in different areas. the electromagnetic radiation effects on biological systems study in ceramic sintering, plastic welding, and remote sensing (Chung, 2007) can be mentioned as examples. In this latter case, a good understanding of the vegetation dielectric properties is vital to get useful information from the remotely sensed data for earth resources monitoring and management, because the vegetation dielectric constant has a direct effect on radar backscattering measured by microwave sensors. Concerning sectors of electronic, telecommunication, aerospace industries, and in particular in the research and development of radar absorbing materials (RAM), the knowledge of ε* and µ* allows to predict the electromagnetic properties of materials via computer simulation. Thus, the simulation is useful for supporting studies related to the RAM processing optimization, as
well as its utilization for speciic purposes.
Computational modeling becomes relevant as long as the simulated results reproduce and anticipate experimentally
measured data. Strong interrelation between modeling
and experimental contributes to ensure conidence in the
computational tool developed for a given application. A purpose of computer modeling is to reconstruct experimental measurements aiming at understanding and evaluating measured parameters, and also to obtain new parameters in different contexts but consistent with the experimental interpretation. In situations in which
a modal analysis turns out too complex and dificult to solve, numerical methods are widely used, such as inite element method (FEM), inite difference method (FDM),
and particularly specialist tools for three-dimensional electromagnetic simulation in both time and frequency domains on volume and surface meshes, such as the CST Microwave Studio. Particularly, this tool uses, in simulations, the perfect boundary approximation (PBA) and the thin sheet technique (TST) to increase the modeling precision in comparison with the conventional software (Chung, 2001).
The electromagnetic parameters can be deduced from
the scattering parameters (De Paula et al.; ASTM, 2001; Nicolson and Ross, 1970; Weir, 1974; Agilent
Technologies, 1985). For this, the boundaries of the
material under test (MUT) are deined and afterwards the
S parameters can be accurately known. The following equations relate the parameters S11 (scattering parameter related to the radiation emission from port 1 and collect in port 1) and S21 (scattering parameter related to the Received: 06/11/10
Accepted:11/11/10
radiation emission from port 1 and collect in port 2)
(Fig. 1) to the relection and transmission coeficients Γ
and T, respectively. These equations allow to solve the boundary-condition problem at l= 0 (l is the line of air) and l= d (d is the sample thickness) (Fig. 1), such that
the relection coeficient can be expressed as Eq. 1 and 2 (ASTM, 2001; Nicolson and Ross, 1970):
ī=K±¥k2± (1)
where:
{S112(ω) – S 21
2(ω)}+1 2S11(ω)
K = (2)
The transmission coeficient is given by Eq. 3:
{S11(ω) +S21(ω)}–ī 1–{S11(ω) +S21(ω)}ī
T = (3)
From Eq. 1 and 3, auxiliary variables (x and y) are deined
as follows (Eq. 4 to 7) (ASTM, 2001; Nicolson and Ross,
1970):
x= μr 11+ī –ī
r
=
(
(
2
(4)
y= μr .εr
1 T
=
{
(
{ (
2 c
ωdln (5)
μr= x  y (6)
r=
y
x (7)
where,
c
= speed of the light in the free space;μr = relative permeability of material;
Ɛr = relative permittivity of material;
ω = angular speed.
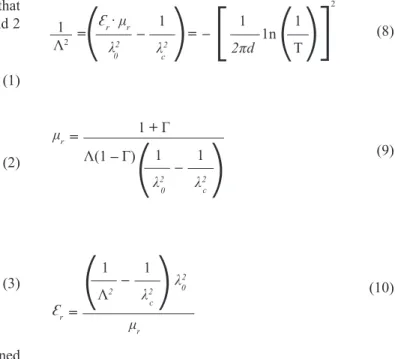
For measurements using a rectangular waveguide sample holder, Eq. 4 and 5 can be rewritten as Eq. 8, 9 and 10
(ASTM, 2001; Nicolson and Ross, 1970):
1
ȁ2 =
(
=(
[
(
(
[
r Âμr 2
0 c
– 1 –
2
1
d
1
T 1n
2
(8)
=
(
1(
2
0 c
– 1
2
μr
ȁ– ī
1 + ī
(9)
=
(
(
1
ȁ2
c
– 1
2
r
μr 0 2
(10)
Where,
λ0 is the free space wavelength and λc the cutoff wavelength
of the guide.
Since the material is a passive medium, the signal of the square root in Eq. 1 is determined by the requirement
that Re(1/Λ)>0. It is also noted that Eq. 9 and 10 can be
applied for measurements using a coaxial sample holder,
for which λc → ∞.
Figure 1: Waveguide illed with material. (Z0 is the impedance
of air, ZS is the impedance of the material, Vn (n= 1,
2, 3…) is the voltage, In (n= 1, 2, 3…) is the intensity, n is the interface between the means, d is the sample thickness and l is the thickness of line of air (ASTM,
2001; Nicolson and Ross, 1970). 2
V
+ 2
V
0
= =d
d
air air
Source Detector
0
Z
0
Z
S
Z
2 2,I
V
3 3,I
V
1 1,I
V
in
V
1
V V3+
Port 1 Port 2
Experimental measurements and numerical simulation of permittivity and permeability of Telon in X band
One methodology that makes use of the scattering parameters S11 and S21 to calculate the mentioned complex
parameters of samples is named Nicolson-Ross-Weir (NRW) (Nicolson and Ross, 1970; Weir, 1974). The NRW
modeling is the most common used method to perform the calculation of complex permittivity and permeability of materials. This modeling has the advantage of being non-interactive (no interactive procedure is needed), as required in the Baker-Jarvis method (Baker-Jarvis et
al., 1993). Besides this, the NRW modeling is applicable
for coaxial line and rectangular waveguide cells. On
the other side, it is known that the NRW can diverge
for low-loss materials at frequencies corresponding to integer multiples of one half wavelength in the sample
(Nicolson and Ross, 1970; Weir, 1974). At this particular
frequency, the magnitude of the measured S11 parameter is particularly smaller (thickness resonance) and the S11 phase uncertainty becomes larger. This behavior can lead to the appearance of inaccuracy peaks on the permittivity and permeability curves.
Considering the knowledge importance on the complex permittivity and permeability of materials aiming the adequate characterization of them and new developments, the present work presents a study involving measured and simulated complex permittivity and permeability of a
Telon® (polydiluoroethylene) test sample with 11.75 mm
thick. Herein, the experimental complex parameters were
retrieved using the NRW modeling. Simulated
frequency-dependent quantities were obtained by CST tool and these results are compared with experimentally measured values
in the 8.2-12.4 GHz frequency range (X-band).
MATERIALS AND METHODS
Experimental Measurements
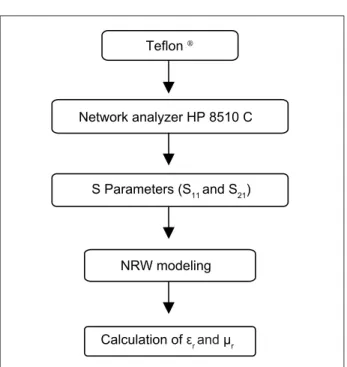
In this study, the experimental methodology was performed according to the steps depicted in Fig. 2. For this, it was assembled a setup including an automatic vector network analyzer (VNA) HP8510C, which was connected as a
source and measurement equipment. During calibration,
standard setup values must be stored, so that when making calibration, the measured and reference values are compared to characterize measurement systematic errors (ASTM, 2001). The calibration also establishes the reference planes for the measurement test ports. Figure 3
shows the calibration X band kit used in this paper.
To determine the complex permittivity and permeability, via S-parameters (S11 and S21), it was used the two-port
transmission/relection approach, with a
material-under-test (Telon® sample with 11.75 mm thick) of smooth lat
faces, and illing completely the ixture cross section,
being placed inside a rectangular waveguide (Fig. 4). The
Figure 2: Flow chart of complex permittivity and permeability experimental measurements.
Teflon ·
NRW modeling Network analyzer HP 8510 C
S Parameters (S11 and S21)
Calculation of İr and ȝr
Figure 3: Waveguide calibration set for X band.
sample holder is a precision waveguide section of 140 mm length, which is provided with the calibration kit.
When measuring the scattering parameters, the offset,
placed between ports 1 and 2, is closed with the sample holder. The adapter of port 1 is taken as the reference plane (Fig. 4).
After the S-parameters measurements, the complex parameters (ε* and µ*) were calculated according to the
NRW modeling, as depicted in Fig. 2.
Numerical Simulations
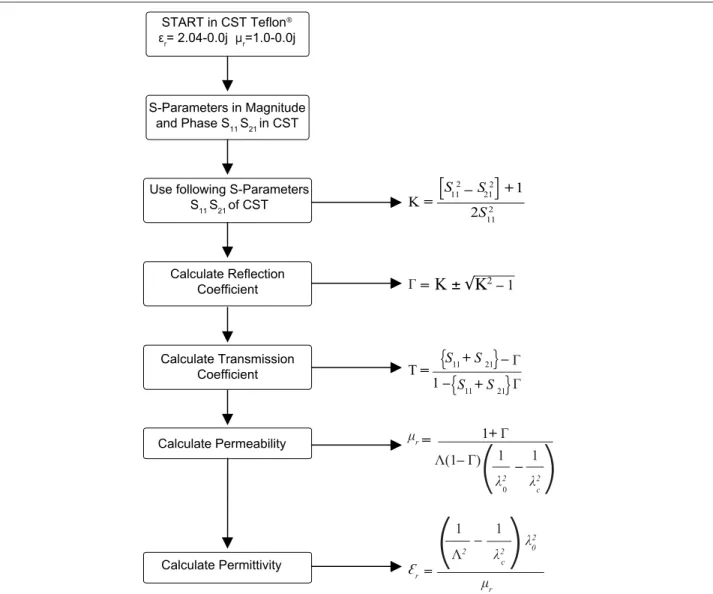
The numerical simulations were carried out according
to low chart presented in Fig. 5. In this case, the
electromagnetic parameters were deduced from a scattering
matrix deined between the sample planes (marked in red),
as shown in Fig. 6. The used complex parameters for the
Telon® sample were based on the literature (ε
r = 2.04-0.0j
and µr = 1.0-0.0j) (ASTM, 2001).
Based on the complex parameters from literature (ASTM,
2001) and on the scattering matrix deined in this study
(Fig. 6), the MS-CST tool was used to simulate the scattering parameters S11 and S21 of the Telon® sample.
Afterwards, from the magnitude and phase values of the simulated parameters, the complex parameters were retrieved according to Fig. 5.
RESULTS AND DISCUSSION
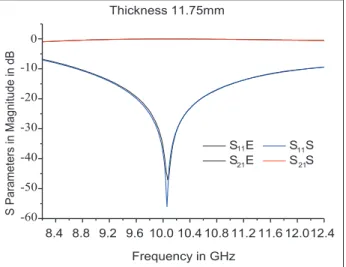
Measured and calculated scattering parameters of a
Telon® test sample with thickness of 11.75 mm are
compared in Figs. 7 and 8. In Fig. 7, the experimental and numerical S21 parameters both coincide and they are near 0 dB level in magnitude. Experimental and numerical S21 parameters related to the inversion of phase also show
Figure 5: Flow chart of the numerical simulation used in the complex permittivity and permeability calculation. START in CST Teflon·
İr= 2.04-0.0j ȝr=1.0-0.0j
S-Parameters in Magnitude and Phase S11 S21 in CST
Use following S-Parameters S11 S21 of CST
Calculate Reflection Coefficient
Calculate Transmission Coefficient
Calculate Permeability
Calculate Permittivity
K=
[
[
S 2 11 S
2 21
– +1
2S2 11
=
ī
K
(3Q
– 1
= ī
ī
T
{
{
{
{
S11 + S 21 –
1 – S11 + S 21
=
μr 1+ ī
ȁ(1– ī
0 c
(
1(
2
1
2
–
=
(
(
1
ȁ2 c
– 1
2 r
μr
Experimental measurements and numerical simulation of permittivity and permeability of Telon in X band
Figure 6: Coniguration modeling of electric and magnetic ields in X band rectangular waveguide. Sample
planes are marked in red line. In the scale: red means a greater interaction of the electrical (A/m scale)
and magnetic (V/m scale) ields with the sample
(material), and green means a lower wave-sample interaction. 1563 1367 1172 977 781 586 391 195 0 V/m 5-9 5-16 4-43 3-69 2-95 2-21 1-48 0-738 0 A/m Sample Sample
a good agreement (Fig. 8). The scattering parameter S11 (experimental and numerical) shows a resonance at the 10.04 GHz frequency (Fig. 7), but it is also observed a slight difference in the maximum amplitude value, in which the simulated S11 resonance presents a higher attenuation value (~-55 dB) than the experimental one (~-45 dB). To understand this difference is important
to mention that the simulation coniguration depicted
in Fig. 6 takes place in an ideal environment, where temperature, humidity, misalignment, and air gap effects are not taken into account.
Figure 7: Experimental and simulated parameters of S11 and
S21 in magnitude of Telon® with 11.75 mm thickness
(E - experimental and S - simulated).
8.4 8.8 9.2 9.6 10.0 10.4 10.8 11.2 11.6 12.012.4
-60 -50 -40 -30 -20 -10 0 S Pa ra me te rs in Ma g n itu d e in d B
Frequency in GHz
S11 E S11 S
S21 E S21 S Thickness 11.75mm
Figure 8: Experimental and simulated parameters of S11 and
S21 in phase of Telon® with 11.75 mm thickness (E -
experimental and S - simulated).
8.4 8.8 9.2 9.6 10.010.410.811.211.612.012.4 -180 -150 -120 -90 -60 -30 0 30 60 90 120 150 180 S Pa ra me te r in Ph a se in D e g re e
Frequency in GHz
S11 E S11 S S21 E S21 S Thickness 11.75mm
Figure 9: Test sample complex permittivity ε* = ε jε :
measured (red curves) and calculated (blue curves)
using the NRW modeling.
8 8.5 9 9.5 10 10.5 11 11.5 12 12.5
-1 -0.5 0 0.5 1 1.5 2 2.5
Frequency in GHz
'
a
n
d
"
' measured " measured ' calculated " calculated
' measured
'' calculated
' calculated
'' measured
Frequency in GHz
8.5 9 9.5 10 10.5 11 11.5 1212.5 8 ' a n d '' -0.5 0.5 -1 1.5 2 2.5 1 0
A careful analysis of Fig. 8 shows that measured and simulated S11 curves in phase present any difference, where the simulated S11 curve bends downward in the frequency range of ~10.1 to ~10.7 GHz. This behavior is attributed to the actual interaction of the electromagnetic wave with the material in phase (Fig. 8), considering that the simulation takes place in an ideal environment, as already mentioned.
Then, based on the NRW procedure, the S-parameters
were used to determine ε* and µ*, which are given in
Figs. 9 and 10, respectively. In a general way, these igures
show that the agreement between measured and simulated quantities is quite satisfactory, except for the calculated
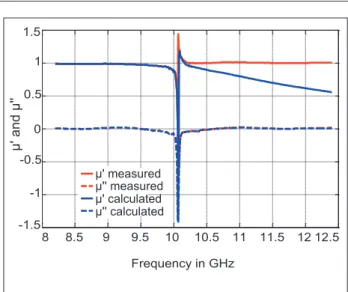
Figure 10: Test sample complex permeability μ* = μʹ - jμʺ: measured (red curves) and calculated (blue curves)
using the NRW modeling.
-1.5 -1 -0.5 0 0.5 1 1.5
+'
a
n
d
+"
+' measured
+" measured
+' calculated
+" calculated
8.5 9 9.5 10 10.5 11 11.5 1212.5 8
Frequency in GHz -1
-0.5
-1.5 0.5 1.5
1
0
µ
'
a
n
d
µ
''
µ' measured
µ'' calculated µ' calculated µ'' measured
the simulated S11 curve, which was observed in Fig. 8 (in the frequency range of ~10.1 – 10.7 GHz), is translated into a decrease of ε'and µ` at higher frequencies (Figs. 9 and 10).
CONCLUSION
The comparative study of the electromagnetic
parameters of a Telon® slab shows a good agreement
between measured and simulated complex permittivity
and permeability, which were retrieved using the NRW
modeling. From these results, it is possible to conclude that the used procedure guarantees an accuracy experimental characterization of materials and their simulation. It was also noted that the tested procedure proved to be robust, and no anomalies were noticed because resonance for the 11.75-mm-thickness sample occurs above 10.04 GHz. This result overcomes a possible disadvantage of
using the NRW modeling, as previously mentioned in
this text.
ACKNOWLEDGMENTS
The authors are thankful to the Aerospace Technology and
Science Department (DCTA, acronym in Portuguese),
Institute of Aeronautics and Space, Financiadora de Estudos e Projetos – FINEP (Project No. 1757/03) and
CNPq (Project no. 305478/2009-5) for the inancial
supports.
REFERENCES
Agilent Technologies, “Measuring the dielectric constant of solids with the HP 8510 network analyzer”, Technical Overview 5954-1535.USA, 10p., 1985.
American Society for Testing and Materials, “ASTM
D5568-1: Standard Test Method for measuring Relative
Complex permittivity and Relative Magnetic Permeability
of Solid Materials at Microwave Frequencies”, West
Conshohoken, PA: ASTM, 2001.
Baker-Jarvis, J., Janezic, M. D., Grasvenor Jr., J. H., and Geyer, R. G., “Transmission/Relection and
Short-Circuit Line of Methods for Measuring Permittivity and Permeability”, NIST Technical Note 1355-R, Colorado, 1993, from http://whites.sdsmt.edu/classes/ee692gwmm/ additional/NIST_Tech_Note_1355-R.pdf.
Chung, B. K., “Dielectric constant measurement for
thin material at microwave frequency”, Progress in Electromagnetics Research,Vol., No. 75, pp. 239-252, 2007.
CST MICROWAVE STUDIO. Version 3 Getting Started, Jan.2001, CST Computer B.-K Chung, “Dielectric
constant measurement for thin material at microwave Simulation Technology”.
De Paula, A. L., Rezende, M. C., Barroso, J. J., Pereira,
J. J. and Nohara E. L., “Comparative Study of S
parameters of the Telon® obtained experimentally and by
Electromagnetic Simulation”, Symposium on Operating
Systems Application Areas of Defense, São José dos
Campos, Brazil, 2008.
Nicolson, A. M., Ross, G. F., “Measurement of the Intrinsic
Properties of Materials by Time Domain Techniques”,
Instrumentantion and Measurement, Vol. 19, pp.377-382, 1970. doi: 10.1109/TIM.1970.4313932
Weir, W.B., “Automatic Measurement of Complex Dielectric Constant and Permeability at Microwave