Auditory vocal analysis and
factors associated with voice
disorders among teachers
Avaliação perceptivo-auditiva e
fatores associados à alteração vocal
em professores
Albanita Gomes da Costa de Ceballos
IFernando Martins Carvalho
IITânia Maria de Araújo
IIIEduardo José Farias Borges dos Reis
III Departamento de Medicina Social da Universidade Federal de Pernambuco.
II Departamento de Medicina Preventiva da Universidade Federal da Bahia.
III Núcleo de Epidemiologia da Universidade Estadual de Feira de Santana.
Correspondência: Albanita Gomes da Costa de Ceballos. Av. Prof. Moraes Rego s/n. Cidade Uni-versitária, Recife, PE CEP 50670-901. E-mail: [email protected]
Abstract
Teachers are professionals who demand much of their voices and, consequently, present a high risk of developing vocal disor-ders during the course of employment. Ob-jective: To identify factors associated with vocal disorders among teachers. Method: An exploratory cross-sectional study, which investigated 476 teachers in primary and secondary schools in the city of Salvador, Bahia. Teachers answered a questionnaire and were submitted to auditory vocal analy-sis. The GRBAS was used for the diagnosis of vocal disorders. Results: The study popula-tion comprised 82.8% women, teachers with an average age of 40.7 years, teachers with higher education (88.4%), with an average workday of 38 hours per week, average 11.5 years of professional practice and average monthly income of R$1.817.18. The pre-valence of voice disorders was 53.6%. (255 teachers). The bivariate analysis showed statistically signiicant associations between vocal disorders and age above 40 years (PR = 1.83; 95% CI; 1.27-2.64), family history of dysphonia (PR = 1.72; 95% CI; 1.06-2.80), over 20 hours of weekly working hours (PR = 1.66; 95% CI; 1.09-2.52) and presence of chalk dust in the classroom (PR = 1.70; 95% CI; 1.14-2.53). Conclusion: The study concluded that teachers, 40 years old and over, with a family history of dysphonia, working over 20 hours weekly, and teaching in classrooms with chalk dust are more likely to develop voice disorders than others.
Resumo
O professor é um profissional que exige muito de sua voz e, consequentemente, apresenta elevado risco de desenvolver alteração vocal durante o exercício do seu trabalho. Objetivo: Identiicar fatores as-sociados à alteração vocal em professores. Método: Estudo exploratório do tipo corte transversal que investigou 476 professores do ensino fundamental e médio de escolas municipais da cidade de Salvador, BA. Os professores responderam a um questionário e foram submetidos à avaliação fonoau-diológica perceptivo-auditiva da voz. Para diagnóstico de alteração vocal utilizou-se a escala GRBAS. Resultados: A população do estudo foi composta por 82,8% de mulheres. Os professores do estudo tinham média de idade igual a 40,7 anos, escolaridade supe-rior (88,4%), jornada de trabalho média de 38 horas semanais, média de 11,5 anos de atuação proissional e renda média mensal de R$ 1.817,18. A prevalência de alteração vocal foi de 53,6% (255 professores). A análise bivariada evidenciou associações estatisticamente signiicantes entre altera-ção vocal e idade maior que 40 anos (RP = 1,83; IC 95%; 1,27-2,64), histórico familiar de disfonia (RP = 1,72; IC 95%; 1,06-2,80), carga horária semanal maior que 20 horas (RP = 1,66; IC 95%; 1,09-2,52) e presença de pó de giz na sala de aula (RP = 1,70; IC 95%; 1,14-2,53). Conclusão: O estudo realizado concluiu que os professores com 40 ou mais anos de idade, com histórico familiar de disfonia, com carga horária semanal maior que 20 horas e que lecionam em salas de aula com pó de giz têm maior chance de ter alteração vocal do que os demais.
Palavras-chave: Saúde do trabalhador. Dis-fonia. Distúrbios da Voz. Educação. Ensino. Docente.
Introduction
The voice is the main form of interaction between the speaker and their listeners. The integration among gestures, body and voice transmits the human emotions and desires. When produced in a complex way, the voice is sensitive to emotional disharmony and organic or functional lack of adjustment of the speech system.
Once the voice is unique to each spe-aker, the conceptualization of vocal quality and normality depends on an individual’s cultural and temporal patterns. If the voice cannot fulill its role of verbal or emotional message transmission, it is said there is a vocal disorder1.
In addition to the vocal demand, socio-demographic, medical and individual factors and certain occupational and work environment characteristics have been described in the literature as factors that contribute to vocal disorder2-9. The teacher
is one of the professionals who most use their voice, because they depend on it in the learning-teaching process, thus ha-ving higher risks of development of such disorders.
Studies conducted in several parts of Brazil, as observed in other countries, have sought to ind the frequency of vocal disorders in teachers. In the city of Belo Horizonte, Minas Gerais, a study evidenced that 61% of teachers reported vocal strain, 56% reported worsening of voice quality and 30% had already been absent from work due to vocal problems10. In the city of Mogi das
Cruzes, São Paulo, a similar study showed that 57% of teachers reported occasional dysphonia, while 15.5% mentioned frequent dysphonia5. In the city of São Paulo, day care
center teachers reported vocal disorders (80%) from a mild to moderate level (74%) during a period equal to or longer than four years (39%)11, and in Vitória da Conquista,
Bahia, 59.2% of teachers mentioned hoarse-ness9. A study 12, which reviewed 15 studies
frequen-tly reported symptoms in epidemiological studies on this theme. With regard to the working conditions of teachers, a review study3 showed that teachers reported high
level of physical effort, exposure to dust or chalk dust, inadequate ventilation, standing for long periods of time, insuficient time to perform activities and studies and accelera-ted pace of work.
In view of the high prevalence of vocal problems in this professional category, as evidenced in the previously mentioned studies, the present study aimed to identify factors associated with vocal disorders in teachers.
Methods
An exploratory cross-sectional study was conducted with primary and secondary teachers of municipal public schools of the city of Salvador, in the state of Bahia, Brazil, between March 2006 and March 2007.
The Secretaria Municipal de Educação e Cultura (SMEC – Municipal Department of Education and Culture) includes 422 pri-mary and secondary schools, distributed in 11 educational areas that cover 139 districts of the city.
As a convenience criterion, sample selection for this study was performed in two stages. First, for operational purposes, the four educational areas selected were those closest to the Hospital Universitário Professor Edgard Santos da Universidade Federal da Bahia (Bahia Federal University Professor Edgard Santos University Hospi-tal). In each area selected, based on a list of professionals per school provided by the SMEC, all schools with 20 or more teachers were chosen. All 24 schools that met these criteria were included in this study. They were spread around 54 districts of the city and included a total of 611 teachers. All teachers from the selected schools were considered eligible for this study and, con-sequently, invited to participate in it.
There were three formal refusals to par-ticipate in the study (0.49%); 25 teachers were on a sick leave during data collection
(4.10%) and 107 teachers were not found in the school after three attempts to contact them, being considered losses in this study (17.51%). The inal sample totaled 476 indi-viduals (77.9% of those initially expected). Data collection was performed in two stages, in the schools selected: questionnai-re application and auditory-vocal analysis. In these two stages, data collection was conducted by two professionals, graduated in Speech Therapy.
The questionnaires used were as follows: the Portuguese version of the Job Content Questionnaire (JCQ), translated by Araujo (1999)13 to observe the perception of social
support, control and demand in the work environment; the Portuguese version of the Medical Outcome Study Question – Social Support Survey (MOS-SSS), translated by Chor et al (2001)14 to observe social support
out of the work environment; and questions about general health, vocal complaints and professional performance, adapted from the instrument developed by Ferreira et al (2007) 15. Questionnaires and the Informed
Consent Form (ICF) were directly delivered to teachers in a sealed envelope. After deli-very, a date was set to return this material. When returned, the envelope with the questionnaires and ICF received a code and the teacher immediately underwent speech therapy analysis. Teachers who reported having a cold/the lu during analysis were excluded from it. Teachers were identiied by their code in the questionnaire during this analysis.
Auditory-vocal analysis was conducted in a classroom, with the lowest level of noise possible. During analysis, a sample of the voice was recorded in a digital recorder, with the use of a dynamic professional mi-crophone for quality control. This quality control consisted in another professional’s analyzing a sample of analyses. The stage of vocal analysis in the school involved the use of the GRBAS scale16, which enables
parameters. These parameters are the following: G= Grade, R= Roughness, B= Breathiness, A= Astheny and S= Strain. The G parameter was used to characterize the presence of vocal disorder in this study, representing the speech therapists’ general impression of the vocal quality of teachers, as they conducted the analysis. According to this analysis, teachers were considered “without vocal disorder” (G=0) or “with vocal disorder” (G≠0). The speech material
used was the expiratory phonation of the sustained vowel /e/, the connected speech of the months of the year and counting from 1 to 20.
Parameters of analysis for the JCQ were proposed by its authors13. The cut-off point
of the MOS-SSS was defined in tertiles, according to the variation in score possible in the test17.
Double data entry was performed in the SPSS software, version 9.0. Bivariate data analysis was made in the Stata software, version 9.0. First, descriptive analysis of variables was performed, followed by bi-variate analysis, when the prevalence ratio and conidence interval (α=5%) for the
asso-ciation between the vocal disorder variable and the predictive variables were calculated. The predictive variables were divided into groups of socio-demographic variables, behavioral variables, organizational varia-bles, work environment-related variavaria-bles, violent situation/indiscipline-related va-riables, medical condition variables and descriptive variables of vocal abuse.
Taking into consideration the fact that this study had an exploratory nature, where no hypotheses are tested and no main as-sociation is analyzed, multivariate analysis processes were found to be unnecessary.
The research project that originated this study did not result in conlict of in-terests and it was approved by the Bahia Federal University Professor Edgard Santos University Hospital Ethics Committee. All participants signed an informed consent form, according to the Conselho Nacional de Saúde/Ministério de Saúde’s (Brazilian Health Ministry/National Health Council)
Resolution 196 of 10/10/1996. At the end of the study, each participating teacher received a report on their analysis and was informed about services for speech therapy and otorhinolaryngological care.
Results
The population studied was comprised of teachers, most of whom were females (82.8%), with a mean age of 40.7 years and a higher education level (88.4%). The mean monthly income reported was R$ 1,817.18 (US$ 780.00) mean weekly number of working hours was 38.23 hours and mean length of time working as teacher was 11.5 years.
Prevalence of vocal disorder in the 476 teachers studied was 53.6% (n=255).
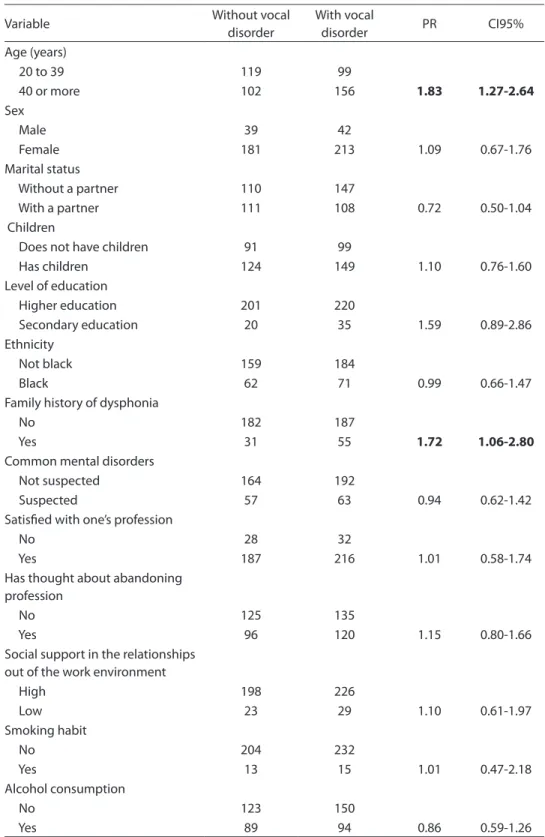
Table 1 shows the description of the study population, according to vocal disor-der. The same table shows the prevalence ratio (PR) and conidence intervals (CI) for the socio-demographic variables and vocal disorder. There was a positive and statisti-cally signiicant association between age (PR=1.83 CI95% 1.27-2.64)/family history of dysphonia (PR=1.72 CI95% 1.06-2.80) and vocal disorder. The “social support out of the work environment” variable, resulting from the MOS-SSS, did not have a statisti-cally signiicant association with the “vocal disorder” outcome.
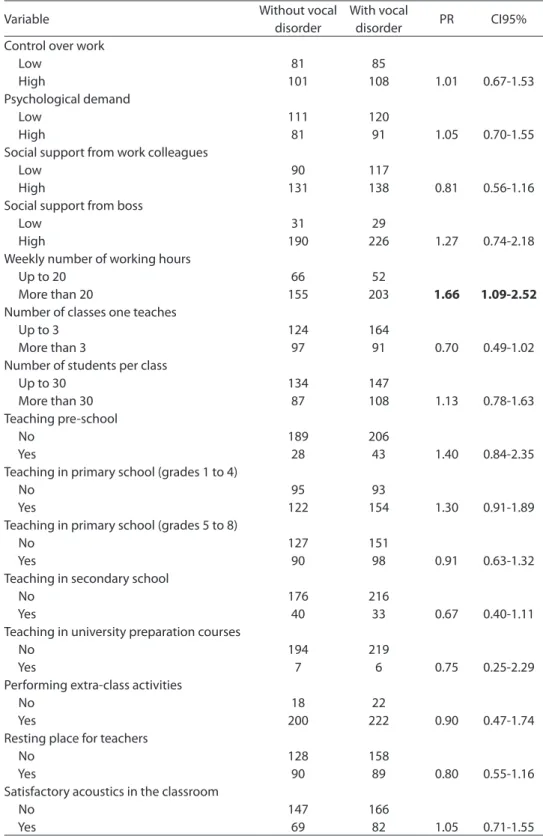
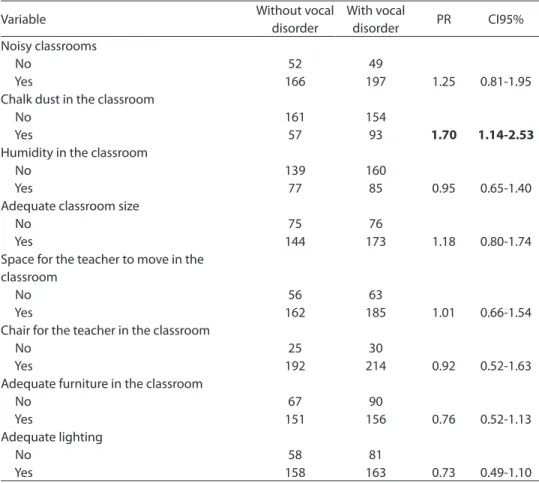
Table 2 shows the result of the investiga-tion of the associainvestiga-tion between the teachers’ work environment and organization charac-teristics and vocal disorder, where it can be observed that the “weekly working hours” (PR=1.66 CI95% 1.09-2.52) and “chalk dust in the classroom” variables (PR=1.70 CI95% 1.14-2.53) are associated with vocal disorder in a positive and statistically signiicant way, unlike the association with the variables originated from the JCQ: control, demand, social support from work colleagues, and social support from the boss.
Table 1 - Description of population, prevalence ratio (PR) and respective 95% Conidence Intervals (95% CI) for voice disorders according to sociodemographic and behavioral characteristics of teachers from the City of Salvador, Brazil, 2007.
Tabela 1 - Descrição da população, razões de prevalência (RP) e respectivos intervalos de coniança (IC 95%) para alteração vocal segundo variáveis sociodemográicas e comportamentais em professores de Salvador, Bahia, 2007.
Variable Without vocal
disorder
With vocal
disorder PR CI95%
Age (years)
20 to 39 119 99
40 or more 102 156 1.83 1.27-2.64
Sex
Male 39 42
Female 181 213 1.09 0.67-1.76
Marital status
Without a partner 110 147
With a partner 111 108 0.72 0.50-1.04
Children
Does not have children 91 99
Has children 124 149 1.10 0.76-1.60
Level of education
Higher education 201 220
Secondary education 20 35 1.59 0.89-2.86
Ethnicity
Not black 159 184
Black 62 71 0.99 0.66-1.47
Family history of dysphonia
No 182 187
Yes 31 55 1.72 1.06-2.80
Common mental disorders
Not suspected 164 192
Suspected 57 63 0.94 0.62-1.42
Satisied with one’s profession
No 28 32
Yes 187 216 1.01 0.58-1.74
Has thought about abandoning profession
No 125 135
Yes 96 120 1.15 0.80-1.66
Social support in the relationships out of the work environment
High 198 226
Low 23 29 1.10 0.61-1.97
Smoking habit
No 204 232
Yes 13 15 1.01 0.47-2.18
Alcohol consumption
No 123 150
Table 2 - Description of population, prevalence ratio (PR) and respective 95% Conidence Intervals (95% CI) for voice disorders according to work organization and environmental variables of teachers from the City of Salvador, Brazil, 2007.
Tabela 2 - Descrição da população, razões de prevalência (RP) e respectivos intervalos de coniança (IC 95%) para alteração vocal segundo variáveis organizacionais e do ambiente de trabalho em professores de Salvador, Bahia, 2007.
Variable Without vocal
disorder
With vocal
disorder PR CI95%
Control over work
Low 81 85
High 101 108 1.01 0.67-1.53
Psychological demand
Low 111 120
High 81 91 1.05 0.70-1.55
Social support from work colleagues
Low 90 117
High 131 138 0.81 0.56-1.16
Social support from boss
Low 31 29
High 190 226 1.27 0.74-2.18
Weekly number of working hours
Up to 20 66 52
More than 20 155 203 1.66 1.09-2.52
Number of classes one teaches
Up to 3 124 164
More than 3 97 91 0.70 0.49-1.02
Number of students per class
Up to 30 134 147
More than 30 87 108 1.13 0.78-1.63
Teaching pre-school
No 189 206
Yes 28 43 1.40 0.84-2.35
Teaching in primary school (grades 1 to 4)
No 95 93
Yes 122 154 1.30 0.91-1.89
Teaching in primary school (grades 5 to 8)
No 127 151
Yes 90 98 0.91 0.63-1.32
Teaching in secondary school
No 176 216
Yes 40 33 0.67 0.40-1.11
Teaching in university preparation courses
No 194 219
Yes 7 6 0.75 0.25-2.29
Performing extra-class activities
No 18 22
Yes 200 222 0.90 0.47-1.74
Resting place for teachers
No 128 158
Yes 90 89 0.80 0.55-1.16
Satisfactory acoustics in the classroom
No 147 166
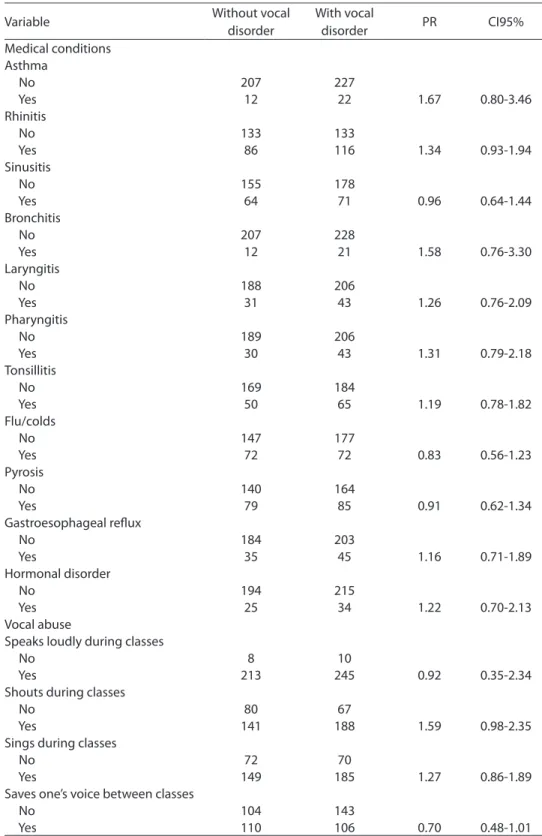
with the variables related to medical condi-tions and vocal abuse of teachers (Table 4).
Discussion
Several factors pose a risk to teachers’ vocal health. These professionals use their voice to inluence, to convince, to give em-phasis and to pass on knowledge. Changes in the teacher’s voice can lead to stress and frustration, negatively affect their ability to teach and cause social and economic losses2.
The present study found a prevalence of 53.6% of vocal disorders in teachers,
according to the auditory-vocal analysis performed by speech therapists, a lower result than that found by Simões and La-torre, who observed 79.6% of change in the voice quality of the teachers studied.11 Other
studies based on the reports of participants showed data that were similar to those of Araújo et al 9, who found a prevalence of
59.2%, and those of Fuess and Lorenz 5, with
57%. The similarity of results, in contrast to the difference in methods, can indicate that teachers are aware of their vocal problem, as shown in a study conducted by Simões and Latorre11.
By analyzing the association between
Variable Without vocal
disorder
With vocal
disorder PR CI95%
Noisy classrooms
No 52 49
Yes 166 197 1.25 0.81-1.95
Chalk dust in the classroom
No 161 154
Yes 57 93 1.70 1.14-2.53
Humidity in the classroom
No 139 160
Yes 77 85 0.95 0.65-1.40
Adequate classroom size
No 75 76
Yes 144 173 1.18 0.80-1.74
Space for the teacher to move in the classroom
No 56 63
Yes 162 185 1.01 0.66-1.54
Chair for the teacher in the classroom
No 25 30
Yes 192 214 0.92 0.52-1.63
Adequate furniture in the classroom
No 67 90
Yes 151 156 0.76 0.52-1.13
Adequate lighting
No 58 81
Yes 158 163 0.73 0.49-1.10
The variable “microphone available in the classroom” was excluded from the analysis, due to very low frequency of positive responses (0.6%). Foi excluída da análise a variável “Dispõe de microfone na sala de aula” devido à quase ausência de respostas positivas (0,6%).
Table 2 - Description of population, prevalence ratio (PR) and respective 95% Conidence Intervals (95% CI) for voice disorders according to work organization and environmental variables of teachers from the City of Salvador, Brazil, 2007. (cont.)
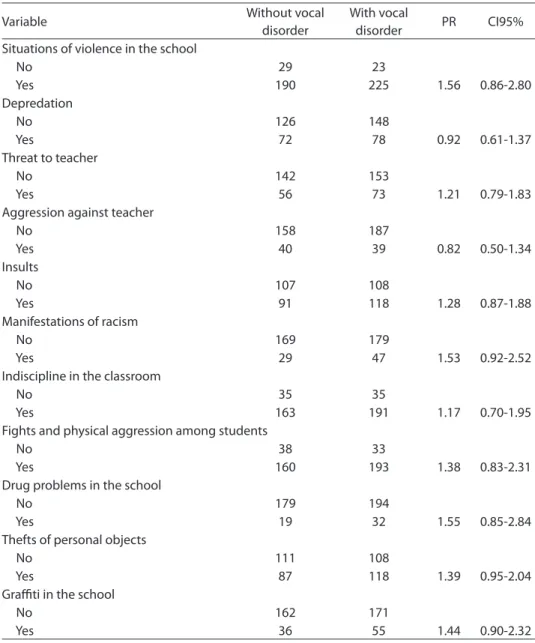
Table 3 - Description of population, prevalence ratio (PR) and respective 95% Conidence Intervals (95% CI) for voice disorders according to stress-producing events among teachers from the City of Salvador, Brazil, 2007.
Tabela 3- Descrição da população, razões de prevalência (RP) e respectivos intervalos de coniança (IC 95%) para disfonia segundo aspectos relativos a situações de violência/indisciplina em
professores de Salvador, Bahia, 2007.
Variable Without vocal
disorder
With vocal
disorder PR CI95%
Situations of violence in the school
No 29 23
Yes 190 225 1.56 0.86-2.80
Depredation
No 126 148
Yes 72 78 0.92 0.61-1.37
Threat to teacher
No 142 153
Yes 56 73 1.21 0.79-1.83
Aggression against teacher
No 158 187
Yes 40 39 0.82 0.50-1.34
Insults
No 107 108
Yes 91 118 1.28 0.87-1.88
Manifestations of racism
No 169 179
Yes 29 47 1.53 0.92-2.52
Indiscipline in the classroom
No 35 35
Yes 163 191 1.17 0.70-1.95
Fights and physical aggression among students
No 38 33
Yes 160 193 1.38 0.83-2.31
Drug problems in the school
No 179 194
Yes 19 32 1.55 0.85-2.84
Thefts of personal objects
No 111 108
Yes 87 118 1.39 0.95-2.04
Graiti in the school
No 162 171
Yes 36 55 1.44 0.90-2.32
factors of several natures and vocal disor-ders, the present study found that being aged 40 years or more (PR=1.83 CI95% 1.27-2.64), having a family history of dysphonia (PR=1.72 CI95% 1.06-2.80), working more than 20 hours per week (PR=1.66 CI95% 1.09-2.52) and teaching in classrooms with the presence of chalk dust (PR=1.70 CI95% 1.14-2.53) are associated with vocal
disorders in a positive and statistically sig-niicant way.
The association between age and vo-cal disorders is not supported by studies conducted by Fuess and Lorenz 5, Simões 18 and Alves 19. These three studies, among
Table 4 - Description of population, prevalence ratio (PR) and respective 95% Conidence Intervals (95% CI) for voice disorders according to variables related to recurrent medical conditions and vocal abuse among teachers from the City of Salvador, Brazil, 2007.
Tabela 4 - Descrição da população, razões de prevalência (RP) e respectivos intervalos de coniança (IC 95%) para a alteração vocal segundo variáveis relacionadas a condições médicas recorrentes e abuso vocal em professores de Salvador, Bahia, 2007.
Variable Without vocal
disorder
With vocal
disorder PR CI95%
Medical conditions Asthma
No 207 227
Yes 12 22 1.67 0.80-3.46
Rhinitis
No 133 133
Yes 86 116 1.34 0.93-1.94
Sinusitis
No 155 178
Yes 64 71 0.96 0.64-1.44
Bronchitis
No 207 228
Yes 12 21 1.58 0.76-3.30
Laryngitis
No 188 206
Yes 31 43 1.26 0.76-2.09
Pharyngitis
No 189 206
Yes 30 43 1.31 0.79-2.18
Tonsillitis
No 169 184
Yes 50 65 1.19 0.78-1.82
Flu/colds
No 147 177
Yes 72 72 0.83 0.56-1.23
Pyrosis
No 140 164
Yes 79 85 0.91 0.62-1.34
Gastroesophageal relux
No 184 203
Yes 35 45 1.16 0.71-1.89
Hormonal disorder
No 194 215
Yes 25 34 1.22 0.70-2.13
Vocal abuse
Speaks loudly during classes
No 8 10
Yes 213 245 0.92 0.35-2.34
Shouts during classes
No 80 67
Yes 141 188 1.59 0.98-2.35
Sings during classes
No 72 70
Yes 149 185 1.27 0.86-1.89
Saves one’s voice between classes
No 104 143
to harmful factors for voice health could be hypothesized to explain the association found in this study.
The association between family history of dysphonia and vocal disorder in teachers is not clear in the literature. Although there may be cases of hereditary malformation of the laryngeal structure that compromise voice quality, it is believed that the associa-tion found in the present study is mostly due to individuals’ emotional and relational aspects and factors in the domestic envi-ronment. In other words, the same social (speaking loudly, shouting, clearing the throat, frequently drinking cold beverages etc.) and physical environments (allergens and others), which cause a family member’s vocal disorder, can contribute to teachers’ vocal disorders.
The association between the number of working hours and vocal disorders is in agreement with a study conducted by Fuess and Lorenz5 and another by Provenzano and
Sampaio20. In the latter, the authors pointed
out that 78% of teachers going on sick leaves in the state of Rio de Janeiro work 40 hours per week or more. The association analyzed can be explained, considering the fact that the higher the number of working hours, the
greater the use of one’s voice and the resul-ting strain, which may cause vocal fatigue21.
With regard to the teachers’ work en-vironment, the association between chalk dust and voice disorders was also mentio-ned in a study conducted by Silvany Neto et al 22. Such association can be explained by
nasal and laryngeal mucosa irritation due to inhalation of chalk dust.
Although the present study have limi-tations, such as the cross-sectional design of the data collection method and the lack of acoustic treatment in the environment where teachers’ voice quality assessment was performed, it can be concluded that voice disorders are multi-causal in terms of their etiology and that factors out of the work environment contribute to the onset or aggravation of such disorders.
Conclusion
The present study concluded that tea-chers aged 40 years or more, with a family history of dysphonia, working more than 20 hours per week and teaching in class-rooms with the presence of chalk dust have a higher risk of developing vocal disorders than others.
Referências
1. Behlau MS (Org.). Voz – o livro do especialista. Rio de
Janeiro: Revinter; 2001.
2. Servilha EAM, Ruela IS.Riscos ocupacionais à saúde e voz de professores: especiicidades das unidades de rede
municipal de ensino. Rev CEFAC 2010; 12(1): 109-14.
3. Araújo TM, Carvalho FM. Condições de trabalho docente e saúde na Bahia: estudos epidemiológicos.
Educ Soc 2009; 30(107): 427-49.
4. Roy N , Merrill RM, Thibeault S, Gray SD, Smith EM. Voice disorders in teachers and the general population: effects on work performance, attendance, and future career
choices. J Speech Lang Hear Res 2004; 47(3): 542-51.
5. Fuess VLR, Lorenz MC. Disfonia em professores do
ensino municipal: prevalência e fatores de risco. Rev
Bras Otorrinolaringol 2003; 69: 807-12.
6. Mattiske JA, Oates JM, Greenwood KM. Vocal problems among teachers: a review of prevalence, causes,
prevention and treatment. J Voice 1998; 12(4): 489-99.
7. Preciado J, Perez C, Calzada M, Preciado P. Frequency and risk factors of voice disorders among teaching staff of La Rioja, Spain. Clinical study: questionnaire, function vocal examination, acoustic analysis and
videolaryngostroboscopy. Acta Otorrinolaringol Esp
2005; 56(4): 161-70.
8. Kotby MN, Baraka M, Sady-Ghanen M, Shoeib R.
Psychogenic stress as a possible etiological factor in non-organic dysphonia. International Congress Series. XVII World Congress of the International Federation of Oto-Rhino-Laryngological Societies (IFOS). 2003; 1240: 1251-56.
9. Araújo TM, Reis EJFB, Carvalho FM, Porto LA, Reis IC, Andrade JM. Fatores associados a alterações vocais em
10. Jardim R, Barreto SM, Assunção AA. Condições de trabalho, qualidade de vida e disfonia entre docentes.
Cad Saúde Pública 2007; 23(10): 2439-61.
11. Simões M, Latorre MRDO. Prevalência de alteração vocal
em educadoras e sua relação com a auto-percepção. Rev
Saúde Pública 2006; 40(6): 1013-18
12. Jardim R, Barreto SM, Assunção AA. Disfonia: Deinição
de caso e prevalência em professores. Rev Bras
Epidemiol 2007, 10(4): 625-36.
13. Araújo TM. Distúrbios psíquicos menores em mulheres
trabalhadoras [tese de doutorado]. Bahia: Instituto de Saúde Coletiva da Universidade Federal da Bahia; 1999.
14. Chor D, Griep RH, Lopes CS, Faerstein E. Medidas de rede e apoio social no estudo pró-saúde: Pré teste e
estudo piloto. Cad Saúde Pública 2001, 17(4): 887-96.
15. Ferreira LP, Giannini SPP, Latorre MRDO, Zenari MS. Distúrbio da voz relacionado ao trabalho: Proposta de
um instrumento para avaliação de professores. Rev
Distúrbios da Comunicação 2007, 19(1): 127-36.
16. Hirano M. Clinical examination of voice. New York:
Springer-Verlag; 1981.
17. Costa AG, Ludermir AB. Transtornos mentais comuns e apoio social: estudo em comunidade rural da Zona da
Mata de Pernambuco, Brasil. Cad Saúde Pública 2005,
21(1): 73-9.
18. Simões M. Prevalência de disfonia e seus fatores
associados em educadores de creche [dissertação de mestrado]. São Paulo: Faculdade de Saúde Pública da Universidade de São Paulo; 2001.
19. Alves LP, Araújo LTR, Xavier Neto JA. Prevalência de queixas vocais e estudo de fatores associados em uma amostra de professores do ensino fundamental em
Maceió, Alagoas, Brasil. Rev Bras Saúde Ocup 2010;
35(121): 168-75.
20. Provenzano LCFA, Sampaio TMM. Prevalência de disfonia em professores do ensino público estadual
afastados de sala de aula. Rev CEFAC 2010; 12(1): 97-108
21. Rantala L, Vilkman E, Bloigu R. Voice changes during work: subjective complaints and objective measurements for female primary and secondary
schoolteachers. Journal of voice 2002; 16(3): 344-55.
22. Silvany Neto AM, Araújo TM, Dutra F, Azi G, Alves R, Kavalkievcz C et al. Condições de trabalho e saúde de professores da rede particular de ensino de Salvador,
Bahia. Rev Baiana Saúde Pública 2000; 24: 42-56.