Malnutrition among children
under 60 months of age in two
cities of the state of Acre, Brazil:
prevalence and associated
factors
Desnutrição em crianças menores
de 60 meses em dois municípios no
Estado do Acre: prevalência e fatores
associados
Orivaldo Florencio de Souza
I,IIMaria Helena D’Aquino Benício
ITeresa Gontijo de Castro
IIIPascoal Torres Muniz
IIMarly Augusto Cardoso
II Departamento de Nutrição da Faculdade de Saúde Pública da Universidade de
São Paulo (USP), São Paulo.
II Centro de Ciências da Saúde da Universidade Federal do Acre, Rio Branco,
Acre.
III Departamento de Enfermagem Materno Infantil e Saúde Pública da Escola
de Enfermagem, Universidade Federal de Minas Gerais, Belo Horizonte, Minas Gerais.
The present article was based on the doctoral thesis by Orivaldo F.S., presented to the Universidade de São Paulo, Postgraduate Program in Public Health, in the area of Nutrition, in 2009.
Research funding: This research project was funded by the Conselho Nacional de Desenvolvimento Cientiico e Tecnológico (CNPq – National Council for Scientiic and Technological Development – Process: 502937/2003-3 and 551359/2001-3). Orivaldo F.S. was awarded a doctoral scholarship by the CNPq.
Corresponding author: Orivaldo Florencio de Souza - Universidade Federal do Acre – Centro de Ciências da Saúde e do Desporto, Campus Universitário, BR 364, km 4, Rio Branco – AC, Brazil – 69915-900. E-mail: [email protected]
Abstract
Objective: To investigate the prevalence of malnutrition and associated factors in children under the age of 60 months in two cities in the state of Acre, Brazil. Methods:
A population-based cross-sectional study was carried out with 667 children living in urban areas of the cities of Acrelândia and Assis Brasil. The prevalence of malnutrition was calculated by height for age (stunt-ing) and weight for height (W/H) indexes, which were calculated with a cutoff point of -2 for Z scores as determined by the 2006 World Health Organization child growth standards. A structured questionnaire was used to gather information on socioeco-nomic conditions, access to services and child care, birth weight and morbidity. Poisson regression was used to identify the factors associated with child malnutrition.
Results: The prevalence of height-for-age and weight-for-height deficit was 9.9% and 4.1%, respectively. The factors associated with height-for-age deficit were low house-hold wealth index (prevalence ratio [PR]: 1.74; 95% confidence interval [95% CI]: 0.95 – 3.18); having an illiterate father or stepfa-ther (PR: 1.82; 95% CI: 1.01 – 3.27); having 2 or more younger siblings (PR: 2.88; 95% CI: 1.45 – 5.72); biological mother not living in the home (PR: 2.63; 95% CI: 1.32 – 5.24); and exposure to open wastewater near the home environment (PR: 2.46; 95% CI: 1.51 – 4.00). “Low weight at birth” was the only factor associated with weight-for-height deficit (PR: 2.91; CI95%: 1.16-7.24). Conclu-sions: In the cities studied, malnutrition in children under 60 months is an important public health problem, and is associated with indicators of social inequality, access to health services and biological mother not living in the home.
Resumo
Objetivo: Investigar a prevalência da des-nutrição e fatores associados em crianças menores de 60 meses em dois municípios do Estado do Acre. Métodos: Estudo trans-versal de base populacional realizado com 667 crianças da área urbana dos municípios de Acrelândia e Assis Brasil. A prevalência da desnutrição foi calculada pelo padrão de crescimento da Organização Mundial da Saúde de 2006, com o ponto de corte -2 escores Z. Informações sobre condições socioeconômicas, acesso aos serviços e cuidado da criança, peso ao nascer e mor-bidade foram obtidas por questionário estruturado. A regressão de Poisson foi uti-lizada para identificar os fatores associados à desnutrição de crianças. Resultados: A prevalência do déficit estatura para idade e déficit peso para estatura foi de 9,9% e 4,1%, respectivamente. Os fatores associados ao déficit estatura para idade foram o baixo índice de riqueza (razão de prevalência [RP]: 1,74; intervalo de confiança em 95% [IC95%]: 0,95 - 3,18), analfabetismo do pai ou padrasto (RP: 1,82; IC95%: 1,01 - 3,27), ter 2 ou mais irmãos menores (RP: 2,88; IC95%: 1,45 - 5,72), ausência da mãe biológica no domicílio (RP: 2,63; IC95%: 1,32 - 5,24) e exposição ao esgoto a céu aberto no âmbito domiciliar (RP: 2,46; IC95%: 1,51 - 4,00). Somente o baixo peso ao nascer mostrou--se como fator associado ao déficit peso para estatura (RP: 2,91; IC95%: 1,16 - 7,24).
Conclusões: Nos municípios estudados, a desnutrição em crianças menores de 60 meses apresenta-se como um importante problema de saúde pública, associado aos indicadores de iniquidades sociais, acesso aos serviços de saúde e ausência da mãe no domicílio.
Palavras-chave: Desnutrição. Saúde da criança. Estado nutricional. Estudos trans-versais. Antropometria. Epidemiologia nutricional.
Introduction
A substantial decrease in malnutrition was observed in recent decades in Brazilian children younger than five years1,2. However,
regional inequalities still exist. The 2006
Pesquisa Nacional de Demografia e Saúde
(PNDS – National Demographic and Health Survey) revealed that the Northern region of Brazil maintained double the prevalence of height and weight deficit, compared to the Brazilian average3. This situation in
North-ern Brazil is an indication of the vulner-ability of children to conditions of poverty, household food insecurity and poor access to health services4,5,6. In this sense, these
indicators suggest an unsatisfactory situa-tion that does not enable child malnutrisitua-tion to decrease. Due to the lack of population-based studies in the Northern region, little is known about the determinants of child health profile in different contexts, which can be different from those observed in other Brazilian regions.
Public policies to prevent and reduce child malnutrition must be developed con-sidering regional characteristics. However, in the state of Acre, there are few population-based studies on factors associated with child malnutrition that can help to design and adapt public policies aimed at improv-ing child nutritional status. This information is key to develop and implement programs aimed at family empowerment, thus pro-moting health in the family context with an impact on child malnutrition prevention.
As a result, the present study aimed to investigate the prevalence of malnutrition in children younger than 60 months and associated factors, in two cities of the state of Acre.
Methods
based on records of the Programa de Saúde da Família (PSF – Family Health Program), conducted in December 2002 and with a full coverage of all families living in the urban area of both cities, there were 334 homes in Acrelândia and 157 homes in Assis Brasil, totaling 724 children. These children were located using the PSF census records of both cities studied. In 2002, there were only PSF clinics in urban areas and, due to difficul-ties in logistics and access, the rural areas were not included in the present survey. The exclusion criterion was the presence of any diseases that prevented anthropometric measurement.
Data collection occurred during Janu-ary 2003. The field team was comprised of community health agents, undergraduate nursing students of the Universidade Federal do Acre and postgraduate students of the
Universidade de São Paulo, trained and su-pervised locally by project team researchers. During home visits, interviewers introduced themselves, explained the objectives and benefits of the study and requested that an informed consent form be signed by the par-ents or those responsible for the children, guaranteeing anonymity of information.
The present study was approved by the Human Research Ethics Committee of the
Faculdade de Saúde Pública da Universi-dade de São Paulo (Research Protocol 810). Children diagnosed with parasite infection and anemia in this study received adequate drug treatments, prescribed by the project’s medical team.
The following information was obtained from the structured questionnaire, applied to parents or those responsible for the chil-dren in the home interviews: demographic characteristics (sex and age of children), household goods, number of younger sib-lings, biological parents’ residence status in the home, father’s or stepfather’s level of literacy, presence of open sewage in the home environment, type of water supply in the home, weight at birth (obtained from the child health report card), mater-nal reproductive history, characteristics at birth, maternal breastfeeding and previous
morbidities. Diarrhea was defined as the frequent passage or loss of liquid feces in the 15 days prior to interview. The household wealth index was calculated (in Z-scores) to evaluate the socioeconomic level of families, based on the presence of household goods and appliances in the homes (television, sound system, VCR, stove, fridge, radio, tele-phone, bicycle, electric iron, blender, car, couch, washing machine and satellite dish antenna), according to what had been de-scribed in previous studies7,8. In brief, scores
originated from main component analysis were added, using household goods as the basis for the calculation and estimating the household wealth index, as recommended by Filmer & Pritchett9.
Peripheral blood samples of children aged between 6 and 60 months were col-lected with a portable hemoglobinometer (Hemocue®, Ängelhom, Sweden) to
quan-tify hemoglobin concentration. Anemia cases were defined by values lower than 11.0g/100ml, as established by the World Health Organization (WHO)10.
Weight and height measurements of children aged two years or more were taken. Weight was measured with a portable electronic scale (Plenna, USA) with a 150kg capacity and 100g accuracy. Height was measured using a stadiometer with a 0.1cm accuracy. Children younger than two years had their weight and height measured with a digital pediatric scale, with a 16kg capacity and 10g accuracy (Soehnle, Germany) and a child anthropometer (0.1cm accuracy), re-spectively. anthropometric measurements were obtained in duplicate by research team nutritionists (TGC and PTM), using the mean between two measurements, observed according to the procedures rec-ommended by the WHO11. With the help of
the WHO Anthro 2005 software, Z-scores of the height-for-age and weight-for-height indices were obtained from the WHO’s 2006 child growth standard12. A cut-off point
equal to or lower than a Z-score of –2 was used to determine nutritional deficits11.
excluded from data analysis, as recom-mended by the WHO12.
Data were typed into the Epi-Info soft-ware program, version 6.01, following the double-entry procedure. After this pro-cess, data were transferred to the StataTM
statistical software program, version 9.2, for statistical analysis. Chi-square test for homogeneity was used to compare propor-tions (p<0.05).
Factors associated with child malnutri-tion were identified in two stages. In the initial analysis, independent variables as-sociated with nutritional deficits with a p value<0.20 (chi-square test for homogeneity and linear trend) were selected to comprise the multiple models. In the second stage, the factors associated with height-for-age and weight-for-height deficits were identi-fied with hierarchical and multiple Poisson regression analysis (robust standard error), using a conceptual model and procedures adapted from previous publications13,14, 15:
• 1st block: city of residence and demogra-phic characteristics (“city”, “child sex”, and “child age” variables);
• 2nd block: socioeconomic characteristics (“household wealth index”, “father’s or stepfather’s level of literacy” variables); • 3rd block: access to child care and ser-vices (“living with biological parents”, “having younger siblings”, “open sewa-ge” and “water supply” variables); • 4th block: birth characteristics (“weight
at birth” variable);
• 5th block: morbidities (“anemia” and “diarrhea in the 15 days prior to inter-view” variables).
Multiple model analysis began from the distal block to the proximal block. Child sex and age were included into the first block and remained in the subsequent stages. All variables selected in the first stage were included inside each block. Variables with a p value<0.05 using the Wald test or linear trend were selected as a factor associated with nutritional deficits, remaining in the multiple models in the analyses of subse-quent blocks. Variables with a p value>0.05 were excluded from the model and
chan-ges higher than 10% in the magnitude of prevalence ratios of variables remaining in the model were evaluated. In cases of occurrence of changes in prevalence ratio higher than 10% in the variables remaining in the model, the variable was reinserted and maintained in the multiple models of subsequent blocks.
Results
Of all 720 children younger than 60 mon-ths, whose parents agreed to participate in the study (99.4% of those eligible), 677 completed the physical exam. Of these, 10 children were excluded because they had Z-score values lower than -6 or higher than +6 for the anthropometric indices evalu-ated. Thus, 667 children were considered in this analysis, corresponding to 92.2% of all eligible children in this study. Of all 667 children, 329 (49.3%) were males and 338 (50.7%) were females. With regard to age, 246 (36.9%) were aged between 0 and 23 months and 421 (63.1%), between 24 and 60 months.
height-Table 1 - Distribution of children under 60 months by municipality of residence, socioeconomic conditions, access to services and child care, birth weight and morbidity. Assis Brasil and Acrelândia, AC, 2003.
Tabela 1 – Distribuição das crianças menores de 60 meses segundo município de residência, condições socioeconômicas, acesso aos serviços e cuidado da criança, peso ao nascer e morbidades. Assis Brasil e Acrelândia, AC, 2003.
n %
City
Assis Brasil 197 29.5
Acrelândia 470 70.5
Household wealth index
3rd third (high) 226 34.2
2nd third 213 32.3
1st third (low) 221 33.5
Father’s or stepfather’s level of literacy
Literate 552 89.5
Illiterate 65 10.5
Living with the biological parents
Living with the biological mother and father 465 69.7
Living only with the biological mother 151 22.6
Biological mother not living in the home 51 7.7
Younger siblings
No younger sibling 300 45.4
1 younger sibling 273 41.4
2 or more younger siblings 87 13.2
Open sewage
Absent 507 77.3
Present 149 22.7
Water supply
Public network 402 60.9
Other sources (water well, river or dam) 258 39.1
Weight at birth
Higher than 2,500 g 566 91.3
Equal to or lower than 2,500 g 54 8.7
Anemia
Absent 433 71.0
Present 177 29.0
Diarrhea in the 15 days prior to interview
Absent 466 70.2
Present 198 29.8
-for-age deficit. In the multiple model for weight-for-height deficit, “water supply” was also selected (Table 2).
chil-Table 2 - Prevalence (%) and prevalence ratio (PR) of malnutrition among children under 60 months by municipality of residence, socioeconomic conditions, access to services and child care, birth weight and morbidity. Assis Brasil and Acrelândia, AC, 2003.
Tabela 2 – Prevalência (%) e razão de prevalência (RP) da desnutrição em crianças menores de 60 meses segundo município de residência, condições socioeconômicas, acesso aos serviços e cuidado da criança, peso ao nascer e morbidades. Assis Brasil e Acrelândia, AC, 2003.
Variables / Categories Height-for-age deicit Weight-for-height deicit
% Crude PR p % Crude PR p
City
Assis Brasil 7.6 1 0.202 5.0 1 0.383
Acrelândia 10.8 1.42 3.6 0.71
Household wealth index
3rd third (high) 7.0 1 0.017 3.5 1
2nd third 7.9 1.12 4.2 1.19
1st third (low) 14.4 2.04 4.0 1.15 0.927
Linear trend p 0.013 0.767
Father’s or stepfather’s level of literacy
Literate 8.8 1 0.014 4.3 1 0.630
Illiterate 18.4 2.07 3.0 0.70
Living with the biological parents
Living with the biological mother and father 9.4 1 0.047 4.0 1 0.050
Living only with the biological mother 7.9 0.83 1.9 0.48
Biological mother not living in the home 19.6 2.07 9.8 2.39
Younger siblings
No younger sibling 5.6 1 0.000 3.0 1 0.449
1 younger sibling 10.9 1.93 4.4 1.46
2 or more siblings 20.6 3.65 5.7 1.91
Linear trend p 0.000 0.202
Open sewage
Absent 7.3 1 0.000 4.1 1 0.414
Present 18.7 2.57 2.6 0.64
Water supply
Public network 9.2 1 0.488 4.7 1 0.195
Other sources (water well, river or dam) 10.8 1.17 2.7 0.57
Weight at birth
Higher than 2,500 g 9.1 1 0.078 3.1 1 0.024
Equal to or lower than 2,500 g 16.6 1.81 9.2 2.91
Anemia
Absent 8.5 1 0.038 4.6 1 0.495
Present 14.1 1.65 3.3 0.73
Diarrhea in the 15 days prior to interview
Absent 11.5 1 0.029 3.8 1 0.684
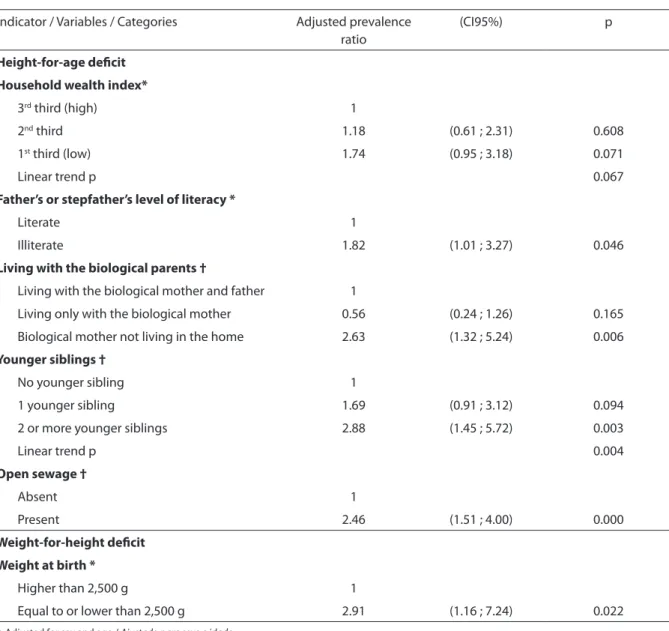
Table 3 - Factors associated with malnutrition in children under 60 months, using hierarchical multiple regression analysis. Assis Brasil and Acrelândia, AC, 2003.
Tabela 3 – Fatores associados à desnutrição em crianças menores de 60 meses obtidos mediante análise múltipla hierarquizada. Assis Brasil and Acrelândia, AC, 2003.
Indicator / Variables / Categories Adjusted prevalence ratio
(CI95%) p
Height-for-age deicit
Household wealth index*
3rd third (high) 1
2nd third 1.18 (0.61 ; 2.31) 0.608
1st third (low) 1.74 (0.95 ; 3.18) 0.071
Linear trend p 0.067
Father’s or stepfather’s level of literacy *
Literate 1
Illiterate 1.82 (1.01 ; 3.27) 0.046
Living with the biological parents †
Living with the biological mother and father 1
Living only with the biological mother 0.56 (0.24 ; 1.26) 0.165
Biological mother not living in the home 2.63 (1.32 ; 5.24) 0.006
Younger siblings †
No younger sibling 1
1 younger sibling 1.69 (0.91 ; 3.12) 0.094
2 or more younger siblings 2.88 (1.45 ; 5.72) 0.003
Linear trend p 0.004
Open sewage †
Absent 1
Present 2.46 (1.51 ; 4.00) 0.000
Weight-for-height deicit
Weight at birth *
Higher than 2,500 g 1
Equal to or lower than 2,500 g 2.91 (1.16 ; 7.24) 0.022
* Adjusted for sex and age / Ajustado para sexo e idade
† Adjusted for sex, age, wealth index and literacy of the father or stepfather / Ajustado para sexo, idade, índice de riqueza e alfabetização do pai ou padrasto
dren whose father or stepfather was illiterate showed a greater magnitude of association with height-for-age deficit, when compared to others whose father or stepfather was literate. The exclusion of “household wealth index” from the multiple model reduced the prevalence ratio of “having a literate father or stepfather” by more than 10%. Thus, “household wealth index” remained in the multiple model as a factor associated with height-for-age deficit. In the block of access
to child care and services, the fact of a child living without the biological mother showed double the magnitude of association with the height-for-age deficit. A linear rela-tionship was found between a higher num-ber of younger siblings and height-for-age deficit (linear trend p=0.004). In addition, “home environment being exposed to open sewage” doubled the magnitude of associa-tion with height-for-age deficit.
weight-for-height deficit, only the “weight at birth” variable was found to be an ciated factor. Low weight at birth was asso-ciated with an increase in the prevalence of weight-for-height deficit by approximately three times. After adjustment for sex and age, the prevalence ratio of low weight at birth remained similar to that identified in the crude analysis. “Diarrhea in the 15 days prior to interview” and “anemia” did not re-main in the final multiple model for height--for-age deficit, after adjustment of variables from previous blocks, because they did not show statistical significance (p<0.05). In the analysis of weight-for-height deficit, after adjustment for sex and age, “living with the biological parents” and “water supply” did not show statistical significance (p<0.05) and were excluded from the multiple model. There were no statistically significant differences between cities for the variables investigated, except for “number of youn-ger siblings” (proportion of two or more younger siblings: Acrelândia 16% and Assis Brasil 6.1%, p=0.016) and “water supply” (proportion of homes with public water supply: Acrelândia 54% and Assis Brasil 77%, p=0.000). The inclusion of a city as an adjustment/control variable in all blocks did not change the variables selected in the final model (data not shown).
Discussion
In the present study, the prevalence of height-for-age deficit was an important public health problem in the cities studied, with a general prevalence of 9.9%. Factors associated with height-for-age deficit were as follows: low household wealth index, having an illiterate father or stepfather, biological mother not living in the home, having two or more younger siblings, and being exposed to open sewage in the home environment. With regard to the weight-for--height deficit, with a general prevalence of 4.1%, the only associated factor was “low weight at birth”. This is the first investigation conducted in Northern Brazil that estimated nutritional deficits, using the new
bench-mark of the WHO’s 2006 growth standard. The height-for-age deficit was found to be an important nutritional problem in the cities studied.
Compared to recent information from the 2006 PNDS, the prevalences of nutri-tional deficits found in the present study were higher than the general Brazilian pre-valence of height-for-age deficit (7.0%) and weight-for-height deficit (1.98%) in children younger than 60 months3. Vulnerability of
children to socioeconomic inequalities and the characteristics inherent in the family structure are important factors associated with child malnutrition in the cities studied.
On the distal level, having an illiterate father or stepfather was associated with height-for-age deficit in the cities studied, corroborating findings from a previous study conducted in Southern Brazil16. This
association could be the result of the father’s or stepfather’s limited ability to help the mother with their children’s adequate he-alth and food habits, due to the difficulty in understanding the information provided by health services or originated from other sources17. Thus, the father’s or stepfather’s
reduced length of time of study can also in-fluence the acquisition of household goods or allocation of income aimed at child care. The great difference between high-in-come and low-inhigh-in-come families in the cities analyzed, with regard to the prevalence of height-for-age deficit of children, was con-sistent with national studies1,18. Monteiro et
al.1, while analyzing data from the 1996 and
malnutrition observed in the present study. With regard to child care, Thomas19
analyzed data from the 1989 national sur-vey, suggesting that income controlled by mothers had a greater positive effect on the child’s height-for-age index, compared to in-come controlled by fathers. In addition, this author evidenced that mothers allocated more resources to buy foods than fathers. Likewise, couples living in the Northeast re-gion of Brazil also indicated that fathers are responsible for the family’s economic issues, whereas food care is attributed to mothers20.
Considering these circumstances, the fact that the biological mother does not live in the home, as observed in the present study, indicates a vulnerable situation involving the child’s inadequate nutritional status.
On the other hand, children from Assis Brasil and Acrelândia who only live with the biological mother did not show statistically different prevalences of nutritional deficits, when compared to children who lived with the biological mother and father. However, the fact of a child only living with the biolo-gical mother did not exclude the possibility of their living with the stepfather or other family members. Likewise, Carvalhaes & Be-nício21 observed that, in the city of Botucatu,
state of São Paulo, 90% of mothers living without a partner resided with other family members. In this sense, living with family members strengthens the social support network for child care22,23, enabling
emo-tional support and helping with this child care. Moreover, the presence of the mother’s partner in the home increases access to household goods and essential services for adequate child nutritional status21,24,25,26.
Evidence of a higher number of youn-ger siblings being associated with height--for-age deficit suggests an increase in household spending and reduction in time and resources allocated for child care. In
this sense, Eastwood & Lipton27 reported
that high fertility has a great impact on household income, especially in families living below the poverty line.
With regard to access to services, the pre-sent study revealed that child malnutrition was associated with the presence of open sewage. In 2000, it was estimated that only 34% of homes in the state of Acre were con-nected to the general water supply network and that 17.6% of homes were connected to the general sanitary sewage network6.
National data also showed an association between inadequate basic sanitation con-ditions and child malnutrition28,29. On the
proximal level, the association between low weight at birth and weight-for-height deficit could reflect the precariousness of health care services for pregnant women in the cities studied. In this sense, according to an observation made during the study in 2003, pregnant women of the cities of Assis Brasil and Acrelândia were treated by only one
Unidade Básica de Saúde (UBS – Primary
Health Unit) in each city studied. Moreover, in this same year, a UNICEF report stated that 20.2% of pregnant women did not have prenatal consultations in the state of Acre30.
The cross-sectional design of the present study prevented the identification of tem-porality between independent variables and nutritional deficits. However, information was collected from direct observation and report of a recent occurrence. Thus, it could be inferred that the occurrence of memory bias for the main variables analyzed is unlikely.
1. Monteiro CA, Benicio MHA, Konno SC, Silva ACF, Lima ALL, Conde WL. Causes for the decline in child under-nutrition in Brazil, 1996-2007. Rev Saúde Pública 2009; 43: 35-43.
2. Monteiro CA, Conde WL, Popkin BM. Is obesity replacing or adding to under-nutrition? Evidence from different social classes in Brazil. Public Health Nutr 2002; 5: 105-12.
3. Ministério da Saúde. Pesquisa Nacional de Demografia
e Saúde da Criança e da Mulher: 2006. Brasília; 2008.
Disponível em http://www.saude.gov.br/pnds2006 (Acessado em 12 de dezembro de 2008).
4. Instituto de Pesquisa Econômica Aplicada. Radar Social. Brasília: Instituto de Pesquisa Econômica Aplicada; 2005.
5. Instituto Brasileiro de Geografia e Estatística. Pesquisa Nacional por Amostras de Domicílios. Segurança
alimentar 2004. Rio de Janeiro: Instituto Brasileiro de
Geografia e Estatística; 2006.
6. Ministério da Saúde. Saúde Brasil 2004: uma análise da
situação de saúde. Brasília: Ministério da Saúde; 2004.
7. Muniz PT, Castro TG, Araujo TS, Nunes NB, Silva-Nunes M, Hoffmann EH et al. Child health and nutrition in the Western Brazilian Amazon: population-based surveys in two counties in Acre State. Cad Saúde Pública 2007; 23: 1283-93.
8. Castro TG, Silva-Nunes M, Conde WL, Muniz PT, Cardoso MA. Anemia e deficiência de ferro em pré-escolares da Amazônia Ocidental brasileira: prevalência e fatores associados. Cad Saúde Pública 2011; 27: 131-42.
9. Filmer D, Pritchett LH. Estimating wealth effects without expenditure data-or tear: an application to educational enrolments in states of India. Demography 2001; 38: 115-32.
10. World Health Organization. Iron Deficiency Anaemia:
Assessment, Prevention and Control. Geneva: World
Health Organization; 2001.
11. World Health Organization. Physical Status: The Use and Interpretation of Anthropometric Indicators of
Nutritional Status. Geneva: World Health Organization;
1995. (WHO - Technical Report Series 854).
12. World Health Organization. WHO Multicentre Growth Reference Study Group. WHO child growth standards: length/height-for-age, weight-for-age, weight-for-length,
weight-for-height and body mass index-for-age. Geneva:
World Health Organization; 2006.
13. Barros AJD, Hirakata VN. Alternatives for logistic regression in cross-sectional studies: an empirical comparison of models that directly estimate the prevalence ratio. BMC Med Res Methodol 2003; 3: 21. Disponível em http://www.biomedcentral.com/1471-2288/3/21 [Acessado em 5 de dezembro de 2008]
14. Victora C, Huttly S, Fuchs S, Olinto M. The role of conceptual frameworks in epidemiological analysis: a hierarchical approach. Int J Epidemiol 1997; 26: 224-7.
15. UNICEF. Situação mundial da criança 1998. Brasília: UNICEF; 1998.
16. Olinto MT, Victora CG, Barros F, Tomasi E. Determinantes da desnutrição infantil em uma população de baixa renda: um modelo de análise hierarquizado. Cad Saúde Pública 1993; 9: 14-27.
17. Mascarenhas MLW, Albernaz EP, Silva MB, Silveira RB. Prevalência de aleitamento materno exclusivo nos 3 primeiros meses de vida e seus determinantes no Sul do Brasil. J Pediatr 2006; 82: 289-94.
18. Oliveira VA, Assis AM, Pinheiro SM, Barreto ML. Determinantes dos déficits ponderal e de crescimento linear de crianças menores de dois anos. Rev Saúde
Pública 2006; 40: 874-82.
19. Thomas D. Incomes, expenditures, and health outcomes: evidence on intrahousehold resourse allocation. In: Haddad L, Hoddinott J, Alderman H, eds. Intrahousehold resourse allocation in developing
countries: models, methods, and policy. Baltimore, USA:
IFPRI; 1997. p. 142-64.
20. Pontes CM, Alexandrino AC, Osório MM. Participação do pai no processo da amamentação: vivências,
conhecimentos, comportamentos e sentimentos. J
Pediatr 2008; 84: 357-64.
21. Carvalhaes MA, Benício MH. Capacidade materna de cuidar e desnutrição infantil. Rev Saúde Pública 2002; 36: 188-97.
22. Carvalhaes MA, Benício MH, Barros AJ. Social support and infant malnutrition: a case–control study in an urban area of Southeastern Brazil. Br J Nutr 2005; 94: 383–9.
23. Marques ES, Cotta RMM, Magalhães KA, Sant’Ana LFR, Gomes AP, Siqueira-Batista R. A influência da rede social da nutriz no aleitamento materno: o papel estratégico dos familiares e dos profissionais de saúde. Ciênc Saúde
Coletiva 2010; 15 (S1): 1391-400.
24. Silveira FJF, Lamounier JA. Fatores associados à duração do aleitamento materno em três municípios na região do Alto Jequitinhonha, Minas Gerais, Brasil. Cad Saúde
Pública 2006; 22: 69-77.
25. Santos Neto ET, Faria CP, Barbosa ML, Oliveira AE, Zandonade E. Association between food consumption in the first months of life and socioeconomic status: a longitudinal study. Rev Nutr 2009; 22: 675-85.
26. Molina MCB, Lopéz PM, Faria CP, Cade NV, Zandonade E. Preditores socioeconômicos da qualidade da alimentação de crianças. Rev Saúde Pública 2010; 44: 785-32.
27. Eastwood R, Lipton M. The impact of changes in human fertility on poverty. J Dev Stud 1999; 36: 1-30.
28. Monteiro CA, Conde WL. Tendência secular da
desnutrição e da obesidade na infância na cidade de São Paulo (1974-1996). Rev Saúde Pública 2000; 34: 52-61.
29. Rissin A, Batista-Filho M, Benício MH, Figueiroa JN. Condições de moradia como preditores de riscos nutricionais em crianças de Pernambuco, Brasil. Rev
Bras Saúde Matern Infant 2006; 6: 59-67.
30. UNICEF. Ser criança na Amazônia. Belém; 2004. Disponível em http://www.unicef.org/ brazil/pt/ser_ crianca_amazonia.pdf (Acessado em 12 de dezembro de 2008).