1) Long term rating at: Moody’s A1, Fitch Ratings A+, Standard and Poor’s A, same as in June 2007.
DISCLOSURES AND DISCLAIMER AT THE END OF THE DOCUMENT PAGE 1/24
SEE MORE INFORMATION AT WWW.FE.UNL.PT
Trying to make ends meet, BPI got the soundest financials within the Portuguese banks “for all the considered agencies, BPI is the only Iberian bank holding the same short and long term rating
notations as the ones held before the financial crisis”1
. Favouring capital and liquidity, the bank left behind growth perspectives and it’s now trying to catch up on profitability terms. In the meanwhile, National economy is shaking and macroeconomic statistics are still concerning, resulting on a gray environment evolving the financial actors expectations.
In recent years, BPI has pursued a strategy of expanding in lower risk segments with aggressive lending terms. As a result, it now holds €11bn of loans with an average 70bp spread, which we believe could take longer to re-price as they are considerably tilted towards mortgages.
Going forward, we anticipate more or less stable margins as lower margins in Portugal should be compensated by a higher
contribution from Angola.
Company description
BPI is the forth-largest private bank in Portugal in terms of assets (€47bn) and the third largest on market cap (€1.25bn). BPI’s market share in deposits and loans is nearly 10% and around 20% in asset management. BPI was originally an investment bank but has been increasing, in the past decades, its exposure to retail banking through successive acquisitions of retail banks.
06JANUARY 2010
“BPI”
C
OMPANY
R
EPORT
“BANKING”
A
NALYST:
“M
ARISA
LOBO
”
[email protected]
Trying to make ends meet
Wise but not audacious
Recommendation: HOLD
Vs Previous Recommendation HOLD
Price Target FY10: 2.48 €
Vs Previous Price Target 2.40 €
Price (as of 6-Jan-10) 2.294 €
Reuters: BPI.LS, Bloomberg: BPI PL
52-week range (€) 2.570-1.340
Market Cap (€m) 2,065.500
Outstanding Shares (m) 900.000
Source:Bloomberg
Source:Euronext
(Values in € millions) BPI
Earnings 0,167
Price/ Earnings 8,383
Beta vs PSI20 1,067
ROE 9,594
Last div. reported 0,053
Efficiency ratio 61,10%
90 day volatility 31,037
PAGE 2/24
Table of Contents
Executive summary ...3
Executive summary ...Erro! Marcador não definido. Executive summary ... Erro! Marcador não definido. Valuation ...9
Company overview ...10
Company description... 10
Shareholder structure ... 12
The Sector ...13
Comparables... 16
Angolan Banking Sector ... 17
Financials ...18
Appendix ...20
Summary Tables ...20
PAGE 3/24
Executive summary
Wise but not audacious, in dealing with the turmoil BPI has proved its financial strength. Its impairment (cost of risk) ratio level is almost half of the market impairment and the Tier and Core-Tier ratios offer the Bank a comfortable solvency status even without recurring to the less expansive funding of BCE. Nonetheless, on these disturbed times the bank’s management left profitability behind and comparatively neglected its margins. In the domestic activity the huge investment in Retail banking (41% more branches) is not yet compensated and credit is still slowing down. The default ratio increased again and the unemployment, which typically reacts with a lag, is expected to grow next year, exposing BPI on mortgage loans, a considerable slice of its portfolio. On the other hand bear markets turned bull and customers are slowly moving from deposits to investment funds and similar investments known for being far more profitable than the former ones.
Analysis: As we’re abandoning the storm, there is not clear consensus on a
recovery. The environment and expectations are positive, but the results depend on more than optimism. Nowadays investors are reviewing earnings upwards and fuelling the rise of markets. Still, there are some risks at this stage once this process owes a lot to cost cutting and rationalization in the companies. The recovery proof lies not on the private consumption performance, but on the replacement of the State’s by the Private companies’ investment as the engine of growth. The exposure of BPI to mortgage loans is comparatively high, a sector which is suffering from negative margins. As for demand of corporate loans, with the biggest slice in the portfolio, there is a sharp deceleration and an increase on impairment. BPI is now changing its management view from capital and liquidity to clients and profitability. The strategy is still organic growth, considerable investment is not to be expected and the international focus will remain in Angola and Mozambique. It announced twin banking with La Caixa de Barcelona, its main shareholder, and it might do the same with BFA in Angola and Itaú in Brasil.
Conclusion: BPI is strong in capital, has comfortable liquidity and funding position and sound risk indicators. Its improved commercial capacity may leverage play on the recovery of the Portuguese economy, it has room to develop a highly profitable investment banking unit and enjoys a good position to advantage from growth opportunities in Angola. Even so there is historical evidence for slow pace in the Portuguese recovery and in what concerns Angola no much is needed to guess the huge increase in competitiveness.
Contextualizing
Graph 1: Impairment
PAGE 4/24
This crisis, what it meant for this financial institution was not the problem with subprime, securities and so on, the big issue was the negative shock on revenues. Looking to the domestic accounts of BPI, and comparing the 12 months ended in June 2009 with the 12 months ended in June 2008, we can see that net operating revenue, corrective of the extraordinaries for 2008 (stake in BCP, early
retirements and sale of 49,9% of BFA) decreased €250 million. And on top of that, in lines that are not included in net operating revenue, like recoveries of loans where deterioration has been observed, there’s the increase in impairments – credit impairments and weakening in the contribution from equity-accounted subsidiaries, mainly insurance companies, Allianz and Cosec.
Nonetheless, the international division, mainly Angola, continues full steam ahead, with growth in excess of 30% in 2009E on lfl a basis. However, it will only make a 50% contribution this year after a partial disposal in December 2008. Therefore we anticipate more or less stable margins as lower margins in Portugal should be compensated by a higher contribution from Angola.
International Business
Banco BPI dedicates 20% of its resources to international business. BPI’s
international business accounted for 52.6% of its net profit in 3Q09. 97% of BPI’s international business belongs to Angola through the BFA, while only 3% respects to Mozambique in BCI’s 30% stake.
BFA’s plays a very important role on BPI’s results, so it makes sense to understand better where it comes from and where it may head.
In 1990 was the opening, in Luanda,of a representative office of the former Banco de Fomento Exterior - BFE.
In July 1993, this presence has been strengthened with the opening of the branch of the BFE, in Luanda, which began offering commercial banking from a capital of USD 4 million. In1996 BFE was acquired by BPI in August 1996, marking the beginning of a strong expansion of the group in Angola.
Around July 2002, BFA, 100% owned by BPI, acquired the status of an
autonomous entity under Angolan law, following the transformation of the branch of Banco BPI, with a capital of USD 30 million.
By 2003, its new headquarters in Luanda were opened, becoming the highlight of BFA trademark in the Angolan market and a reference in the expansion of the Sales Network of the Bank to focus on services in a single location.
The year 2004, began the process of segmentation of the Sales Network with the opening of the first three centers and companies devoted to the specialized care of clients of the Business segment.
In April 2005, it created a social fund to provide financial assistance to initiatives in education, health and social solidarity, giving the body a policy of social
Graph II: Net profit per segment
PAGE 5/24
responsibility and a commitment by the BFA to society, the institutions and the Angolan citizens.
In June 2005, the BFA has released BFA Gold VISA card, it would thus provide the first Credit Card for the Angolan market.
In November, the BFA was co-leader and member of the Underwriting Syndicate in the issuance of $ 200 million in Government bonds, denominated in dollars, with maturities from 1 to 7 years for the renewal of the fleet of TAAG.
2006 marked a significant acceleration of the expansion of the commercial network and the enhancement of segmentation, with the inauguration of the first Investment Center in May 2006.
As of 2008, BFA had 113 branches with close to a 20% market share in deposits and loans. It has assets worth €4.6bn and generated net profit of €136mn in 2008, and a 29.5% ROE.
BPI sold 49.9% of BFA to the Angolan government in 2008 for US$475mn, generating €177mn in capital gains. This sale concerns the value of Banco Fomento de Angola, being that in accounting terms the bank maintains full consolidation.The disposal was carried out to fulfill government requirements, ensuring the sustainability of the franchise in the long term. At the same time it reinforced the group’s capital ratios.
Angola is heavily dependent on oil exports. Total oil exports account for 5% of OPEC oil production and more than half of the country’s GDP. Angola was exporting 2mn barrels a day at over US$100 but OPEC production restrictions have reduced this to 1.5mn barrels at US$40. Although the situation has improved since oil’s recent lows, the economy had a relatively tough 2009E.
Table I, Angola – Macroeconomic Forecasts, 2008-11E
(%) 2008 2009E 2010E 2011E
Real GDP growth 14,8 -3,6 9,3 10,8
Current account balance 21,2 -8,1 0,1 3,3
CPI 13 10 8 5
Source: Bank of Portugal
PAGE 6/24
International Framework
In 2009, economic activity globally continued to be strongly affected by the financial international crisis. In particular, following the intensification of the financial crisis with the collapse investment bank Lehman Brothers, the last quarter of 2008 and first quarter of 2009 were characterized by a sharp drop in economic activity and international trade. The deterioration of the activity has enhanced the interplay between financial and real economy that reinforced each other. From the second quarter, the situation in financial markets and overall economic activity have seen some recovery over the first quarter, reflecting in particular a boost on stronger Asian economies and a stabilization or modest recovery in other economic areas.
Improving economic conditions and financial arrangements have been influenced strongly by the set of stimulus measures of monetary and fiscal policy and measures stabilizing the financial system that contributed to an improvement in the economic confidence, stimulated demand and led to decrease uncertainty and systemic risk in financial markets. However, the economic recovery in the second half of 2009 remains heavily influenced for the maintenance of relatively tight financial conditions for the consumers and businesses, despite the progress observed since the second quarter, and particularly in some advanced economies, there was significant decline in asset prices and rising unemployment. In parallel, the economic recovery in some emerging economies and developing countries also tend to be constrained, in particular those where external financing needs are higher. Inflation rates at world have fallen significantly over the year, mainly reflecting price levels of raw materials significantly lower than those seen last year and decreased capacity used in a context of sharp decline in global demand. International economic evolution remains subject to high uncertainty and risks to the outlook global economy.
For all of 2009 the IMF forecasts, made on the basis of information available to mid-September, point to a sharp drop in economic activity and international trade. The world GDP is expected to fall 1.1 percent in 2009, after growing 3.0 percent in 2008. Economic Assets in the advanced economies shall fall significantly
compared to the previous year (3.4 per cent against an increase of 0.6 percent in 2008). To the emerging market economies and developing countries, the
slowdown should be generalized to various regions, but with different magnitudes. The economies of Central and Eastern Europe and the Commonwealth of
PAGE 7/24
countries, the deceleration should be milder, and the GDP growth fall from 7.6 to 6.2 per cent. Contraction overall economic activity in 2009 was accompanied by a sharp decline in trade world that was common to advanced economies and emerging economies and development (Figure 2.1). The disruption of world trade, associated with a general fall of trust and the high level of uncertainty that led economic agents to reduce or postpone consumer spending and investment, has been exacerbated by poor access to commercial credit in context of intensifying financial crisis, and the phenomenon of vertical specialization global production observed in recent years that have increased the sensitivity of flows trade to changes in global demand. The IMF said the global trade in goods and services should make this year an unprecedented decline of about 12 percent, after a increase of 3 percent in 2008.
According to the IMF after the steep fall in fourth quarter 2008 and first quarter of 2009, the global economic activity has shown a slight recovery in the second quarter that should be maintained until the end of year1. This reflected, in particular, a stronger European Strong Asian economies and a stabilization or modest recovery in other economic areas. The recovery in world economic activity was mainly characterized by a resurgence industrial production and world trade, to which have contributed to need to replenish stocks after the sharp drop in
production occurred in late 2008 and early 2009. Overall, the improved economic conditions benefited strongly from all measures of monetary and fiscal policy and stabilization of the financial sector that helped to stimulate demand and
contributed to an improvement in economic confidence (Chart 2.3) and conditions in financial markets. Among them is the acceleration of economic Asia, particularly China, which benefited both the policies of economic stimulus, or the resuscitation of intra-regional trade, financial markets and international capital flows.
Economic activity in other emerging market economies and developing countries should also benefit from the revival of world trade and demand for raw materials. Moreover, the activity in advanced economies should continue strongly
conditioned by increase in unemployment (Chart 2.4), the decrease in prices of real estate assets and the existence of conditions of financing relatively restrictive, especially in access to bank credit, although we have seen some improvement over 2009, and in particular a sharp fall in interest rates.
PAGE 8/24
longer term. Additionally, materialization of credit risk may raise new transmission effects between the financial sector and economic activity. Meanwhile, there are also some upside risks, as the policy measures implemented around the world can build confidence economic and contribute to a recovery in private demand stronger than expected, leading to a more sustainable economic recovery. In this context, the conduct of economic policies should be made consistently and timely.
In terms of monetary policy, the authorities should continue to monitor closely developments economic situation and financial markets, to assess the need for continuation of the stimulus given the outlook for price stability.
In the context of strengthening the economic recovery, rising inflationary pressures should be carefully scrutinized, especially given the growth potential the economy may have been reduced recently. In the case of fiscal policies, the impact these measures, by their very nature, is not immediate and remains subject to significant uncertainty.
The outlook for economic activity in the near future remains uncertain. In fact, although the most likely scenario is that of a gradual recovery and limited activity both internally and externally, the balance of risks is on the downside. A major risk relates to the impact of the gradual reversal of measures to support the financial system and stimulate could constrain economic recovery in economic activity, as there is high uncertainty about the evolution of the underlying economies and the financial system. A possible materialization of downside risks result would be a most unfavorable evolution of domestic and external demand and the level of unemployment, with negative consequences on the financial situation of
PAGE 9/24
Valuation
We have reinitiated the coverage of BPI with a Hold recommendation and a price target for YE10 of €2.48. Valuation was conducted on a Flow-to-Equity (FTE) approach to the discounted cash-flow model. Our choice to use FTE was due to the difficulty of distinguishing retail bank’s operational debt from its financial debt. We have also assumed the CAPM model to calculate the cost of capital. We have
assumed a cost of equity of 10.94% and long-term growth of 2.68%.This cost of equity results from a 4% risk free rate, as used in the European Securities Network definition guide, an equity risk premium of 6,5% also taking in
consideration the higher risk faced in the Angolan Economy and a systematic risk of 1,067 compared to PSI20 in the last 5 years.
Although earnings momentum will be challenging for the performance of the stock, we re-instate coverage with a Hold rating due to its better asset quality profile.
Domestic Operation
Our main assumptions were:
2008 2009e 2010p 2011p 2012p 2013p 2014p 2015p 2016p 2017p 2018p
terminal value
Terminus assumptions:
GDP (real) growth 0,00% -2,60% 0,50% 1,00% 1,30% 1,80% 2,00% 1,80% 1,80% 1,80% 1,80%
Inflation 2,60% -0,80% 1,00% 1,50% 1,80% 2,00% 2,00% 2,00% 2,00% 2,00% 2,00%
Assumed long term growth
rate 2,68%
Assumed long term ROE 10,94%
Inputs from forecasts:
Profit after taxation 58,3 70,9 134,5 195,4 205,2 208,7 212,2 215,7 219,4 223,0 229,0
Increase in Assets (1.303) (1.909) (1.381) (1.611) (1.935) (1.535) (1.873) (1.726) (1.831) (1.943) (1.995)
Increase in Liabilities 1220,18 1820,83 1287,83 1365,00 1934,76 1534,56 1872,94 1726,29 1831,16 1942,66 1994,73 Cash flow to/(from) equity (24) (17) 41 (51) 205,22 208,66 212,17 215,73 219,36 223,04 229,02
PAGE 10/24 Discounted cash to equity value:
NPV ten year free cash flow 556,40
NPV terminal value 982,77
Value of shareholders' funds 1539,16
Shares issued (million) 900,00
Value per share (Eur) €1,71
Source: Nova Research Team
As we’re mentioning more ahead in the text, in what concerns the international business we got a contribution of €0,77 to our consolidated value. That results brought us to the referred target price of €2,48.
Company overview
4th major Portuguese private financial group Total assets of € 52 Bi.
Market share of nearly 10% in deposits and loans, and around 20% in asset Management
Integrated multi-channel distribution network Stock market capitalisation of € 2.2 Bi.
Company description
The BPI Group - headed by Banco BPI - is a financial and multi-specialist group, focusing on the banking business, with a comprehensive spectrum of financial services and products for corporates, institutional and individual Customers.
PAGE 11/24
In Angola, BPI is the leader in commercial banking activity with a market share close to 25% through its 50.1% stake in Banco de Fomento.
BFA served a universe of 563 thousand Customers at 31 December 2008.
BPI’s growth model has been an organic one with heavy investments in the expansion of its branch network. In addition to its domestic operations, BPI has a high exposure to Angola through BFA that in 2008 generated about 27% of consolidated net interest income. Even though 2008 was not a typical year due to the strong impairments related to the devaluation of BCP stake, international influence on bottom line has been significant and is expected to continue to be so. In June 2008 BPI concluded a capital increase of €350mn (€140mn shares reserved to shareholders at €2.50 and was fully subscribed). After the completion of the rights issue, share capital stood at €900mn.
After this rights issue, BPI emerged in the banking scene as a well capitalized bank. In addition, BPI has no major pension fund issues as pension liabilities are covered 106% by the fund's assets. There is no subprime exposure, no liquidity problems and low provisioning costs.
In the last period BPI had a net profit of €130.6 million compared with 34.4 reported in the first nine months of last year. Net operating revenue increased 10.6%. Operating costs increased 2.5% in consolidated accounts and fell 2% in the domestic activity. Customer resources increased less than 1%, and on-balance sheet customer resources increased 2.2%.
Loans to customers increased almost 1%, 0.7 in domestic activity and 5.9 in Angola. BPI showed a leadership position in the lines of credit that the
PAGE 12/24
Shareholder structure
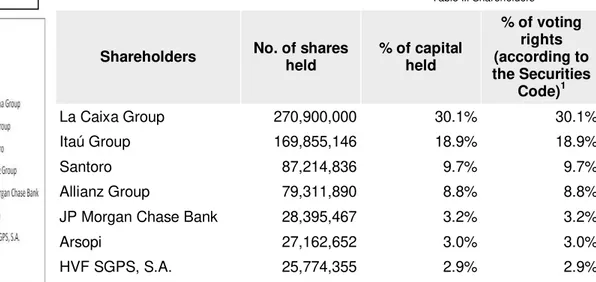
Banco BPI's share capital is made up of 900 million of nominative and dematerialized (book entry) ordinary shares with a nominal value of one euro each. All the shares are listed on the Euronext market.
Santoro’s part is directly held by Santoro Finance - Prestação de Serviços, SA, is imputable to Santoro Financial Holdings, SGPS and to Eng. Isabel José dos Santos as shareholder of Santoro Financial Holdings, SGPS.
Shareholders owning more than 2% of Banco BPI's capital
Note: shareholder positions recorded at 30 September 2009 at the Securities Clearing House, based on the information received from the Clearing House. At 30 September 2009 the BPI Group held 6 370 575 own shares corresponding to 0.71% of Banco BPI share capital.Source: Investor Relations Public Information.
.
BPI’s shareholding structure includes three major foreign investors – La Caixa, Itau and Allianz – and some Portuguese shareholders that are present in the bank’s shareholder structure since its origins, like HVS, Arsopi and Auto Sueco. These shareholders play a fundamental role in the bank given that they seat in the board and participate in strategic decisions. Since there is some stability in the shareholders structure, it is easier to rank first the interests of the bank.
Shareholders No. of shares held % of capital held
% of voting rights (according to the Securities
Code)1
La Caixa Group 270,900,000 30.1% 30.1%
Itaú Group 169,855,146 18.9% 18.9%
Santoro 87,214,836 9.7% 9.7%
Allianz Group 79,311,890 8.8% 8.8%
JP Morgan Chase Bank 28,395,467 3.2% 3.2%
Arsopi 27,162,652 3.0% 3.0%
HVF SGPS, S.A. 25,774,355 2.9% 2.9%
PAGE 13/24
Any change to the statutory provision considering voting rights, requires the approval of 75% of the votes cast in General Meeting. Anyway, we also stress that the Portuguese legislation forces a mandatory acquisition if participation exceeds 33%.
La Caixa is the closest one to reach this level, and has been increasing its shareholding, currently at little more than 30% (vs. 27.5% at 1H08) having said it to be a “life investment”. Throughout the time, there has been a support of these shareholders in what regards the management and there have not been disruptive situations.
BPI’s shareholder structure has been quite relevant during the bank’s recent past. BCP, a Portuguese rival in the banking sector, attempted to perform a hostile
takeover, which came to failure before the end of year 2007. This event was a
clear sign of shareholder support for the management team.
The
Sector
Portuguese banking Sector
The banking sector in Portugal is very concentrated, 85% of the market share is within the biggest financial institutions.
Market shares of the five major banking groups
(%) 2000 2007
Loans to customers (gross) 92 93
Resources from customers 81 95
Assets 82 85
Source: Associação Portuguesa de Bancos
Despite the first signs of positive developments in the global economy by a number of indicators during 2009, which have been accompanied by increasing levels of investor confidence following concerted action by
governments (with special emphasis on the European and North American) and central banks, the economic environment in the period under review continued to be characterized mainly by the financial market crisis and economic recession. Thus, the key variables and indicators of banking activities were influenced by the conditions of hardship that marked this period, reflected accordingly in the evolution of activity and results.
Among the banking sector values and indicators of June 2009, we note the following behavior:
PAGE 14/24
- Net Assets, which amounts to M € 472.8 thousand, represent an annual growth rate of 10.1%. Within the assets of the sector, the volume of credit granted to customers, which assumes a particular relevance, registered a growth of 7.2% despite the business cycle downturn and the growth of credit risk;
- Resources for Clients presented an increase of 9.8%, very close to the rate of growth of assets, which have benefited from a redirection of savings to balance products (particularly for traditional bank account Time and savings deposits), as a result of the devaluation of capital markets that increased the risk aversion of customers, discouraging subscription products disintermediation;
- The Outstanding Securities (78.2 bn €), whose change shows its growing importance in the forms of financing activity. The recent improvement in investor confidence again allowed access to the market of unsecured debt, which since September 2008 was virtually disabled, and several institutions have successfully conducted emissions during the first half of 2009;
- The number of branches, which, over the same period increased 2.9% to 6314 units continue to reflect the effect of business strategy to expand the physical networks of sale;
- The number of bank employees who, in turn, is stabilized with a variation of only 0.6% to 59,331 employees, with the ratio number of employees per branch has fallen to 10 for 9 people, a development which was accompanied by an
improvement in operating efficiency, as evidenced both by weight reduction in costs on financial assets or the cost-to-income;
- The gross operating profit established (2756 M €), which stood above the 10.4% reached in June 2008, supported by an increase in commissions and in particular the increase of 20.3% in the markets results in conjunction with the containment of operating costs (+1.2%);
- The net result, to have reduced through the increase in provisions and impairments, including those related to the loan portfolio in line with the
deterioration in the macro-economic and the devaluation of financial instruments; - The cost-to-income ratio, shows an improvement, with a reduction of 215 bp for 50.44%;
- Return on equity, which reduced to 8.72% as a result of the combined effect of building up equity (+22.4%) and the already mentioned decrease in net income. The year 2009 has marked, following the developments in late 2008, the
intensification of the interaction between the financial crisis and economic activity translated into a growing realization of credit risk, with negative consequences for the profitability of banks. This is an international trend that is also apparent in the Portuguese economy. In fact, the economic situation in 2009 is featured in a comprehensive way by the worst recession in decades, though there is evidence that the pace of decline in economic activity is increasingly
6 months euribor
Source: Euribor-rates.eu 6 months euribor yoy evolution
PAGE 15/24
smaller. In fact, the concerted action of unprecedented political, including significant falls in interest rates, which contained the overall systemic risk, reduced uncertainty and increased confidence of economic agents. In the specific case of the Portuguese economy should be observed a contraction of 2.7 per cent of GDP. Although the increase in the risk of credit in Portugal across the various segments of credit, this was particularly marked in the case of loans to households for consumption and other purposes as well as loans to corporations, being much more mitigated in loans to households for house purchase.
Several factors contribute to this differentiation. First, with regard to credit for purchase of housing, it should be noted that the lower-income households have a very low participation in this market. Moreover, despite the high level of
household debt, the median ratio of debt service of Portuguese families, including younger and generally more vulnerable, is less than the countries of euro area for which data are available. This is due to the maturity of housing loans tending to be longer in Portugal, which allows smooth debt service. On the other hand, a lot of credit for housing in addition to collateral, have linked securities such as guarantees for young families, helping to reduce the risk of these loans. Finally, the available evidence suggests the absence of excessive valuations in housing prices at the aggregate level.
With regard to loans for consumption and other purposes which represent about 20 percent of loans to households, the situation is different since it has enhanced the access to this market of families with intermediate levels of income and those in which the representative is relatively young. However, the biggest credit risk normally associated with these loans, have been incorporated by banks in spreads of interest rates and higher fees.
In the case of loans to non-financial corporations, the rise in failure, though widespread, was not uniform by sector of activity, especially marked in the construction and real estate, representing about 40 percent of loans to non-financial corporations. These sectors are particularly sensitive to the economic cycle and have debt levels relatively high. In fact, these companies tend to show higher levels of debt and lower profitability, and the profile cuts across different sectors. One of the key aspects of the loan portfolio of Portuguese banks is its concentration on very high exposures, associated with larger companies, which tend to have lower default levels.
PAGE 16/24
is therefore expected a further deceleration of activity of banks. The dynamics of more recent loans clearly points to a further reduction in the rate of annual growth in credit to non-financial corporations, although those relating to loans to
individuals suggest stabilization of annual growth rates at low levels. In turn, it is also expected a further slowdown in customer deposits.
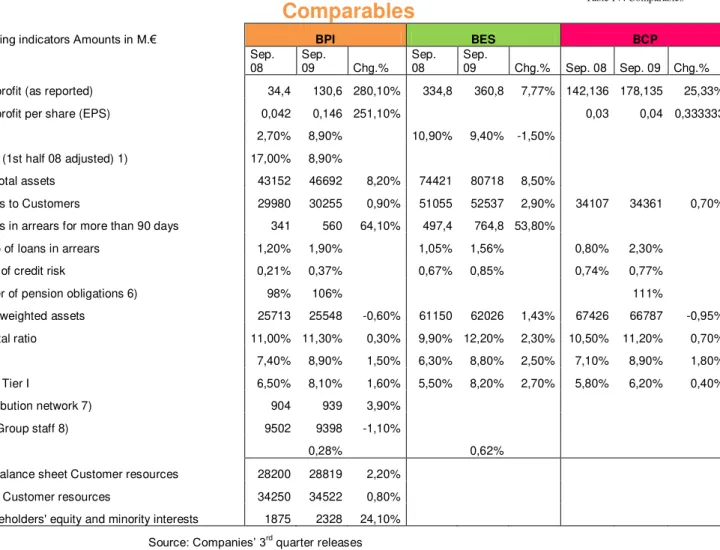
Comparables
Comparables
Leading indicators Amounts in M.€ BPI BES BCP
Sep. 08
Sep.
09 Chg.%
Sep. 08
Sep.
09 Chg.% Sep. 08 Sep. 09 Chg.%
Net profit (as reported) 34,4 130,6 280,10% 334,8 360,8 7,77% 142,136 178,135 25,33%
Net profit per share (EPS) 0,042 0,146 251,10% 0,03 0,04 0,333333
ROE 2,70% 8,90% 10,90% 9,40% -1,50%
ROE (1st half 08 adjusted) 1) 17,00% 8,90%
Net total assets 43152 46692 8,20% 74421 80718 8,50%
Loans to Customers 29980 30255 0,90% 51055 52537 2,90% 34107 34361 0,70%
Loans in arrears for more than 90 days 341 560 64,10% 497,4 764,8 53,80%
Ratio of loans in arrears 1,20% 1,90% 1,05% 1,56% 0,80% 2,30%
Cost of credit risk 0,21% 0,37% 0,67% 0,85% 0,74% 0,77%
Cover of pension obligations 6) 98% 106% 111%
Risk weighted assets 25713 25548 -0,60% 61150 62026 1,43% 67426 66787 -0,95%
Capital ratio 11,00% 11,30% 0,30% 9,90% 12,20% 2,30% 10,50% 11,20% 0,70%
Tier I 7,40% 8,90% 1,50% 6,30% 8,80% 2,50% 7,10% 8,90% 1,80%
Core Tier I 6,50% 8,10% 1,60% 5,50% 8,20% 2,70% 5,80% 6,20% 0,40%
Distribution network 7) 904 939 3,90%
BPI Group staff 8) 9502 9398 -1,10%
ROA 0,28% 0,62%
On-balance sheet Customer resources 28200 28819 2,20%
Total Customer resources 34250 34522 0,80%
Shareholders' equity and minority interests 1875 2328 24,10%
Source: Companies’ 3rd
quarter releases
Table IV: Comparables
PAGE 17/24 Source: Euronext
PAGE 18/24
For the majority of the Angolan banks, 2008 was a year of strong growth, also in line with what happened in the previous years, and the economic growth that Angola had that same period.
But the country was on the sidelines of the international financial crisis and its effects were soon to be felt in 2009, particularly from the second quarter -coinciding with the reaction of the lower receipts from exports oil and a substantial decrease in net international reserves of the country. The increase in the rate of reserve requirement for 30% and exigency of representation of national currency resulted in a reduction of liquidity in the financial system regarding kwanzas and a drop in return on assets of commercial banks.
Moreover, the reduced supply of foreign currency and strict compliance with the Foreign Exchange Law in force caused some delays in carrying out some operations.
Even though, according to responsible of banks operating in Angola, in 2010 the development prospects of the financial system are favorable, taking into account the growth of the country, a more flexibility of monetary policy and in the
investment that most banks will take to increase their presence throughout the country, to qualify their resources and to increase the efficiency of their business.
International Valuation
Discounted cash to equity value:
NPV ten year free cash flow 572,21
NPV terminal value 118,22
Value of shareholders' funds 690,42
Shares issued (million) 900,00
Value per share (Eur) 0,77
We estimate an adjusted net profit 2008-11E CAGR of 26%.
We estimate average revenue and costs growth up to 8% in 2008-11E. With its market exposure reduced to a minimum we expect more or less stable
provisioning charges.
Financials
Net Interest Income
PAGE 19/24
funding costs to pass to consumers in the form of higher spreads, but it will not be an easy task to improve margins in the current environment. The bank has been increasing the spreads charged on loans. And this is something that started quite a while ago, but this takes time to produce tax, because part of the portfolio is medium and long term. So, the share of the loan portfolio that can be re-priced to new loans is smaller than the deposits that are re-priced. Actually, quite interesting re-pricing had been achieved on new loans, once that can´t be done on ongoing loans, due to the contracts already established with the clients. So this is one area of improvement, or at least of damage control of the evolution of the margin. As to impairment, in what concerns Angola, there’s a strong provisioning in the third quarter. There isn’t an impairment model equal to the same that we use in Portugal. We apply the rules of the Banco Nacional de Angola, and the level of provisions in part has to do with time, how time goes and whether the loans stay in arrears. And so, higher values aren’t due to new situations, but to existing
situations that reach certain thresholds in terms of the rules for defining the positions.
Fees & Commissions
Commissions should fall ?% in 2009 (-?% in domestic and +?% in international operations), still suffering from a less favorable outlook for capital market related fees, which should affect asset management, brokerage and IPO fees, but positively impacted by the increase in other type of commissions, such as overdraft commissions.
We highlight the expected growth of 3% in commercial banking commissions, which represent about two thirds of total domestic commissions, reflecting the aggressive increase of retail commissions already in place. For investment banking, we expect a similar level as the one observed in 2008, having had declined 30% in this period.
Trading
Trading should increase from the levels of a “typical” year and reflect the improvement on capital markets conditions.
Profit from financial operations was negatively impacted last year, this year BPI has €4.5 million gain on equity trading and €36.6 million of gains on bonds. International contribution should continue to be positive. Nevertheless, the lack of visibility in this area makes us choose a cautious stance and predict a modest growth.
PAGE 20/24
Loans to individuals play an important role on BPI’s income, especially mortgage loans. Comparatively BPI has the greater weight within the Portuguese banks incorporating PSI20.
This item is influenced by macroeconomic variables such as income,
unemployment and savings rates. Attending to those rates, the wealth of the Portuguese is expected to decrease what results in relatively low growth rates regarding this earnings asset.
BPI has a leadership position in the lines of credit that the government created to face the economic crisis and helped small and medium-sized companies. Cost of credit risk was 37 basis points and the return of the pension funds non-annualized or year-to-date was 14%.
Deposits from Customers
PAGE 21/24
Appendix
Financial Statements
Domestic activity
Balance sheet
Amounts expressed in millions of euro/ Nominal values
2007 2008 2009e 2010e 2011e 2012e 2013e 2014e
Assets
Cash and deposits at central banks 845,4 649,0 746,4 768,7 791,8 815,6 840,0 865,2
Credit Institutions (claims on banks) 1 710,9 3 121,4 3 168,2 3 215,7 3 264,0 3 312,9 3 362,6 2 919,7
Loans and advances to Customers 26 269,4 28 040,5 28 881,7 30 325,8 31 842,1 33 434,2 35 105,9 36 861,2
Financial assets held for dealing 4 114,6 1 379,1 1 443,9 1 511,8 1 582,8 1 657,2 1 735,1 1 816,7
Financial assets available for sale 3 500,0 2 735,2 2 759,8 2 784,7 2 809,7 2 835,0 2 860,5 2 886,3
Financial assets held to maturity - 407,7 403,6 399,6 395,6 391,6 387,7 383,8
Hedging derivatives 412,2 484,4 525,6 549,2 573,9 599,8 626,8 655,0
Investments in associated companies and jointly controlled entities 137,9 121,9 123,5 125,1 126,7 128,4 130,0 131,7
Other tangible assets 238,1 237,1 194,4 196,9 199,5 202,1 204,7 207,4
Intangible assets 14,6 14,1 14,0 13,8 13,7 13,5 13,4 13,3
Tax assets 141,4 250,4 250,4 250,4 250,4 250,4 250,4 250,4
Other assets 800,2 1 160,5 1 392,6 1 671,1 1 344,1 1 165,0 1 223,2 1 284,4
Total assets 38 184,5 38 601,2 39 904,1 41 812,9 43 194,4 44 805,7 46 740,5 48 275,0
Liabilities and shareholders' equity
Resources of central banks - - - -
Resources of other credit institutions 3 681,7 1 970,8 1 826,9 1 881,7 1 938,2 1 996,3 2 056,2 2 117,9
Resources of Customers and other loans 18 644,7 21 738,6 22 064,7 22 726,6 23 408,4 24 110,7 24 834,0 25 579,0
Debt securities 5 341,9 6 417,8 6 937,6 7 499,6 8 107,1 8 763,7 9 473,6 10 241,0
Technical provisions 2 774,6 2 246,4 2 134,1 2 038,0 1 946,3 1 858,7 2 019,1 1 928,3
Financial liabilities associated to transferred assets 3 008,2 2 070,8 2 070,8 2 070,8 2 070,8 2 070,8 2 070,8 2 070,8
Hedging derivatives 544,6 596,5 644,2 676,4 710,3 745,8 1 027,1 1 078,4
Provisions 57,5 58,8 67,7 67,7 67,7 67,7 67,7 67,7
Tax liabilities 95,3 37,4 39,3 39,3 39,3 39,3 39,3 39,3
Participating bonds 27,3 28,7 29,5 30,3 30,3 30,3 30,3 30,3
Subordinated debt 930,8 767,6 767,6 767,6 767,6 767,6 767,6 767,6
Other liabilities 1 443,6 1 111,0 1 682,1 2 287,3 2 287,3 2 287,3 2 287,3 2 287,3
Treasury Stock 1 364,1 1 292,3 1 375,0 1 463,0 1 556,6 1 556,6 1 556,6 1 556,6
Minority interests 270,3 264,5 264,5 264,5 264,5 510,8 510,8 510,8
Shareholders' equity and minority interests 1 634,4 1 556,8 1 639,5 1 727,5 1 821,1 2 067,5 2 067,5 2 067,5
PAGE 22/24
BPI Group
Domestic P&L account
Amounts expressed in millions of euro/ Nominal values
2007 2008 2009e 2010e 2011e 2012e 2013e 2014e 2015e
Net interest income 530,7 503,7 467,0 513,7 549,7 615,6 646,4 657,3 668,3
Commissions and other similar income (net) 298,5 255,8 137,3 151,0 169,2 171,2 179,7 182,8 185,8
Gains and losses in financial operations 176,1 (20,2) 121,2 133,3 157,3 159,2 167,2 170,0 172,8
Net operating income 1 019,3 918,6 725,5 798,1 876,1 946,0 993,3 1 010,0 1 027,0
Personnel costs 353,8 387,0 351,2 386,3 394,0 398,8 418,7 425,7 432,9
Other administrative expenses 203,0 196,0 198,8 218,7 223,1 225,7 237,0 241,0 245,0
Depreciation of fixed assets 36,4 40,5 38,8 42,7 43,5 44,1 46,3 47,0 47,8
Administrative overheads, amortisation and depreciation 593,2 623,5 588,8 647,7 660,6 668,6 702,0 713,8 725,8
Costs (Total exclud. deprec) 556,8 583,0 550,0 605,0 617,1 624,5 655,7 666,7 677,9
Operating profit before provisions 426,1 295,1 136,7 150,4 215,5 277,4 291,3 296,2 301,2
Loan provisions and impairments -Recovery of loans
written-off 84,0 133,9 86,4 95,0 96,9 98,1 103,0 104,7 106,5
Other impairments and provisions 14,8 139,4 30,4 33,4 34,1 34,5 36,2 36,9 37,5
Total Provisions 98,8 273,3 116,8 128,5 131,0 132,6 139,3 141,6 144,0
Profits before taxes 348,1 47,5 75,9 83,5 147,3 208,4 218,8 222,5 226,2
Corporate income tax 77,6 24,6 26,4 29,0 29,6 30,0 31,5 32,0 32,5
Equity-accounted results of subsidiaries 24,4 5,2 16,0 24,4 24,9 25,2 26,4 26,9 27,3
Minority shareholders' share of profit 16,8 18,4 7,2 7,9 8,1 8,2 8,6 8,7 8,9
PAGE 23/24
International activity
Balance sheet
Amounts expressed in millions of euro/ Nominal Values
2007 2008 2009e 2010e 2011e 2012e 2013e 2014e 2015e
Assets
Cash and deposits at central banks 281,0 439,3 932,3 932,3 932,3 932,3 932,3 932,3 932,3
Loans and advances to Customers 961,1 1 234,7 1 250,5 1 500,6 1 523,1 1 546,0 1 569,1 1 592,7 1 616,6
Financial assets held for dealing 476,8 1 474,5 1 052,5 804,4 844,6 886,8 931,2 977,8 1 026,6
Financial assets available for sale 425,4 527,4 1 200,8 1 257,2 1 316,3 1 378,2 1 443,0 1 510,8 1 581,8
Hedging derivatives - - - - 12,1 16,0 19,9 23,8 23,6
Investments in associated companies and jointly controlled entities 13,1 15,9 16,4 17,1 0,0 0,0 0,0 0,0 26,2
Other tangible assets 78,8 94,6 105,5 106,9 24,5 22,8 21,2 19,5 19,7
Intangible assets 0,9 1,3 1,2 1,2 79,6 80,6 81,6 82,7 27,8
Tax assets - - - - 1,2 1,2 1,2 1,2 1,2
Other assets 12,8 4,6 41,1 41,1 12,9 13,6 14,2 9,3 22,2
Total assets 2 361,4 4 402,2 5 073,0 4 660,9 4 746,6 4 877,6 5 013,8 5 150,1 5 278,0
Liabilities and shareholders' equity
Resources of other credit institutions 50,2 36,6 58,3 58,3 46,6 46,6 46,6 46,6 46,6
Resources of Customers and other loans 1 977,2 3 895,1 3 995,7 4 115,6 4 239,0 4 366,2 4 497,2 4 632,1 4 771,1
Provisions 15,4 18,7 21,8 22,9 24,0 25,2 26,5 27,8 29,2
Tax liabilities 30,0 25,4 13,2 13,2 13,2 13,2 13,2 13,2 13,2
Other liabilities 17,6 21,6 27,2 27,2 27,2 29,8 33,8 33,8 21,4
Shareholders' equity and minority interests 271,0 205,8 244,2 244,2 201,4 201,4 201,4 201,4 201,4
Minority interests - 199,0 234,2 179,5 195,1 195,1 195,1 195,1 195,1
Shareholders' equity 271,1 404,8 478,4 423,7 396,5 396,5 396,5 396,5 396,5
Total liabilities and shareholders' equity 2 361,4 4 402,2 5 073,0 4 660,9 4 746,6 4 877,6 5 013,8 5 150,1 5 278,0
BPI Group
International P&L account
Amounts expressed in millions of euro
Nominal Values
2007 2008 2009e 2010e 2011e 2012e 2013e 2014e 2015e 2016e 2017e 2018e
Net interest income 131,2 172,5 186,3 201,2 217,3 234,7 241,7 249,0 256,4 264,1 272,1 280,2
Commissions and other similar income (net) 44,1 49,7 53,7 58,0 62,6 67,6 69,6 71,7 73,9 76,1 78,4 80,7
Gains and losses in financial operations 21,5 40,8 44,1 47,6 51,4 55,5 59,9 61,7 63,6 65,5 67,5 69,5
Net operating income 196,8 263,0 284,0 306,8 331,3 357,8 371,3 382,5 393,9 405,7 417,9 430,5
Total Operating Costs 51,0 62,2 67,2 72,6 78,4 84,6 91,4 94,1 97,0 99,9 102,9 105,9
Depreciation of fixed assets 9,0 12,0 13,0 14,0 15,1 16,3 17,6 18,2 18,7 19,3 19,8 20,4
Total Costs and Depreciation 60,0 74,2 80,1 86,5 93,5 100,9 109,0 112,3 115,7 119,1 122,7 126,4
Operating profit before provisions 136,2 189,0 204,1 220,4 238,1 257,1 277,7 286,0 294,6 303,5 312,6 321,9
Provisioning and Impaiment 31,9 16,9 18,3 19,7 21,3 23,0 24,8 25,6 26,3 27,1 27,9 28,8
Profits before taxes 104,3 172,1 185,9 200,7 216,8 234,1 252,9 260,5 268,3 276,3 284,6 293,1
Corporate income tax 31,0 26,8 28,9 31,3 33,8 36,5 39,4 40,6 41,8 43,0 44,3 45,6
Equity-accounted results of subsidiaries 3,6 4,5 4,9 5,2 5,7 6,1 6,6 6,8 7,0 7,2 7,4 7,7
Minority shareholders' share of profit - 9,3 10,0 10,8 11,7 12,7 13,7 14,1 14,5 14,9 15,4 15,8
PAGE 24/24
Disclosures and Disclaimer
Research Recommendations
Buy Expected total return (including dividends) of more than 15% over a 12-month period.
Hold Expected total return (including dividends) between 0% and 15% over a 12-month period.
Sell Expected negative total return (including dividends) over a 12-month period.
This report has been prepared by a Masters of Finance student following the Equity Research – Field Lab Work Project for exclusively academic purposes. Thus, the author is the sole responsible for the information and estimates contained herein and for the opinions expressed, which exclusively reflect his/her own personal judgement. All opinions and estimates are subject to change without notice. NOVA or its faculty accepts no responsibility whatsoever for the content of this report nor for any consequences of its use. The information contained herein has been compiled by students from public sources believed to be reliable, but NOVA or the students make no representation that it is accurate or complete and accept no liability whatsoever for any direct or indirect loss resulting from the use of this report or its content.
The author hereby certifies that the views expressed in this report accurately reflect his/her personal opinion about the subject company and its securities. He/she has not received or been promised any direct or indirect compensation for expressing the opinions or recommendation included in this report.
The author of this report may have a position, or otherwise be interested, in transactions in securities which are directly or indirectly the subject of this report.
NOVA may have received compensation from the subject company during the last 12 months related to its fund raising program. Nevertheless, no compensation eventually received by NOVA is in any way related to or dependent on the opinions expressed in this report.
The School of Economics and Management at NOVA is a public university thus not dealing for, advising or otherwise offering any investment or intermediate services to market counterparties, private or intermediate customers.