www.hydrol-earth-syst-sci.net/20/3581/2016/ doi:10.5194/hess-20-3581-2016
© Author(s) 2016. CC Attribution 3.0 License.
Using radon to understand parafluvial flows and the changing
locations of groundwater inflows in the Avon River, southeast
Australia
Ian Cartwright1,2and Harald Hofmann2,3
1School of Earth, Atmosphere and Environment, Monash University, Clayton, Vic. 3800, Australia
2National Centre for Groundwater Research and Training, GPO Box 2100, Flinders University, Adelaide, SA 5001, Australia 3School of Earth Sciences, The University of Queensland, St. Lucia, QLD 4072, Australia
Correspondence to:Ian Cartwright ([email protected])
Received: 28 July 2015 – Published in Hydrol. Earth Syst. Sci. Discuss.: 10 September 2015 Revised: 4 May 2016 – Accepted: 7 August 2016 – Published: 6 September 2016
Abstract. Understanding the location and magnitude of groundwater inflows to rivers is important for the protection of riverine ecosystems and the management of connected groundwater and surface water systems. This study utilizes
222Rn activities and Cl concentrations in the Avon River,
southeast Australia, to determine the distribution of ground-water inflows and to understand the importance of paraflu-vial flow on the222Rn budget. The distribution of222Rn ac-tivities and Cl concentrations implies that the Avon River contains alternating gaining and losing reaches. The loca-tion of groundwater inflows changed as a result of major floods in 2011–2013 that caused significant movement of the floodplain sediments. The floodplain of the Avon River com-prises unconsolidated coarse-grained sediments with numer-ous point bars and sediment banks through which significant parafluvial flow is likely. The 222Rn activities in the Avon
River, which are locally up to 3690 Bq m−3, result from a
combination of groundwater inflows and the input of wa-ter from the parafluvial zone that has high 222Rn activities
due to 222Rn emanation from the alluvial sediments. If the high222Rn activities were ascribed solely to groundwater in-flows, the calculated net groundwater inflows would exceed the measured increase in streamflow along the river by up to 490 % at low streamflows. Uncertainties in the222Rn
ac-tivities of groundwater, the gas transfer coefficient, and the degree of hyporheic exchange cannot explain a discrepancy of this magnitude. The proposed model of parafluvial flow envisages that water enters the alluvial sediments in reaches where the river is losing and subsequently re-enters the river in the gaining reaches with flow paths of tens to hundreds
of metres. Parafluvial flow is likely to be important in rivers with coarse-grained alluvial sediments on their floodplains and failure to quantify the input of222Rn from parafluvial
flow will result in overestimating groundwater inflows to rivers.
1 Introduction
Quantifying groundwater inflows to streams and rivers is critical to understanding hydrogeological systems, protect-ing riverine ecosystems, and managprotect-ing water resources (e.g. Winter, 1999; Sophocleous, 2002; Brodie et al., 2007). Groundwater inflows may form the majority of water in gaining rivers during periods of low streamflow, and river-ine ecosystems are commonly sustariver-ined by groundwater in-flows at those times (Kløve et al., 2011; Barron et al., 2012; Cartwright and Gilfedder, 2015). Thus, understanding the distribution and magnitude of groundwater inflows is impor-tant for managing and protecting these commonly vulnerable ecosystems. Failure to understand groundwater contributions to rivers may also result in the double allocation of water re-sources (i.e. surface water and groundwater allocations might represent the same water). Documenting the distribution and quantity of groundwater inflows to rivers is also required for flood forecasting, understanding the impacts of contaminants on rivers, and assessing the potential impacts of climate or land use changes on river systems.
groundwater on anything other than a regional scale. In these cases geochemical tracers provide an alternative tool to understand groundwater–river interaction. Providing that groundwater and surface water have significantly differ-ent geochemistry, changes in the geochemistry of the river may be used to map and quantify groundwater inflows (e.g. Cook, 2013). Tracers such as major ions, stable isotopes, ra-dioactive isotopes, and chlorofluorocarbons have been used to quantify groundwater inflows to rivers (e.g. Ellins et al., 1990; Genereux and Hemond, 1992; Négrel et al., 2001; Stellato et al., 2008; Cartwright et al., 2011, 2014; Cook, 2013; Bourke et al., 2014a, b). Geochemical tracers only quantify groundwater inflows, and while they are commonly used to determine the distribution of gaining and losing reaches, they do not quantify the magnitude of any ground-water outflows.
River water also interacts with the sediments beneath and adjacent to the streams in the hyporheic and paraflu-vial zones. The hyporheic zone comprises the sediments of the streambed and sides through which the river water flows due to irregularities in the streambed, and hyporheic flow generally occurs on the centimetre to tens of centime-tres scale (Boulton et al., 1998). In rivers that have coarse-grained unconsolidated sediments on their floodplain, metre to hundreds of metres scale parafluvial flow may also occur (Holmes et al., 1994; Edwardson et al., 2003; Cartwright et al., 2014; Bourke et al., 2014a; Briody et al., 2016). By con-trast with hyporheic exchange that occurs along the entire river, water enters the parafluvial zone in river reaches that are losing and then re-enters the river where it is gaining, aug-menting the groundwater inflows. Both hyporheic exchange and parafluvial flow may impact the geochemistry of the rivers (Boulton et al., 1998; Edwardson et al., 2003; Cook et al., 2006; Cartwright et al., 2014; Bourke et al., 2014a; Briody et al., 2016) and must be taken into account when us-ing geochemical tracers to determine groundwater inflows to rivers.
1.1 222Rn as a tracer of groundwater inflows
222Rn, which is an intermediate isotope in the238U to206Pb
decay series, is an important tracer for quantifying ground-water inflows to rivers.222Rn has a half-life of 3.8 days and the activity of222Rn reaches secular equilibrium with its par-ent isotope226Ra over 3–4 weeks (Cecil and Green, 2000).
Because226Ra activities in minerals in the aquifer matrix are
several orders of magnitude higher than those in surface wa-ter, groundwater222Rn activities are commonly 2 or 3 orders
of magnitude higher than those of surface water (Cecil and Green, 2000). This makes222Rn a viable tracer of
ground-water inflows in catchments where the groundground-water has sim-ilar major ion concentrations and/or stable isotope ratios to the river water. As 222Rn activities in rivers decline
down-stream from regions of groundwater inflow due to radioactive decay and degassing to the atmosphere (Ellins et al., 1990;
Genereux and Hemond, 1992),222Rn is also useful in
deter-mining locations of groundwater inflow, even if the inflows are not quantified.
The successful application of222Rn to determine
ground-water inflows, however, requires careful consideration of sev-eral processes and uncertainties.222Rn activities in
ground-water may be spatially or temporally heterogeneous (Cook et al., 2006; Mullinger et al., 2007; Unland et al., 2013; Yu et al., 2013; Cartwright et al., 2011; Atkinson et al., 2015). Additionally, while it is well established that the rate of
222Rn degassing increases with increasing river turbulence
and decreasing river depth, it is difficult to reliably quan-tify the rate of degassing (Genereux and Hemond, 1992; Mullinger et al., 2007; Cook, 2013; Cartwright et al., 2014). Finally, in rivers that run through coarse alluvial sediments, water from the hyporheic or parafluvial zones may provide a source of additional 222Rn to groundwater inflow (Cook
et al., 2006; Cartwright et al., 2014; Bourke et al., 2014a). As has been outlined in several studies, comparison of the calculated groundwater inflows from222Rn with those made
from other geochemical tracers or with streamflow measure-ments is a crucial test of the calculations (Cook et al., 2003, 2006; Mullinger et al., 2007, 2009; Cartwright et al., 2011, 2014; McCallum et al., 2012; Unland et al., 2013). Carrying out studies at baseflow conditions when most of the water contributing to the streams is from groundwater inflows al-lows for a comparison between the calculated groundwater inflows and the observed increase in streamflows, which in turn provides for a test of the parameters used in the222Rn mass balance (Cartwright et al., 2014).
1.2 Objectives
This paper examines groundwater–river interaction in the Avon River, southeast Australia, primarily using 222Rn as
a tracer. The incised nature of the Avon River and the fact that it rarely ceases to flow has led to an assumption that it receives significant groundwater inflows (Gippsland Wa-ter, 2012). There has been little attempt, however, to quan-tify groundwater inflows or determine their distribution, and there are insufficient groundwater monitoring bores in the catchment to understand the relationship of groundwater to the river using hydraulic data. Understanding groundwater– river interaction is required to protect and manage the Avon River, especially in assessing the potential impacts of in-creased groundwater or surface water use.
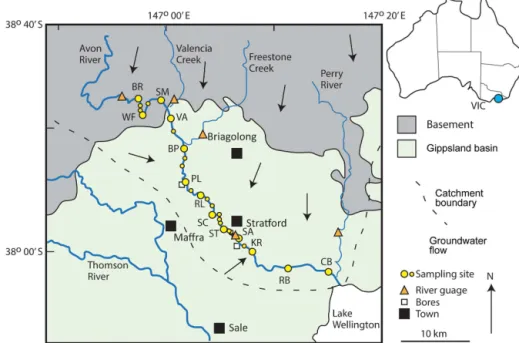
Figure 1.Summary geological and hydrogeological map of the Avon River catchment (Hofmann and Cartwright, 2015; Department of Environment and Primary Industries, 2015). Arrows show general direction of groundwater flow. Main sampling sites (in order of distance downstream are) are BR: Browns, WF: Wombat Flat, SM: Smyths Road, VA: Valencia, BP: Bushy Park, PL: Pearces Lane, RL: Ridleys Lane, SC: Schools Lane, ST: Stewarts Lane, SA: Stratford, KR: Knobs Reserve, RB: Redbank, CB: Chinns Bridge. Unnamed sampling sites are the additional sites from February 2015 (Table A1).
Avon River floodplain comprises coarse-grained unconsoli-dated alluvial sediments with gravel banks, point bars, and pool and riffle sections that likely host parafluvial flows. Rivers with similar coarse-grained sediments on their flood-plains are common at mountain fronts and parafluvial flow is likely to be an important process in these settings. Despite parafluvial inflows being a potential important contributor of
222Rn budget to rivers, few studies have explicitly
consid-ered this process in the222Rn mass balance (e.g. Bourke et
al., 2014a; Cartwright et al., 2014). Thus, the results of this study will help improve the general utility of222Rn as a tracer
of groundwater inflows into rivers.
2 The Avon catchment
The Avon River is an unregulated river in the Gippsland Basin of southeast Australia (Fig. 1) that has a total catch-ment area of∼1830 km2(Cochrane et al., 1991; Department of Environment and Primary Industries, 2015). It drains the southern slopes of the Victorian Alps (maximum elevation in the catchment is 1634 m) and discharges into Lake Welling-ton, which is a coastal saline lake connected to the South-ern Ocean. The highland areas represent∼30 % of the Avon catchment and are dominated by temperate native eucalyp-tus forest, whereas the majority of the plains representing ∼70 % of the catchment have been cleared for agriculture, which includes dairying, sheep grazing, and vegetable
pro-duction. The estimated population of the Avon catchment is∼4000 with Stratford being the largest town (population ∼2000).
The highlands of the Victorian Alps comprise indurated Palaeozoic and Mesozoic igneous rocks and metasedi-ments that only host groundwater flow in fractures or in near-surface weathered zones (Walker and Mollica, 1990; Cochrane et al., 1991). These rocks form the basement to the Tertiary and Quaternary sediments of the Gippsland Basin (Fig. 1). The shallowest regional aquifer within the Avon catchment is the Pliocene to Pleistocene Haunted Hill For-mation which comprises up to 40 m of interbedded alluvial sands and clays that have hydraulic conductivities between 10−7 and 10−5m s−1 (Brumley et al., 1982; Walker and
Mollica, 1990). Quaternary sediments that consist of coarse-grained sand and gravels interbedded with finer-coarse-grained silts occur mainly within the river valleys and have hydraulic con-ductivities of 10−5 and 10−2m s−1 (Brumley et al., 1982;
Walker and Mollica, 1990).
influ-ence. Streamflow is measured continuously at three sites (the Channel, Stratford, and Chinns Bridge; Fig. 1). Total annual streamflow at Stratford between 1977 and 2014 was between 1.3×10⁷and 9.0×10⁸m3yr−1(median=3.0×10⁸m3yr−1) and varied with total annual rainfall (Department of Environ-ment and Primary Industries, 2015). The Avon River only ceases to flow during the summers of severe drought years (e.g. 1983) and experiences periodic floods during high rain-fall periods (Fig. 2). Streamflow generally increases down-stream at all times, except at very low flows when down- stream-flow decreases between Stratford and Chinns Bridge. Valen-cia Creek and Freestone Creek are the main tributaries; both have streamflow measurements (Department of Environment and Primary Industries, 2015) and enter the Avon in the up-per reaches of the studied section (Fig. 1).
The Avon River has incised through the Haunted Hill and Quaternary sediments to create terraces that are up to 30 m high with a lower floodplain that is up to 500 m wide. Where it crosses the sedimentary plains, the Avon River comprises a sequence of slow-flowing pools that are typically 10–30 m wide, up to 2 m deep at low flows, and up to 2 km long. These pools are connected by shorter (typically ten to hundreds of metres long) and narrow (typically<5 m) faster-flowing rif-fle sections that commonly have steep longitudinal gradients. The floodplain of the Avon River between Browns (0.0 km) and Redbank (41.3 km) (Fig. 1) comprises numer-ous gravel banks and point bars of coarse-gained immature unconsolidated sediments with clasts of up to 50 cm in di-ameter. In regions where the river is incised, there are seeps of water at the base of the slope and permanent patches of water-tolerant vegetation. The alluvial sediments on the floodplain are sparsely vegetated and the geometry of the floodplain changes markedly following major flood events, such as those in 2011, 2012, and 2013 (Fig. 2). These changes include the downstream migration of pools (often by several tens of metres), scouring of the alluvial sediments, and changes to the location of the sediment banks. Down-stream of Redbank, the Avon River occupies an incised chan-nel with banks of finer-grained (clay- to sand-sized) sedi-ments. The banks and floodplain are more vegetated and do not change markedly during the flood events.
Groundwater flows from the Victorian Alps to the coast (Hofmann and Cartwright, 2013; Fig. 1). Use of water from the Avon River and its tributaries for irrigation is up to 8×10⁶m3yr−1(∼2.6 % of the median annual streamflow at Stratford); however, there is a prohibition on river water use when the streamflow at Stratford is<104m3day−1 (Gipps-land Water, 2012).
Figure 2. (a) Variation in streamflow at Stratford (Fig. 1)
be-tween January 2009 and February 2015. The major floods (high-lighted) caused significant changes to the geometry of the flood-plain.(b)Flow frequency curve for Stratford for streamflows be-tween January 2000 and March 2015 and the percentiles of dis-charge in the sampling campaigns (data from Department of Envi-ronment and Primary Industries, 2015).
3 Methods 3.1 Sampling
Environment and Primary Industries, 2015; Fig. 1). Stream-flow was relatively constant during the sampling periods (the variation in streamflow at Stratford over each sampling pe-riod was <5 %). River samples were collected from 0.5 to 1 m below the river surface using a manual collector mounted on a pole. Groundwater was sampled from bores installed on the river bank and floodplain at Stratford and Pearces Lane (Fig. 1) that have 1 to 3 m long screens. Water was extracted using an impeller pump set at the screened interval and at least 3-bore volumes of water were purged before sampling. Water was also extracted from the alluvial gravels at a num-ber of locations along the Avon River during low flow peri-ods either from open holes or from piezometers driven 1–2 m below the surface of the gravels.
3.2 Analytical techniques
Analytical techniques were similar to those in other stud-ies (e.g. Unland et al., 2013; Yu et al., 2013; Cartwright et al., 2014). Cations (Tables A1, A2) were analysed on samples that had been filtered through 0.45 µm cellulose nitrate filters and acidified to pH<2 using a ThermoFinnigan quadrupole ICP-MS at Monash University. Anions (Tables A1, A2) were analysed on filtered unacidified samples using a Metrohm ion chromatograph at Monash University. The precision of major ion concentrations based on replicate analyses is 2– 5 %. A suite of anions and cations were measured; however, only Cl and Na are discussed in this study.222Rn activities in
groundwater (Table A2) and surface water (Table A1) were determined using a portable radon-in-air monitor (RAD-7, Durridge Co.) following methods described by (Burnett and Dulaiova, 2006) and are expressed in becquerels per m3of
water (Bq m−3). A sample of 0.5 L was collected by bottom
filling a glass flask and222Rn was subsequently degassed for
5 min into a closed air loop of known volume. Counting times were 2 h for surface water and 20 min for groundwater. Typ-ical relative precision based on repeat sample measurements in this and other studies (e.g. Cartwright et al., 2011, 2014) is<3 % at 10 000 Bq m−3and∼10 % at 100 Bq m−3.
A total of 44 samples of riverbed sediments from sites along the Avon River were collected in March 2014 and February 2015.222Rn emanation rates (γ) from these were determined by sealing a known dry weight of sediment in airtight containers with water and allowing 222Rn to
accu-mulate (Lamontagne and Cook, 2007). Following incubation of 4–5 weeks, by which time the rate of222Rn production and
decay will have reached steady state, 20–40 mL of pore wa-ter was extracted and analysed for222Rn activities using the
same method as above but with counting times of 6–12 h.γ (Table 2) was calculated from222Rn produced per unit mass
of sedimentEm, sediment densityρs, and porosityϕby
γ =Em(1−ϕ) ρsλ
ϕ (1)
(parameters summarized in Table 1).
3.3 Radon mass balance
Assuming that the atmosphere contains negligible radon, the change in222Rn activities along a river is
Qdcr
dx =I cgw−cr
+wEcr+Fh+Fp−kdwcr−λdwcr (2)
(modified from Mullinger et al., 2007; Cartwright et al., 2011; and Cook, 2013). In Eq. (2)Qis streamflow; cr andcgware the 222Rn activities in the river and groundwa-ter, respectively;I is the groundwater flux per unit length of river;Eis the evaporation rate;xis distance along the river; wis river width;d is river depth;Fh andFpare the inputs
of 222Rn resulting from exchange with the hyporheic zone
and inflows of parafluvial waters, respectively;kis the gas-transfer coefficient; andλ is the decay constant (Table 1). A similar mass balance also applies to major ion concentra-tions. Since the concentration of a conservative tracer such as Cl is controlled only by groundwater inflows and evapora-tion, only the first two terms on the right-hand side of Eq. (2) are relevant. If the river is gaining throughout and solely fed by groundwater, the increase in streamflow downstream is dQ
dx =I−Ew. (3)
The222Rn activity in the hyporheic zone waters (ch) is
gov-erned by the222Rn activity of the water flowing into the hy-porheic zone (cin), the222Rn emanation rateγ, and the resi-dence timeth:
ch= γ
λ−cin
1−e−λth
+cin (4)
(Hoehn et al., 1992; Hoehn and Cirpka, 2006) (Fig. 3a). An identical expression relates the222Rn activity in the
paraflu-vial zone waters (cp) to the residence time of that water in the
parafluvial zone (tp).chincreases withthuntil secular
equi-librium is approached at which pointch=γ /λ. In a losing or neutral (i.e. neither gaining nor losing) rivercin=cr. In
a gaining river, water derived from the river will mix in the alluvial sediments with upwelling regional groundwater that has high222Rn activities. Cartwright et al. (2014) discussed
using the concentration of a conservative ion such as Cl to estimate the degree of mixing within the alluvial sediments to estimatecin. Assuming that all the water entering the hy-porheic zone subsequently re-enters the river, the222Rn flux
from the hyporheic zone (Fh) is
Fh= γ Ahϕ 1+λth
− λAhϕ
1+λthcin, (5)
Table 1.Summary of parameters used in222Rn mass balance.
Symbol Parameter Units Comments
Q Streamflow m3day−1
E Evaporation m day−1
x Distance downstream m
w Stream width m
d Stream depth m
v Stream velocity m day−1
cgw,cr,ch,cp 222Rn activities in groundwater, river, hyporheic zone, parafluvial zone Bq m−3 cin 222Rn activity of water entering the hyporheic or parafluvial zone Bq m−3 k Gas-transfer coefficient day−1
λ Decay constant 0.181 day−1
I Groundwater inflows m3m−1day−1 Eq. (2) Fh 222Rn flux from hyporheic zone Bq m−1day−1 Eq. (5) Fp 222Rn flux from parafluvial zone Bq m−1day−1 Eq. (6) γ 222Rn emanation rate Bq m−3day−1 Eq. (1) Em 222Rn produced from sediments Bq kg−1
ρs Sediment density kg m−3
Ip Inflows from parafluvial zone m3m−1day−1 th,tp Residence time in hyporheic or parafluvial zone day
ϕ Porosity
Vp Volume of sediments that parafluvial inflows interact with m3m−1
Ah, Ap Cross-sectional area of the hyporheic or parafluvial zone m2 Ap=Vp
in222Rn in the hyporheic zone from estimates of emanation
rates and the dimensions of the hyporheic zone.
Equation (5) may also be used to calculatecpfromtpand γ (e.g. Cartwright et al., 2014). However, where parafluvial flow involves long flow paths through alluvial sediments, an alternative conceptualization is to consider the flux of222Rn
into the river at the end of discrete flow paths through the parafluvial zone (Hoehn and Von Gunten, 1989; Hoehn and Cirpka, 2006; Bourke et al., 2014a). In that case,Fpis given
by a similar expression to that which accounts for the input of222Rn due to groundwater inflows:
Fp=Ip cp−cr, (6)
whereIp is the flux of water from the parafluvial zone per
unit length of the river. The minimum Ip required to
pro-duce a givenFpis achieved whencpapproaches steady state
(Fig. 3b), which requiresthto be at least several days (cpis ∼95 % of the steady state activity after 16 days; Fig. 3a). If this less than the time required to achieve steady state,cpis lower, and a higherIpis required to achieve the sameFp. The volume of sediments with which the water has interacted dur-ing flow through the parafluvial zone (Vpin m3per meter of flow path length of river) is governed byIp,tp, andϕ. If the flow paths through the parafluvial zone are regular,Vp will
be the cross-sectional area of the parafluvial zone through which the water from the river flows (Ap):
Vp=Ap=tpIp
ϕ (7)
(Bourke et al., 2014a). For the same input parameters, Eqs. (5) and (6) yield closely similar estimates ofFp(Bourke et al., 2014a) and the least well-known parameters in both cases areApandtp.
There are several approaches that may be used to estimate the rate of222Rn degassing from rivers. Firstly, as degassing
involves diffusion of222Rn through the boundary layer at the
river surface, the stagnant film model yields a gas transfer velocity asD/z(which is closely related tok), wherezis the thickness of the boundary layer at the water surface (Ellins et al., 1990; Stellato et al., 2008).zand by extensionD/zcan be calculated from differences in river222Rn concentrations in losing reaches. The gas transfer coefficientkmay be es-timated in a similar way from the change in222Rn activities in losing reaches (e.g. Cartwright et al., 2011; Cook 2013) or even in gaining reaches if groundwater inflows have been estimated using other tracers, numerical models, streamflow measurements, and/or streambed temperature profiles (Cook et al., 2003; Cartwright et al., 2014; Cartwright and Gilfed-der, 2015). Determiningkorzby comparing calculated and measured222Rn activities requires that the222Rn contributed
from the hyporheic or parafluvial zones is quantified, and that there are no inflows of water from tributaries that may increase or decrease222Rn activities. Sincekvalues are
typ-ically calculated from these methods for a few specific well-understood river reaches, it is possible that they are not valid for all river reaches.
Table 2.222Rn emanation rates from floodplain sediments.
Site∗/Sample
Em γ γ /λ
(Bq kg−1) (Bq m−3day−1) (Bq m−3)
Chinns Bridge 1 2.01 1473 8138 Chinns Bridge 2 4.02 2949 16 293 Wombat Flat 1 4.04 2964 16 376 Wombat Flat 2 4.52 3311 18 295 Wombat Flat 3 4.19 3075 16 988 Wombat Flat 4 6.13 4492 24 819 Valencia 1 3.95 2899 16 016 Valencia 2 1.86 1362 7525 Pearces Lane 1 0.62 454 2506 Pearces Lane 2 3.25 2383 13 167 Pearces Lane 3 1.41 1034 5722 Pearces Lane 4 2.63 1925 10 636 Pearces Lane 5 6.76 4952 27 360 Pearces Lane 6 5.60 4107 22 689 Pearces Lane 7 4.12 3018 16 674 Pearces Lane 8 1.54 1127 6225 Stewarts Lane 1 3.41 2497 13 797 Stewarts Lane 2 5.78 4239 23 418 Stewarts Lane 3 3.08 2258 12 475 Stewarts Lane 4 2.88 2110 11 656 Stewarts Lane 5 4.63 3391 18 732 Stewarts Lane 6 3.64 2669 14 745 Stewarts Lane 7 4.52 3311 18 294 Stewarts Lane 8 4.58 3354 18 530 Stewarts Lane 9 1.96 1434 7925 Stewarts Lane 10 5.09 3733 20 622 Stewarts Lane 11 4.25 3119 17 230 Stewarts Lane 12 3.68 2699 14 910 Stewarts Lane 13 1.77 1294 7150 Stewarts Lane 14 2.89 2122 11 723 Stratford 1 2.13 1563 8634 Stratford 2 0.66 482 2663 Stratford 3 3.01 2206 12 190 Stratford 4 3.77 2762 15 259 Stratford 5 0.39 288 1591 Stratford 6 1.24 911 5032 Stratford 7 2.00 1469 8117 Stratford 8 2.71 1985 10 965 Stratford 9 0.91 668 3692 Stratford 10 1.01 738 4077 Stratford 11 4.55 3334 18 419 Stratford 12 3.13 2293 12 667 Stratford 13 0.81 491 3282
Mean 2308 12 751
σ 1197 6615
∗sites in Fig. 2.
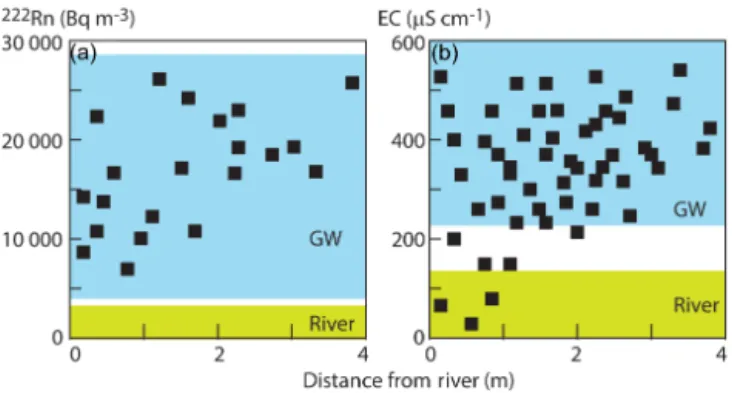
Figure 3. (a)Variation in the222Rn activity in the parafluvial or
hyporheic zone (cporch) with residence time (tporth) and222Rn
emanation rate (γ) (Eq. 3).(b)Variation in the water flux from the parafluvial zone (Ip) with the flux of222Rn from the parafluvial
zone (Fp) andtp(Eq. 5). In both casescr=cin=1000 Bq m−3.
et al., 2012; Bourke et al., 2014a), which has the advantage of estimatingkfor the river being studied. However, such mea-surements are generally made along small reaches of a river that may not be representative of the river as a whole. Addi-tionally, if the experiments were made at specific flow condi-tions, the gas transfer coefficients may or may not be applica-ble to sampling campaigns made at different flow conditions. There are several empirical relationships that estimate k from river velocities (v) and depths. The commonly used O’Connor and Dobbins (1958) and Negulescu and Rojanski (1969) gas transfer equations as modified for222Rn are
k=9.301×10⁻³
v0.5 d1.5
, (8)
k=4.87×10⁻⁴v d
0.85
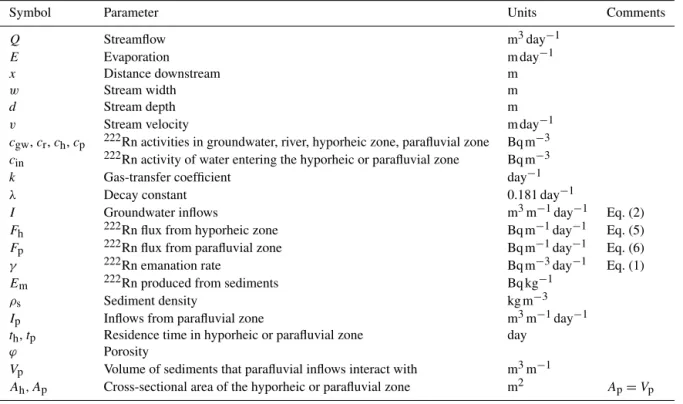
Figure 4.Downstream variations in222Rn activities(a)and Cl concentrations(b)for the six sampling campaigns (data from Table A1,
abbreviations are as for Fig. 2). Closed symbols for February 2015 are from the main sites, open symbols are from the additional sites specific to that sampling campaign (Table A1). Site abbreviations are as for Fig. 1.
conditions and some independent assessment ofk(for exam-ple, by matching the predicted and observed decline in222Rn
activities in losing reaches) is needed.
4 Results 4.1 Streamflow
Between January 2000 and February 2015 streamflow at Stratford varied between 500 and 1.38×10⁸m3day−1 (partment of Environment and Primary Industries, 2015). De-spite this period including years with well below average rainfall (for example, in 2006 when rainfall was∼50 % of the long-term average; Bureau of Meteorology, 2015), there were no periods of zero streamflow. Mean daily streamflows at Stratford during the sampling rounds ranged from 10 670 to 88 800 m3day−1 (Table A1, Fig. 2a) which represent
streamflow percentiles of 39.5–89.9 (Fig. 2b). In February 2015, which is the sampling round discussed in most detail below, the mean daily streamflow was 12 510 m3day−1at the
Channel, 23 090 m3day−1at Stratford, and 25 780 m3day−1
at Chinns Bridge. Inflows from Valencia Creek and Freestone Creek in February 2015 were 1410 and 600 m3day−1,
re-spectively (Department of Environment and Primary Indus-tries, 2015).
4.2 River geochemistry
Figure 4a shows the 222Rn activities of the Avon River for
the six sampling campaigns. There are several distinct zones of elevated222Rn activities, notably at Wombat Flat (4.8 km)
where222Rn activities are up to 2040 Bq m−3 and between
Bushy Park and Schools Lane (16.3–25.3 km) where222Rn
activities are up to 3690 Bq m−3. Zones of lower222Rn
activ-ities in the upper reaches occur at Smyths Road (8.1 km) and in the reaches between Stewarts Lane and Stratford (30.1– 35.1 km). The downstream river reaches between Knobs Re-serve and Chinns Bridge (37.8–49.7 km) also have relatively low222Rn activities that generally decline downstream. The
position of the highest222Rn activities changed in the periods prior to and after the 2011–2013 floods. In March 2014 and February 2015, the highest 222Rn activities were at Bushy Park (16.3 km), whereas this site had relatively low 222Rn activities in February 2009 and April 2010 when the highest
222Rn activities were at Pearces Lane (20.0 km). The
distri-bution of222Rn activities in the detailed sampling campaign
in February 2015 is similar to that at other periods of low to moderate streamflow (e.g. March 2014). The lowest overall
222Rn activities were recorded during the periods of highest
flow (September 2010 and July 2014).
EC values and Cl concentrations generally increase down-stream from 54 to 131 µS cm−1and from 4 to 10 mg L−1at
Browns (0.0 km) to as high as 934 µS cm−1 and 98 mg L−1
at Chinns Bridge (49.7 km) (Table A1, Fig. 4b). Cl concen-trations at low streamflows in March 2014 were generally higher (up to 98 mg L−1) than in the other sampling
cam-paigns, while Cl concentrations were<20 mg L−1during the highest streamflows in September 2010. A marked increase in EC values and Cl concentrations occurs downstream of Smyths Road (8.1 km) in the reaches where222Rn activities
major ions (e.g. Na) increase downstream in a similar manner (Table A1).
4.3 Groundwater geochemistry
Groundwater from the near-river bores at Pearces Lane and Stratford has 222Rn activities that vary from 480 to
28 980 Bq m−3(Table A2). There is some variation in222Rn
activities in individual bores between the sampling rounds with relative standard deviations between 6 and 34 %. The mean value of all groundwater 222Rn activities (n=26)
is 12 890 Bq m−3. Bore 5 at Pearces Lane is immediately
adjacent to the Avon River and possibly samples water from the parafluvial zone rather than groundwater. Exclud-ing data from that bore, the mean value of 222Rn activ-ities is 13 830 Bq m−3 (n=24) with a standard error of
1273 Bq m−3and a 95 % confidence interval (calculated
us-ing the descriptive statistics tool in Excel 2010 which as-sumes that the data follow at distribution) of 2634 Bq m−3. EC values of groundwater from the bores at Pearces Lane and Stratford are between 100 and 680 µS cm−1 and Cl
concentrations range from 46 to 147 mg L−1 with a mean
value of 79±34 mg L−1 (n=16) (Table A2). If Bore 5 at Pearces Lane is again excluded, the mean Cl concentration is 87±28 mg L−1(n=14) with a standard error of 8 mg L−1 and a 95 % confidence interval of 16 mg L−1. These Cl
con-centrations are typical of groundwater elsewhere in the Avon valley and neighbouring catchments (Department of Envi-ronment and Primary Industries, 2015).
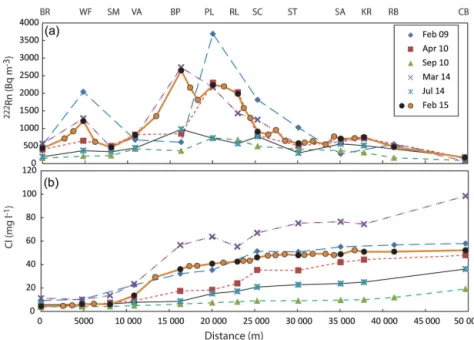
4.4 Geochemistry of water from the alluvial gravels EC values of water within the gravels further than 1–2 m from the edge of the river are between 120 and 550 µS cm−1
(n=52) (Fig. 5b). These EC values are higher than those of the adjacent river water but similar to those of the ground-water. Only water extracted from within 1 to 2 m from the river had EC values similar to the river and in some cases the EC of water from the gravels within a few centimetres of the river edge was higher than the adjacent river. 222Rn
activi-ties of these samples were between 7000 and 28 000 Bq m−3
(n=21) (Fig. 5a), which are also significantly higher than the222Rn activities in the adjacent river. As discussed below, these data are interpreted as indicating that the gravels con-tain a mixture of groundwater and parafluvial water. 4.5 222Rn emanation rates
222Rn emanation rates were determined via Eq. (1). The
ma-trix density was assigned as 2700 kg m−3, which is
appro-priate for sediments rich in quartz (ρ=2650 kg m−3), and a porosity of 0.4 was used, which is appropriate for un-consolidated poorly sorted riverine sediments (Freeze and Cherry, 1979).γvalues range from 288 to 4950 Bq m−3with a mean value of 2308±1197 Bq m−3 (n=44) and a stan-dard error of 183 Bq m−3. The mean emanation rates for
Figure 5.Variations in222Rn activities(a)and EC values(b)of
water extracted from river bank gravels. Shaded boxes show range of values in the groundwater (excluding Bore 5 at Pieces Lane) and the Avon River (data from Tables A1 and A2).
sediments from the different sites vary between 1484 and 3461 Bq m−3; however, there is no systematic variation with
position in the catchment. The relative variability inγ be-tween the sediments is similar to that reported elsewhere (e.g. Bourke et al., 2014a; Cartwright et al., 2014).222Rn activi-ties of water in equilibrium with the sediments are given by γ /λ (Cecil and Green, 2000), and the mean γ /λ value is 12 751±6615 Bq m−3with a standard error of 1009 Bq m−3. Theseγ /λvalues are not significantly different (p∼0.5) to the measured222Rn activities of the groundwater.
5 Discussion
The following observations imply that overall the Avon is a gaining river: (1) even during periods of prolonged low rain-fall the river continues to flow and streamflow commonly increases between the Channel and Chinns Bridge gauges; (2)222Rn activities are higher than those that could be main-tained by hyporheic exchange alone (Cartwright et al., 2011; Cook, 2013); (3) Cl concentrations increase downstream; and (4) there are seeps of water (presumed to be groundwater) at the base of steep slopes at the edge of the floodplain. In the following section, the222Rn activities and Cl concentrations
are used to assess the location and magnitude of groundwater inflows.
5.1 Distribution of groundwater inflows
The February 2009, April 2010, March 2014, and February 2015 sampling campaigns represent lower streamflows. Be-cause the majority of water in the Avon River at these times is likely to be provided by groundwater, the 222Rn
activi-ties from these sampling campaigns are most useful in un-derstanding the distribution of groundwater inflows. The re-gion between Smyths Road and Ridleys Lane (8.1–23.0 km) where222Rn activities increase and remain high (Fig. 4a),
increase in Cl concentrations (Fig. 4b), is interpreted as re-ceiving major groundwater inflows. This section of the Avon River is incised up to 4 m below the floodplain which likely produces steep hydraulic head gradients that result in ground-water discharge on the floodplain and into the river. There are also groundwater seeps and patches of perennial water-tolerant vegetation at the edge of the floodplain in this area. The reaches between Browns and Wombat Flat (0.0–4.8 km) and Stewarts Lane and Stratford (30.1–35.1 km) are also characterized by high 222Rn activities and are again
inter-preted as receiving groundwater inflows.
The reaches between Wombat Flat and Smyths Road (4.8– 8.1 km), Ridleys Lane and Stewarts Lane (23.0–30.1 km), and Knobs Reserve and Chinns Bridge (37.8–49.7 km) where there is a gradual decline in222Rn activities and little change in Cl concentrations (Fig. 4) are interpreted as either being losing or receiving minor groundwater inflows. The land-scape is flatter and the river is less incised in these areas which results in lower hydraulic gradients and consequently less groundwater inflows to the river.
The difference in the location of the highest222Rn
activ-ities between the sampling campaigns that were conducted before and after the major floods (i.e. pre-2011 vs. post-2013) indicates that the locations of groundwater inflows changed. The major floods changed the location of pools and sediment banks on the Avon River and caused scouring, which would change the relationship of the river to the groundwater.
5.2 Quantifying groundwater inflows
This section concentrates on modelling the222Rn activities
for the detailed February 2015 sampling campaign (Fig. 4a). It was considered that groundwater inflows, hyporheic ex-change, and parafluvial flow all contributed 222Rn to the
river. The groundwater 222Rn activity was assumed to be
13 000 Bq m−3, which is consistent both with the measured 222Rn activities of groundwater (Table A2) and the calculated 222Rn activities of water in equilibrium with the alluvial
sed-iments.
The flux of222Rn from the hyporheic zone was estimated
from Eq. (5) using the meanγ value of 2300 Bq m−3day−1 (Table 2), a porosity of 0.4 (which is appropriate for coarse-grained unconsolidated sediments), and a value for cinthat
is the222Rn activity of the river in that reach. The residence
time of water within the hyporheic zone is likely to be short (Boulton et al., 1998; Tonina and Buffington, 2011; Zar-netske et al., 2011; Cartwright et al., 2014), andth=0.1 days is assumed here; forth<1 day,Fh is relatively insensitive to the actual residence times in the hyporheic zone (Lamon-tagne and Cook, 2007; Cartwright et al., 2014). The width of the hyporheic zone has been assigned as the river width. The thickness of the hyporheic zone is less well known; however, by analogy with rivers elsewhere, it is likely to be a few cen-timetres thick (Boulton et al., 1998; Hester and Doyle, 2008;
Tonina and Buffington, 2011) and a value of 10 cm is initially adopted.
Parafluvial flow is conceived to occur on the tens of me-tres to kilometre scale and to represent water that is lost from the river into the floodplain sediments that subsequently re-enters the river downstream. The Cl and222Rn data from the
water contained within the gravels (Fig. 5) are interpreted as reflecting mixing of groundwater and parafluvial flows in the coarse-grained gravel. The generation of paraluvial flow requires that the river is locally losing. As discussed above, on the kilometre scale the Avon River may contain losing reaches. Additionally, the reaches that are interpreted as be-ing overall gainbe-ing may contain smaller sections that are los-ing. In particular, the riffle sections commonly have steep longitudinal gradients and may transition from losing at the upstream end to gaining at the downstream end. Parafluvial flow is probably hosted mainly within the coarser-grained al-luvial sediments (although conceivably it could also include water that flows through the upper levels of the aquifers un-derlying the alluvial sediments). By contrast with hyporheic exchange which occurs along all reaches (whether gaining or losing), inflows from the parafluvial zone require upward head gradients and only occur where the river is gaining. The parafluvial inflows will increase the 222Rn activities in the
river in a similar manner to inflowing groundwater. However, because it represents water that originated from the river, the inflows from the parafluvial zone do not increase the overall streamflow. If the parafluvial zone water is in secular equi-librium with the sediments,cp∼12 700 Bq m−3(Table 2).
Average evaporation rates in southeast Australia in Febru-ary to April are 3×10⁻³ to 5×10⁻³m day−1 (Bureau of Meteorology, 2015) and a value of 4×10⁻³m day−1 was adopted. Average river width and depth is 10 and 0.5 m, re-spectively, upstream of Wombat Flat (0.0–4.8 km) and 20 and 1 m, respectively, for the rest of the river
The gas transfer coefficient was estimated from the de-cline in222Rn activities between Ridleys Lane and Schools
Lane (23.0–25.3 km) (Fig. 4a). This approach estimates the netkdwcrterm andkwas estimated as 0.3 day−1using the measured widths, depths, and222Rn concentrations. This
re-quires that this is a losing stretch of the river, so that there are no groundwater or parafluvial inflows. That Cl concen-trations do not increase over this stretch of river (Fig. 4b) are consistent with it being losing. Ak value of 0.3 day−1 is at the lower end of estimates of Rn gas transfer coef-ficients (Genereux and Hemond, 1992; Cook et al., 2003, 2006; Cartwright et al., 2011, 2014; Unland et al., 2013; Yu et al., 2013; Atkinson et al., 2015). However, as the Avon River is dominated by slow-flowing pools, degassing rates are expected to be low.
Groundwater inflows were calculated from the222Rn
Figure 6. (a)Calculated and observed222Rn activities for February 2015 resulting from assigning 50 % of the calculated inflows as
paraflu-vial flow.(b)Variation in groundwater and parafluvial inflows.(c)Calculated streamflow resulting from the groundwater inflows (Eq. 2) vs.
measured streamflow at Stratford and Chinns Bridge.(d)Predicted vs. observed Cl concentrations. Shaded field is the range resulting from
varying groundwater Cl concentrations within the 95 % confidence interval.
as the initial streamflow andQwas increased after each dis-tance step via Eq. (3). The calculations estimated the values of I andIp in each reach by matching the calculated and
measured222Rn activities along the river with the additional
constraint that the total groundwater inflows cannot exceed the net increase in streamflow between the Channel gauge and the gauges at Stratford and Chinns Bridge (Fig. 1). Since there are few streamflow measurements, the calculations as-sumed that the ratio of I toIpwas the same in all gaining
reaches of the river.
Assuming that in the gaining reaches there are 50 % parafluvial inflows and 50 % groundwater inflows allows both the 222Rn variations and the increase in streamflow
to be accounted for (Fig. 6a). Calculated groundwater and parafluvial inflows are highest in the reaches between Smyths Road and Pearces Lane (8.1–20.0 km) (Fig. 6b), which is the region where Cl concentrations also increase markedly (Fig. 4b). Assuming that the waters are in secular equilibrium with the sediments, the combined inflows of groundwater and parafluvial water for this reach are up 2.5 m3m−1day−1of
which groundwater inflows are∼1.26 m3m−1day−1. There is no process in the parafluvial or hyporheic zones other than mixing with groundwater that increases the Cl concentrations of the through-flowing water. Thus, the Cl concentrations in the river reflect only the groundwater
in-flows and in theory it would be possible to use Cl to quan-tify these (c.f., McCallum et al., 2012). However, the high variability of Cl concentrations in the groundwater and the relatively small difference between groundwater and river Cl concentrations results in large uncertainties. The change in Cl concentrations (Fig. 6d) was calculated from the ground-water inflows assuming that groundground-water has a Cl concen-tration of 85 mg L−1. The calculated Cl concentrations are
slightly higher than those observed, but if the Cl concentra-tion of the groundwater is allowed to vary within the 95 % confidence interval (±16 mg L−1) the observed trend can be reproduced.
If residence times in the parafluvial zone are shorter than those required to attain secular equilibrium, cp will be lower and the inflows from the parafluvial zone (Ip) required to produce a given flux of 222Rn (Fp) increases (Fig. 3). For example, if cr=2300 Bq m−3, which is a typical value in many of the reaches be-tween Valencia and Bushy Park (10.9–16.3 km) and cp=12 700 Bq m−3, then (cp−cr)=10 400 Bq m−3. If Ip=1 m3m−1day−1, Fp=10 400 Bq m−1day−1 (Eq. 6). If γ=2300 Bq m−3day−1, cp is 2487, 4023, and 11 004 Bq m−3wheret
pis 0.1, 1, and 10 days, respectively.
Figure 7. (a)Calculated vs. observed222Rn activities in the Avon River for February 2015 assuming both uniform groundwater inflow
within each reach and the situation where groundwater inflow occurs immediately upstream of the measurement point. Site abbreviations are as for Fig. 2.(b)Calculated groundwater inflows (I) assuming uniform inflows within each reach.(c)Calculated increase in streamflow
from groundwater inflows (Eq. 2). Both uniform groundwater inflow within each reach and the situation where groundwater enters the river immediately upstream of the measurement point overestimate the measured streamflow. Shaded area is the range of streamflow resulting from varyingcgwwithin the 95 % confidence interval.(d)Predicted vs. observed Cl concentrations. Shaded field is the range resulting from varying groundwater Cl concentrations within the 95 % confidence interval.
for tp=1 day, and ∼1.2 m3m−1day−1 for tp=10 days. Fortp>30 days the system is close to secular equilibrium andcpandIpare near constant (Fig. 3). The cross-sectional area of the parafluvial zone Ap required to accommodate these parafluvial flows withϕ=0.4 andtpbetween 0.1 and 100 days is between 14 and 250 m2(Eq. 7). The floodplain
of the Avon River is tens of metres wide with sediment thicknesses of several metres and even the higher estimates of the cross-sectional area are not unreasonable given the volume of gravels on the floodplain.
5.3 Uncertainties and sensitivity
The proposal that parafluvial flow is important in the Avon River is consistent with the local hydrogeology and allows both the 222Rn and net increase in streamflow to be
repro-duced. The conclusion that inflows of parafluvial zone wa-ters only occur in the gaining reaches is justifiable as the conditions required for groundwater inflows (gaining river with steep hydraulic gradients and high-hydraulic conduc-tivity sediments) will likely drive the return of parafluvial waters to the river. By contrast, losing reaches are likely to be where the water enters the parafluvial sediments. Given
the multiple parameters in Eq. (2) and their inherent uncer-tainties, however, consideration needs to be given to whether both the222Rn activities and the increases in streamflow can
be accounted for without parafluvial inflows being a signifi-cant source of222Rn.
Matching the 222Rn profile along the Avon River
us-ing the parameters discussed above but without input of
222Rn from parafluvial zone would imply net groundwater
inflows of 28 300 m3day−1. However, these inflows exceed
the measured increase in streamflow between the Channel and Chinns Bridge of 15 500 m3day−1 by 180 % (Fig. 7a).
The February 2015 sampling round took place at the end of summer when the small ephemeral tributaries were dry and there was no overland flow; however, there were still flows from Valencia Creek and Freestone Creek of 1410 and 200 m3day−1, respectively. If these were included, the
dis-crepancy between the calculated and observed streamflow increases. The calculated Cl concentrations are also higher than observed (Fig. 7d), although given the uncertainty in groundwater Cl concentrations the discrepancy is not large.
particu-Figure 8.Calculated and observed222Rn activities for February 2015 resulting from varying individual parameters in Eq. (1). In all cases
the new parameters result in significant overestimation of222Rn activities in many reaches and are unlikely to be realistic. Site abbreviations are as for Fig. 1.
lar reach. However, because222Rn is lost from rivers by
de-gassing and decay, lower groundwater inflows are required to replicate the observed 222Rn activities if the
groundwa-ter inflows occur immediately upstream of a sampling point (Cook, 2013). Even assigning the groundwater inflows in each reach to the 10 m section upstream of the measurement point still results in the calculated streamflow overestimating the measured streamflow (Fig. 7c). The predicted222Rn
ac-tivities in the river in this case are also not realistic (Fig. 7a). The evaporation term in Eq. (2) is 1–2 orders of magni-tude lower than most of the other terms, and errors in the assumed evaporation rate have little influence on the calcu-lations. The main parameter impacting calculated groundwa-ter inflows is the222Rn activity of groundwater (Cartwright
et al., 2011; Cook, 2013). Allowing cgw to vary within the 95 % confidence interval of the groundwater222Rn activities
(±2600 Bq m−3) makes little difference to the discrepancy
between the calculated and observed increase in streamflow (Fig. 7c). Increasing cgw to 27 000 Bq m−3 allows both the 222Rn profile and the observed increase in streamflow
be-tween the Channel and Chinns Bridge to be reproduced with-out the requirement for the input of222Rn from the
paraflu-vial zone (Fig. 8). However, there is no known groundwa-ter in the Avon catchment with such high 222Rn activities
and these activities are far higher than would be in equilib-rium with the alluvial sediments that comprise the near-river aquifer lithologies. Hence, it is considered not possible that groundwater222Rn activities could be this high.
There is uncertainty in the gas transfer coefficient. k was estimated assuming that the Avon River contains los-ing reaches; if those reaches were actually gainlos-ing then
this methodology underestimatesk. However, increasing k from 0.3 day−1 increases the calculated groundwater
in-flows, which increases the discrepancy between the observed and calculated increases in streamflow. k estimated from Eqs. (8) and (9) ranges between 0.1 and 0.3 day−1. Using k=0.1 day−1 produces net groundwater inflows that more closely match the observed increase in streamflow. However, adoptingk=0.1 day1results in the calculated222Rn activ-ities in a number of reaches being overestimated (Fig. 8). This is because even assuming no groundwater inflows into those reaches, the loss of222Rn by degassing is insufficient to explain the observed decrease in222Rn. Such a poor corre-spondence between predicted and observed222Rn activities implies problems with the adopted variables.
While there are uncertainties inch, the main uncertainty in the contribution of hyporheic exchange to the222Rn budget
is the dimensions of the hyporheic zone. IncreasingFhalso reduces the calculated groundwater inflows. Using the same emanation rates, residence times, and porosities but assign-ing a thickness of the hyporheic zone of 50 cm increasesFh
and produces groundwater inflows that broadly match the in-crease in streamflow. However, the higher values ofFhagain
result in a poor fit between predicted and observed222Rn
ac-tivities (Fig. 8).
Because the error inλ is negligible and the evaporation term is much smaller than the other terms, it is generally possible to produce identical trends in222Rn activities with different combinations ofkandFh(Cartwright et al., 2014).
ob-Figure 9.Calculated streamflows resulting from groundwater inflows for the sampling rounds excluding February 2015 estimated without parafluvial flow. Aside from the high flow periods (September 2010 and July 2014) the calculated increase in streamflow exceeds the observed streamflow at Stratford and Chinns Bridge. Site abbreviations are as for Fig. 1.
served and the predicted222Rn activities is achieved with no
hyporheic exchange (Fh=0). However, these combinations of parameters again result in estimated net groundwater in-flows that exceed the measured increase in streamflow.
There is an unknown error in the streamflow measure-ments, but it is unlikely to be sufficient to explain the gross overestimation of groundwater inflows. Uncertainties in the assumed river widths and depths will also impact the calcu-lations. Specifically, reducing the width or depth decreases the magnitude of the last two terms on the right-hand side of Eq. (2), which in turn reducesI. If widths were reduced by 50 % (an unrealistic error), net groundwater inflows broadly match the increase in streamflow. However, this again re-sults in222Rn activities being overestimated in many reaches
(Fig. 8). Increasingk to 0.65 day−1 would allow the222Rn activities to be predicted using these lower widths but again results in the estimated net groundwater inflow exceeding the measured increase in streamflow. Overall it is concluded that there are no combinations of parameters that can reproduce both the observed222Rn activities and streamflows without
incorporating parafluvial flow.
It would be possible to explain the observed222Rn activi-ties and streamflows if there were losing reaches in the Avon River through which significant volumes of river water were lost to the underlying aquifers and, unlike parafluvial flow, this water did not subsequently return to the river. For this scenario to be valid, approximately 50 % of the groundwa-ter inflows would have to be lost from the river in these los-ing reaches in February 2015. The reaches between 25 are 30 km are interpreted as losing. However, these reaches do not dry up even during prolonged drought (Gippsland Wa-ter, 2012), and all reaches of the river were flowing during the 2009 sampling campaign (which had the lowest stream-flows). Also while streamflows were not measured, such a major reduction in streamflow over such a short distance would be apparent in the field. Likewise, significant pump-ing of water from the river would also reduce streamflows. While the surface water is licensed for use, streamflow dur-ing February 2009 and March 2014 was below the minimum levels where that is permitted and the streamflows in April
2010 and February 2015 were such that use would be re-stricted; hence, large-scale pumping of river water at those times is unlikely.
5.4 Other sampling campaigns
The predicted distribution of groundwater inflows in Febru-ary 2009, April 2010, and March 2014 when streamflows were low to moderate are similar to those in February 2015 (Fig. 4). Due to the lower number of sampling points, it is dif-ficult to calculate groundwater inflows with certainty. The net groundwater inflows calculated using the same parameters as above but ignoring parafluvial flows are between 15 900 and 21 700 m3day−1, respectively (Fig. 9), which are up to
490 % of the measured increases in streamflow between the Channel and Chinns Bridge. Again propagating the likely un-certainties in the parameters through Eq. (2) cannot resolve this discrepancy, implying that the inflows of water from the parafluvial zone must be a significant part of the222Rn
bud-get.
At the higher streamflows there will likely be significant inputs to the river from overland flow or interflow; hence, it is not possible to use the comparison between calculated groundwater inflows and the net increase in streamflow to independently test for the input of222Rn from the parafluvial zone. For example, without incorporating parafluvial flow, the net groundwater inflows using widths of 15 m upstream of Wombat Flat and 25 m elsewhere, depths of 1.25 up-stream of Wombat Flat and 1.6 m elsewhere,k=0.3 day−1, Fh adjusted for the higher river widths is 32 100 m3day−1 (September 2010) and 44 600 m3day−1 (July 2014). These
6 Conclusions
The variation in 222Rn activities and Cl concentrations
clearly define the reaches of the Avon River that are gaining. The distribution of222Rn activities also indicate that the
loca-tion of groundwater inflows changed after major floods that occurred between 2011 and 2013. This approach can be ap-plied to other rivers where flood events change the geometry of the floodplain sediments and where the groundwater mon-itoring bore network is insufficient to define groundwater– river interaction.
The Avon River has coarse-grained unconsolidated grav-els along its floodplain and it was concluded that parafluvial flow was a significant process in controlling the 222Rn ac-tivities of the river. However, this proposition is difficult to definitively test or explore in more detail. The groundwater and parafluvial inflows have been assumed to occur in simi-lar proportions in each reach, which may not necessarily be the case. Parafluvial flow is likely to be important in rivers with coarse-grained alluvial sediments on their floodplains, especially where there are locally alternating gaining and los-ing reaches, and must be taken into account in 222Rn mass
balance calculations. Unlike hyporheic exchange, which oc-curs in all stretches, parafluvial inflows are likely to domi-nantly occur in gaining reaches augmenting the groundwater inflows.
Theoretically, a conservative tracer such as Cl that is unaf-fected by parafluvial flow could be used to separate ground-water inflows from parafluvial inflows. However, the rela-tively high variability of groundwater Cl concentrations and the relative small difference between groundwater and river Cl concentrations make this impractical in the Avon ment. Nevertheless, this may be possible in other river catch-ments and illustrates the advantage of using multiple geo-chemical tracers.
More generally, this study illustrates the importance of carrying out geochemical studies at low streamflows where the majority of inflows into the river are likely to be from groundwater. While this might appear redundant in terms of determining the water balance, it does provide for a test of assumptions and parameterization. It would be possible to interpret the changes to222Rn activities during the periods
of higher streamflow as being solely due to groundwater in-flows because the net groundwater inin-flows are lower than the net increases in streamflow (Fig. 9). However, it is likely that there is groundwater and parafluvial inflows at all times, in which case calculated groundwater inflows will be overesti-mated.
7 Data availability
Appendix A: Geochemical and streamflow data for the Avon catchment
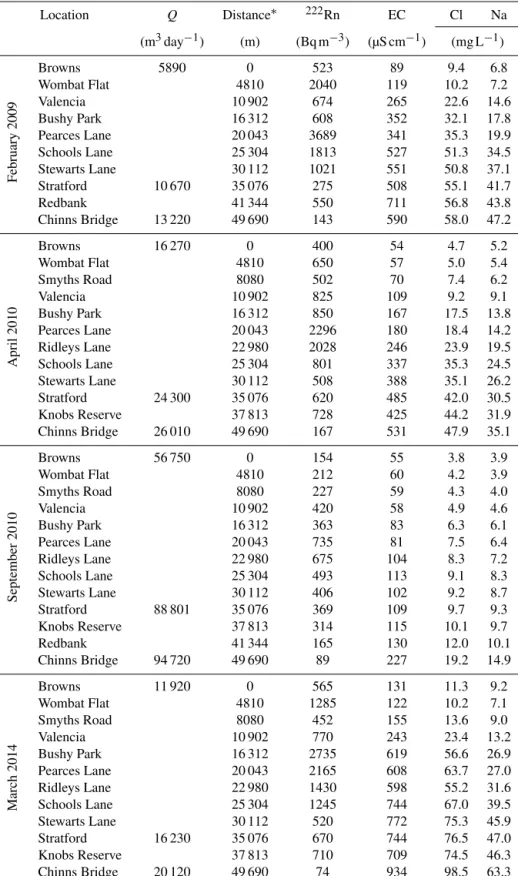
Table A1.Discharge and geochemistry of the Avon River.
Location Q Distance∗ 222Rn EC Cl Na
(m3day−1) (m) (Bq m−3) (µS cm−1) (mg L−1)
February
2009
Browns 5890 0 523 89 9.4 6.8 Wombat Flat 4810 2040 119 10.2 7.2 Valencia 10 902 674 265 22.6 14.6 Bushy Park 16 312 608 352 32.1 17.8 Pearces Lane 20 043 3689 341 35.3 19.9 Schools Lane 25 304 1813 527 51.3 34.5 Stewarts Lane 30 112 1021 551 50.8 37.1 Stratford 10 670 35 076 275 508 55.1 41.7 Redbank 41 344 550 711 56.8 43.8 Chinns Bridge 13 220 49 690 143 590 58.0 47.2
April
2010
Browns 16 270 0 400 54 4.7 5.2 Wombat Flat 4810 650 57 5.0 5.4 Smyths Road 8080 502 70 7.4 6.2 Valencia 10 902 825 109 9.2 9.1 Bushy Park 16 312 850 167 17.5 13.8 Pearces Lane 20 043 2296 180 18.4 14.2 Ridleys Lane 22 980 2028 246 23.9 19.5 Schools Lane 25 304 801 337 35.3 24.5 Stewarts Lane 30 112 508 388 35.1 26.2 Stratford 24 300 35 076 620 485 42.0 30.5 Knobs Reserve 37 813 728 425 44.2 31.9 Chinns Bridge 26 010 49 690 167 531 47.9 35.1
September
2010
Browns 56 750 0 154 55 3.8 3.9 Wombat Flat 4810 212 60 4.2 3.9 Smyths Road 8080 227 59 4.3 4.0 Valencia 10 902 420 58 4.9 4.6 Bushy Park 16 312 363 83 6.3 6.1 Pearces Lane 20 043 735 81 7.5 6.4 Ridleys Lane 22 980 675 104 8.3 7.2 Schools Lane 25 304 493 113 9.1 8.3 Stewarts Lane 30 112 406 102 9.2 8.7 Stratford 88 801 35 076 369 109 9.7 9.3 Knobs Reserve 37 813 314 115 10.1 9.7 Redbank 41 344 165 130 12.0 10.1 Chinns Bridge 94 720 49 690 89 227 19.2 14.9
March
2014
Table A1.Continued.
Location Q Distance∗ 222Rn EC Cl Na
(m3day−1) (m) (Bq m−3) (µS cm−1) (mg L−1)
July
2014
Browns 39 470 0 195 78 5.8 5.3 Wombat Flat 4810 370 70 5.9 5.1 Smyths Road 8080 338 73 6.4 6.9 Valencia 10 902 445 90 7.8 8.2 Bushy Park 16 312 975 107 8.7 9.0 Pearces Lane 20 043 720 180 15.3 10.5 Ridleys Lane 22 980 568 170 17.2 12.1 Schools Lane 25 304 770 243 20.9 14.8 Stewarts Lane 30 112 302 244 22.8 15.6 Stratford 84 080 35 076 560 262 23.8 16.5 Knobs Reserve 37 813 513 245 25.0 17.0 Chinns Bridge 93 730 49 690 185 366 36.2 23.3
February
2015
Browns 12 510 0 438 56 4.4 4.8 BR-WF1 2590 714 55 4.6 4.7 BR-WF2 3638 920 65 5.0 4.8 Wombat Flat 4810 1210 65 5.6 4.8
WF-SM 6190 621 70 5.8 6.1
Smyths Road 8080 460 76 5.5 6.1 Valencia 10 902 810 126 10.5 9.9 VA-BP 13 380 1350 225 21.1 14.2 Bushy Park 16 312 2650 251 25.6 15.3 BP-PL1 17 368 2160 277 27.4 16.7 BP-PL2 18 723 1812 298 27.5 16.9 Pearces Lane 20 043 2230 338 28.7 17.4 PL-RL 21 339 2195 334 29.4 17.3 Ridleys Lane 22 980 1986 307 29.9 18.0 RL-SC1 23 669 1580 332 30.4 17.9 RL-SC2 24 439 1298 315 30.4 17.7 Schools Lane 25 304 910 352 32.3 18.0 SC-ST1 26 557 827 363 33.4 18.2 SC-ST2 27 462 952 387 33.6 18.2 SC-ST3 28 525 649 385 34.1 18.7 Stewarts Lane 30 112 578 394 33.6 18.6 ST-SA1 30 831 596 323 33.7 18.8 ST-SA2 31 801 637 330 34.4 18.7 ST-SA3 33 301 543 355 34.4 18.9 ST-SA4 34 296 771 366 33.7 18.7 Stratford 23 090 35 076 709 374 34.1 19.2 SA-KR 36 713 722 371 36.4 19.7 Knobs Reserve 37 813 751 390 35.6 20.1 Redbank 41 344 471 375 35.6 21.0 Chinns Bridge 25 780 49 690 172 426 36.4 21.7
Table A2.Geochemistry of groundwater from Stratford and Pearces Lane.
Bore 222Rn (Bq m−3) EC (µS cm−1) Cl (mg L−1)
Apr 2011 Mar 2012 Feb 2014 Apr 2011 Mar 2012 Apr 2011 Mar 2012 Stratford 1a 3172 4332 6230 207 284 46 59 Stratford 2 22 896 19 632 28 980 441 361 92 78 Stratford 3 8823 9833 9540 393 311 85 67 Stratford 4 11 083 16 073 12 015 490 521 106 119 Pearces 2b 23 000 21 190 17 560 417 398 89 74 Pearces 3 9670 10 320 11 210 294 330 62 71 Pearces 4 16 800 12 365 14 210 678 575 146 125 Pearces 5c 480 550 – 143 97 31 21
aBores located in bank of river between Stratford and Knobs Reserve sampling sites (Fig. 2). bBores located in bank of river at Pearces Lane sampling site (Fig. 2).
Author contributions. Both authors were involved in field data
col-lection and lab analyses. Ian Cartwright prepared the manuscript with contributions from Harald Hofmann.
Acknowledgements. We would like to thank Anne Connor, Lee
French, Eamon Ley, Massimo Raveggi, and Rachelle Pierson for help in the field and the laboratory. We would also like to thank Luisa Stellato and three anonymous reviewers for their extensive and careful comments on this paper. Funding for this project was provided by Monash University and the National Centre for Groundwater Research and Training program P3. The National Centre for Groundwater Research and Training is an Australian Government initiative supported by the Australian Research Council and the National Water Commission via Special Research Initiative SR0800001.
Edited by: L. Pfister
Reviewed by: L. Stellato and two anonymous referees
References
Atkinson, A., Cartwright, I., Gilfedder, B., Hofmann, H., Unland, N., Cendón, D., and Chisari, R.: A multi-tracer approach to quan-tifying groundwater inflows to an upland river; assessing the in-fluence of variable groundwater chemistry, Hydrol. Process., 29, 1–12, 2015.
Barron, O., Silberstein, R., Ali, R., Donohue, R., McFarlane, D. J., Davies, P., Hodgson, G., Smart, N., and Donn, M.: Climate change effects on water-dependent ecosystems in south-western Australia, J. Hydrol., 434–435, 95–109, 2012.
Boulton, A. J., Findlay, S., Marmonier, P., Stanley, E. H., and Mau-rice Valett, H.: The functional significance of the hyporheic zone in streams and rivers, Annu. Rev. Ecol. Syst., 29, 59–81, 1998. Bourke, S. A., Cook, P. G., Shanafield, M., Dogramaci, S., and
Clark, J. F.: Characterisation of hyporheic exchange in a losing stream using radon-222, J. Hydrol., 519, 94–105, 2014a. Bourke, S. A., Harrington, G. A., Cook, P. G., Post, V. E., and
Dogramaci, S.: Carbon-14 in streams as a tracer of discharging groundwater, J. Hydrol., 519, 117–130, 2014b.
Briody, A. C., Cardenas, M. B., Shuai, P., Knapper, P. S., and Ben-nett, P. C.: Groundwater flow, nutrient, and stable isotope dynam-ics in the parafluvial-hyporheic zone of the regulated Lower Col-orado River (Texas, USA) over the course of a small flood, Hy-drgeol. J., 24, 923–935, doi:10.1007/s10040-016-1365-3, 2016. Brodie, R., Sundaram, B., Tottenham, R., Hostetler, S., and Ransley,
T.: An overview of tools for assessing groundwater-surface wa-ter connectivity, Bureau of Rural Sciences, Canberra, Australia, 133 pp., 2007.
Brumley, J.: An investigation of the groundwater resources of the Latrobe Valley, Victoria, in: Symposium on coal resources: ori-gin, exploration and utilization in Australia, edited by: Mallett, C. W., Proceedings, Melbourne, November 1982, Geological So-ciety of Australia, Coal Group, 562–581, 1982.
Bureau of Meteorology: Commonwealth of Australia Bureau of Meteorology, available at: http://www.bom.gov.au, 2015, last ac-cessed 30 June 2015.
Burnett, W. C. and Dulaiova, H.: Radon as a tracer of submarine groundwater discharge into a boat basin in Donnalucata, Sicily, Cont. Shelf Res., 26, 862–873, 2006.
Cartwright, I. and Gilfedder, B.: Mapping and quantifying ground-water inflows to Deep Creek (Maribyrnong catchment, SE Aus-tralia) using 222Rn, implications for protecting groundwater-dependant ecosystems, Appl. Geochem., 52, 118–129, 2015. Cartwright, I., Hofmann, H., Sirianos, M. A., Weaver, T. R., and
Simmons, C. T.: Geochemical and222Rn constraints on baseflow to the Murray River, Australia, and timescales for the decay of low-salinity groundwater lenses, J. Hydrol., 405, 333–343, 2011. Cartwright, I., Hofmann, H., Gilfedder, B., and Smyth, B.: Un-derstanding parafluvial exchange and degassing to better quan-tify groundwater inflows using222Rn: The King River, southeast Australia, Chem. Geol., 380, 48–60, 2014.
Cecil, L. D. and Green, J. R.: Radon-222, in: Environmental trac-ers in subsurface hydrology, edited by: Cook, P. G. and Herczeg, A. L., Kluwer, Boston, USA, 175–194, 2000.
Cochrane, G. W., Quick, G. W., and Spencer-Jones, D: Introduc-ing Victorian Geology. Geological Society of Australia, Victo-rian Division, Melbourne, Australia, 304 pp., 1991.
Cook, P. G.: Estimating groundwater discharge to rivers from river chemistry surveys, Hydrol. Process., 27, 3694–3707, 2013. Cook, P. G., Favreau, G., Dighton, J. C., and Tickell, S.:
Determin-ing natural groundwater influx to a tropical river usDetermin-ing radon, chlorofluorocarbons and ionic environmental tracers, J. Hydrol., 277, 74–88, 2003.
Cook, P. G., Lamontagne, S., Berhane, D., and Clarke, J. F.: Quan-tifying groundwater discharge to Cockburn River, southeastern Australia, using dissolved gas tracers Rn-222 and SF6, Water Re-sour. Res., 42, W10411, doi:10.1029/2006WR004921, 2006. Department of Environment and Primary Industries: Streamflow
data, available at: http://data.water.vic.gov.au/monitoring.htm (last access: 10 July 2015), 2015.
Edwardson, K. J., Bowden, W. B., Dahm, C., and Morrice, J.: The hydraulic characteristics and geochemistry of hyporheic and parafluvial zones in Arctic tundra streams, north slope, Alaska, Adv. Water Resour., 26, 907–923, 2003.
Ellins, K. K., Roman-Mas, A., and Lee, R.: Using222Rn to examine groundwater/surface discharge interaction in the Rio Grande de Manati, Puerto Rico, J. Hydrol., 115, 319–341, 1990.
Freeze, R. A. and Cherry, J. A.: Groundwater, Prentice-Hall, New Jersey, USA, 604 pp., 1979.
Genereux, D. P. and Hemond, H. F.: Determination of gas exchange rate constants for a small stream on Walker Branch watershed, Tennessee, Water Resour. Res., 28, 2365–2374, 1992.
Gippsland Water: Water Supply Demand Strategy, available at: https://www.gippswater.com.au/application/files/5314/3831/ 1802/Gippsland_Water_Final_2012_WSDS.pdf, last access: 30 May 2015, 2012.
Hester, E. T. and Doyle, M. W.: In-stream geomorphic structures as drivers of hyporheic exchange, Water Resour. Res., 44, W03417, doi:10.1029/2006WR005810, 2008.