www.j-sens-sens-syst.net/4/331/2015/ doi:10.5194/jsss-4-331-2015
© Author(s) 2015. CC Attribution 3.0 License.
Correlation of BAW and SAW properties of langasite at
elevated temperatures
M. Schulz1, E. Mayer2, I. Shrena2, D. Eisele2, M. Schmitt2, L. M. Reindl2, and H. Fritze1
1Institute of Energy Research and Physical Technologies, Clausthal University of Technology, Goslar, Germany 2Department of Microsystems Engineering, Albert-Ludwigs-Universität Freiburg, Freiburg, Germany
Correspondence to:M. Schulz ([email protected])
Received: 8 October 2015 – Accepted: 27 November 2015 – Published: 17 December 2015
Abstract. The full set of electromechanical data of langasite (La3Ga5SiO14) is determined in the temperature range from 20 to 900◦C using differently oriented bulk acoustic wave resonators. For data evaluation a physical model of vibration is developed and applied. Thereby, special emphasis is taken on mechanical and electrical losses at high temperatures. The resulting data set is used to calculate the properties of surface acoustic waves. Direct comparison with experimental data such as velocity, coupling coefficients and propagation loss measured using surface acoustic wave devices with two different crystal orientations shows good agreement.
1 Introduction
Langasite (LGS, La3Ga5SiO14) is a single crystalline piezo-electric material suited for high-temperature applications (Fukuda et al., 1998; Fachberger et al., 2001; Fritze and Tuller, 2001; Fritze, 2011b). It belongs to the point group 32 and exhibits the same crystal structure as quartz, but ex-ceeds its operation temperature limit significantly. LGS does not undergo any phase transformation up to its melting point at 1470◦C and may be piezoelectrically excited up to at least 1400◦C provided that stable electrodes are available (Fritze, 2011b). The crystals exhibit mixed electronic and ionic con-ductivity, which contributes to the loss at high temperatures. The oxygen partial pressure-dependent conductivity impacts the performance of the resonators in a minor way as long as the oxygen partial pressure is kept, e.g., above 10−20bar at 600◦C (Fritze et al., 2006; Fritze, 2006, 2011a).
LGS can be used as a resonant sensor. When operated in the microbalance mode, small mass changes of a layer with affinity to specific gas particles cause a shift of the reso-nance frequency (Tuller and Fritze, 2002). Anticipated appli-cations of such sensors include fuel cells and gas reformers (Schneider et al., 2005). The stability of LGS in harsh envi-ronments such as high temperatures and low oxygen partial pressures makes it suited for wireless sensors based on sur-face acoustic wave (SAW) devices (Fachberger et al., 2004; Thiele and Pereira da Cunha, 2006; Bardong et al., 2008;
Wall et al., 2015; Behanan et al., 2015). Here, an accurate set of LGS material constants determined for a wide temper-ature range is strongly required. The availability of such data sets is scarce, since the published materials data are either limited to a fixed temperature or cover only a narrow range around room temperature◦C (Bungo et al., 1999; Malocha et al., 2000). Weihnacht et al. (2012) provide the components of elastic compliance tensor in the 25 to 600◦C temperature range, determined using the pulse-echo ultrasonic technique (Weihnacht et al., 2012).
In this work, the full set of elastic, electric and piezoelec-tric properties of langasite is determined at elevated temper-atures using bulk acoustic wave (BAW) resonators of differ-ent oridiffer-entations. Special attdiffer-ention is drawn to the mechan-ical and electrmechan-ical losses, which play an important role for high-temperature applications. Subsequently, the full set of electromechanical data is used to predict the wave velocity of SAW resonators for two selected cuts of LGS. Their Eu-ler angles are (0, 138.5, 26.6◦) and (0, 30.1, 26.6◦). Finally, the calculated values are compared with the corresponding data extracted from the high-temperature measurements of specially designed SAW test structures.
FOMOS-Materials, Russia, and Mitsubishi Materials Corporation, Japan.
2 Model for BAW and SAW
2.1 High-temperature losses
A piezoelectric resonator operated at room temperature can be described by a one-dimensional physical model of vibra-tion, where electrical losses are very low and thus negligible. At elevated temperatures, this description is not accurate due to, e.g., the finite electrical conductivity. In this case the elas-tic, dielectric and piezoelectric coefficients must be extended by imaginary parts which express the mechanical, electrical and piezoelectric losses.
2.1.1 Mechanical loss
The mechanical loss at elevated temperatures depends on the resonance frequencyf and can be described by the viscos-ityη. The loss of the resonator at the angular frequencyω, withω=2πf, is related to the imaginary part of the elastic stiffness according to (Ikeda, 1990):
ˆ
c=c+j ωη. (1)
The elastic compliances must be extended by a viscous contributions in a similar way. The relation between the elas-tic stiffness and the viscosity can be expressed using the in-verse resonant quality factor,Q−1and the mechanical loss tangent tanδM, by
tanδM= ℑ(cˆ) ℜ(ˆc)=
ωη
c ≡Q
−1.
(2)
2.1.2 Electrical loss
A perfectly insulating resonator with two parallel electrodes, excited by a harmonic electric field E=E0ej ωt, acts as a capacitor with a dielectric material described by the permit-tivity ε. In case of materials exhibiting dielectric loss, the
dielectric tensor must be regarded as a complex property con-sisting of real and imaginary parts (Ikeda, 1990)
ˆ
ε=ε−jσ
ω, (3)
with the loss tangent tanδEgiven by
tanδE=
ℑ(ˆe)
ℜ(eˆ). (4)
The origin of dielectric loss can be attributed to the electri-cal conductivityσof the material. Calculating the admittance
Y for a capacitor with the thicknessa, the electrode areaA
and the dielectric coefficient described by the complex prop-ertyεˆresults in (Ikeda, 1990)
Y =A
a(σ+j ωε). (5)
The equation describes the admittance of an electric circuit with capacitor and resistance connected in parallel.
2.1.3 Piezoelectric loss
In analogy to the mechanical and electrical loss, the imagi-nary part of the piezoelectric coefficient can be introduced. The nature of this “piezoelectric loss” is however not clear. It may be explained by, e.g., jumping of lattice defects or the movement of domain walls in polycrystalline materials (Sherrit and Mukherjee, 1998; Smits, 1976). However, for most materials this term is negligible and assumed to be zero (Ikeda, 1990). The validity of this assumption for langasite is proven in previous studies, where calculations with complex piezoelectric coefficient are used to evaluate the data (Fritze, 2011b). Therefore, in this article the imaginary part of the piezoelectric coefficient is omitted.
2.2 Piezoelectric equations
In case of piezoelectric materials, the relation between me-chanical and electrical properties is described by the piezo-electric equation
ˆ
c eT
e εˆ
·
S
E
=
T
D
, (6)
where the complex stiffnesscˆand the piezoelectric constant
eare 4th and 3rd rank tensors, respectively. The complex
di-electric coefficientεˆ, strainSand stressT are 2nd rank
ten-sors. The electric fieldE and electric displacement D are
vectors. In order to differentiate between tensors and tensor components, the former is written in bold.
Due to the tensor symmetry and the crystal symmetry of LGS many tensor components vanish, so that the number of independent coefficients in Eq. (6) is reduced to 10 (Meitzler et al., 1988; Ikeda, 1990):
ˆ
c11 cˆ12 cˆ13 cˆ14 0 0 e11 0 0 ˆ
c12 cˆ11 cˆ13 − ˆc14 0 0 −e11 0 0 ˆ
c13 cˆ13 cˆ33 0 0 0 0 0 0 ˆ
c14 − ˆc14 0 cˆ44 0 0 e14 0 0 0 0 0 0 cˆ44 cˆ14 0 −e14 0 0 0 0 0 cˆ14 cˆ66 0 −e11 0
e11 −e11 0 e14 0 0 εˆ11 0 0 0 0 0 0 −e14 −e11 0 εˆ11 0
0 0 0 0 0 0 0 0 εˆ33
, (7)
withcˆ66= ˆc11− ˆc12/2. Here, thecˆij,eˆijandεˆijrepresent
the components of stiffness tensorc, piezoelectric tensore
and dielectric coefficient tensorε, respectively.
Equation (6) applies, when the strainSand electric field E are independent variables. This is the case where a
res-onator is operated in the thickness shear mode of vibration. In case of length-extensional mode of vibration, where the elastic stressT and the electric fieldEare independent
vari-ables, an alternative notation applies
ˆ
s dT d εˆ
·
T
E
=
S
D
Here, the complex elastic compliancesˆis used instead of the stiffnesscˆ, and the piezoelectric constantd replaces the
co-efficiente. The relation between piezoelectric tensorseand d and the relation between elastic compliance and stiffness
are shown, e.g., in (Meitzler et al., 1988; Ikeda, 1990). The latter is used to calculate the components12(T) of the elastic stiffness tensor from the coefficientc66(T) as follows:
s12(T)=s11(T)− 1 2c66(T)−
2(s14(T))2
s44(T) . (9)
The determination of all components of the elastic stiff-ness and compliance tensors requires different crystal cuts. The shear components of those tensors determine two dif-ferent modes of vibration. The stiffness cˆ66 describes the thickness shear (TS) vibration of a partially electroded Y -cut resonator, and the elastic compliance sˆ44 describes the face shear (FS) vibration of a rectangularY-cut plate. The remaining four components of the elastic compliance tensor may be determined using differently oriented rods excited in length-extensional (LE) mode of vibration. Here, the effec-tive complianceseffis a superposition of several components as function of the angle ϕ between the rod and the Y axis (Ikeda, 1990; Schulz and Fritze, 2008):
seff(ϕ)=s11cos4ϕ+s33sin4ϕ−2s14cos3ϕsinϕ
+(s44+2s13) cos2ϕsin2ϕ. (10) Several anglesϕhave to be chosen in such a way that for ev-eryϕ at least one term in Eq. (10) dominates. The effective piezoelectric coefficientdeffis a superposition of two differ-ent coefficidiffer-ents as a function of theϕ:
deff(ϕ)= −d11cos2ϕ+d14cosϕsinϕ. (11) From Eq. (10) it may be seen that four differently oriented rods with angles ϕ of −30, 0, 30 and 45◦ are required to determine the majority of components of the elastic com-pliancesˆ. The coefficients12remains to be determined and is obtained from the thickness shear mode of vibration as shown in Eq. (9). The sum of coefficients (s44+2s14) is sep-arated using the face shear mode of vibration described by
s44. The stiffness tensor cˆ is calculated using the relation between stiffness and elastic compliance. Additionally, two rectangular X- and Z-cut plates are required to determine the two independent complex components of the dielectric tensor,εˆ11 andεˆ33. The imaginary part of dielectric tensor provides the information about conductivityσ1andσ3 (com-monly denoted asσXandσZ, respectively) of langasite.
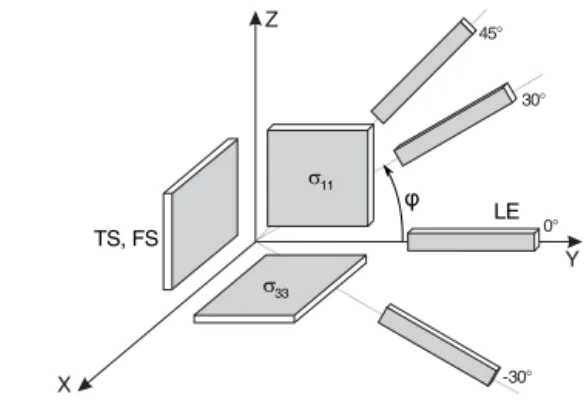
All crystal cuts used in this work are visualized in Fig. 1.
2.3 Models for different crystal orientations 2.3.1 Length-extensional mode
In case of a rod, where the width b, length l and thickness
a are chosen to be parallel to thex3,x2andx1axes, respec-tively, and the applied electric field is parallel to thex1axis,
Figure 1.The crystal cuts of langasite used to determine the full set of electromechanical data (Ikeda, 1990). Four differently rotated rods with electrodes perpendicular toXaxis vibrate in length ex-tensional mode (LE). The rectangularY-cut plate vibrates in face shear (FS) and thickness shear (TS) modes. The rectangularX- and Z-cut plates are used for conductivity measurements.
the piezoelectric relation shown in Eq. (8) is reduced signifi-cantly. Due to the boundary conditions chosen here, only the stress and strain inx2direction are relevant. All other com-ponents of the tensorsT andS vanish. Similarly, only the
electric displacementD1and electric fieldE1are taken into account resulting in the following equation:
S2= ˆs22T2+d12E1
D1=d12T2+ ˆε11E1. (12)
The strength of the coupling between the mechanical and electrical properties of a piezoelectric medium is expressed as coupling factorkˆ, defined by
ˆ
k212= d 2 12 ˆ
s22εˆ11
. (13)
With the coupling factor, Eq. (12) can be transformed in
T2= 1 ˆ
s22
∂u2
∂x2 −d12
ˆ
s22
E1,
D1=
d12 ˆ
s22
∂u2
∂x2 + ˆε11
1− ˆk122E1. (14)
Solving Newton’s equation of motion withT2 described by Eq. (14) and under the assumption of harmonic time de-pendenceej ωtof the electric fieldE1, the electric impedance of the resonator is calculated (Schulz and Fritze, 2008)
Y=j ωlb aεˆ
"
1− ˆk2+ ˆk2 2 lbpρsˆ22
tan lb
p
ρsˆ22 2
!#
. (15)
The parameter of the tangent function reflects the phase shift and a wave velocity in the bulk of a resonator:
ˆ
The capacityC0of the resonator equals
C0= ˆε11
lb
a . (17)
From Eqs. (15), (16) and (17) the admittanceYof a resonator is found to be
Y =j ωC0
1− ˆk2+ ˆk22
ˆ
νtan
νˆ
2
. (18)
2.3.2 Thickness shear mode
In case of a partially electrodedY-cut resonator with the elec-tric field applied parallel to thex2axis, only the strainS6and stressT6do not vanish. The piezoelectric relation shown in Eq. (6) can be expressed as
T6= ˆc66S6+e26E2,
D2=e26S6+ ˆε22E2. (19)
Under the assumption of a harmonic time dependence of an electric field, Eq. (19), Newton’s equation of motion may be transformed analogously to the case of length extensional mode of vibration. The resulting equation is found to be (Ma-son, 1964)
ˆ
c66+
e226
ˆ
ε22
!
∂2u1
∂x22 +ω
2ρu
1=0. (20)
Here, a new property, the piezoelectrically stiffened shear modulusc¯is introduced
¯
c= ˆc66+
e226
ˆ
ε22
=c66+
e262 ε22+σ2/ε22ω2 +j ω η+ σ2
1+σ22/e226ω2
!
. (21)
This shear modulus depends on the piezoelectric and dielec-tric coefficients, as well as on the electromechanical losses, i.e., electric conductivity and viscosity. The consequences of these relations are discussed elsewhere (Fritze, 2011b).
Using these equations, the electric impedance of the thick-ness shear resonator is obtained
Z= 1
j ωC0
1− ˆkt22
ˆ
νtan
νˆ
2
, (22)
with coupling factor kˆ2t =e262 /cˆ66εˆ22 and the reduced wave velocityνˆ=ωapρ/cˆ. Here,a denotes the thickness of the resonator.
2.3.3 Face shear mode
The face shear vibration of aY-cut resonator is determined by the elastic compliances44. This two-dimensional motion
cannot be described by a physical model which has a straight-forward analytical solution. Therefore, only an approximate solution for the resonance frequencyfrof such a resonator as presented in (Ikeda, 1990; Bechmann, 1951) is used:
fr=
κ2 π l
s
1
ρs44
. (23)
Here,κis a solution of transcendental equation tanκ+κ=0, and2is a correction factor defined as
2=1− 1
2κ
κ2−2
κ2+2
3/2r
s11+s33 2s44
. (24)
2.4 Parameters of SAW propagation
The parameters of SAW propagation, like velocityv, propa-gation lossαand coupling coefficientk2, are calculated from the tensor data, obtained from the impedance measurements of BAW resonators as described in Sect. 2.3.
For this purpose the equations of motion
ρ∂
2u
i
∂t2 =
∂Tij
∂xj
,
∂Di
∂xi
=0, (25)
withi, j=1,2,3, have to be solved together with the piezo-electric Eq. (6) for the semi-infinite substrate crystal of the given cut. For this, the Green function method described in (Peach, 1995, 2001; Koskela, 1998) is used. The poles and zeros of the Green function componentG44on the complex slowness spacescorrespond to surface acoustic waves, prop-agating on a free and on a metallized surface, respectively. A complex pole
Gp44= K
s−s0
(26)
where the value s0=s0′+j s ′′
0 is associated with a SAW, which propagates on the free surface with the velocityv0= 1/s0′. The attenuation is
α=2πf·s ′′
s′ ·20·lge[dB/µs]. (27)
Here,f andeare the frequency of the SAW and the Euler number, respectively.
2.5 Parameters of SAW propagation extracted from the SAW measurements
Special test SAW devices are designed for the experimen-tal determination of the surface acoustic wave parametersv,
Figure 2.Delay lines of different length.
Figure 3.IDT with eight electrodes per period.
Thereby, identical input and output interdigital transduc-ers (IDTs) with eight electrodes per electrical period are used (see Fig. 3).
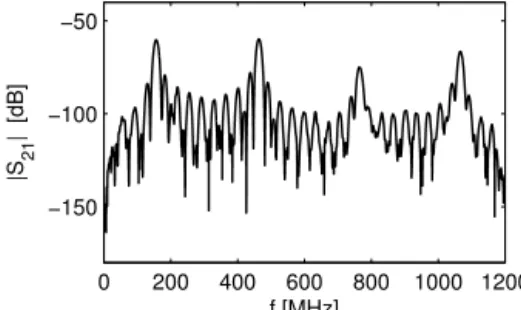
They can be regarded as multi-electrode transducers with double spatial sampling. As shown in (Engan, 1975), the transfer functionS21 of such IDT has four pass bands (four harmonics) with central frequencies corresponding to 1/4f0, 3/4f0, 5/4f0, 7/4f0, wheref0=v/(2p). The pitchp corre-sponds to the period of the electrode in the IDT. In our case the transfer functionS21shows the 1st, 3rd, 5th and 7th har-monics at about 150, 450, 750 and 1050 MHz (Fig. 4).
During signal processing the difference between time de-lay of long and short dede-lay lines at each harmonic is obtained very precisely (Shrena et al., 2008). This allows the determi-nation of the group velocity based on the known length dif-ference between both delay lines. The influence of the IDTs is, therefore, automatically eliminated. The results for the group velocity of SAWs on the free surface and on the met-allized surfaces are extrapolated to zero frequency. This way, the phase velocity for SAW on the free LGS surfacev0and on the short-circuited LGS surface vm (i.e., metallized sur-face without mass loading by the metal film) is determined. Further, the electromechanical coupling coefficientk2is ob-tained from the phase velocitiesv0andvm using the Inge-brigtsen relation (IngeInge-brigtsen, 1972)
k2= −2·vm−v0
v0
. (28)
The propagation lossesαat the harmonic frequencies are calculated to be
α= 1
1t ·20 lg
|S21long|
|S21short|[dB/µs], (29) whereS21long andS21short are the transfer function of the long and short delay line at the harmonic frequency, respectively,
0 200 400 600 800 1000 1200
−150 −100 −50
f [MHz] |S21
| [dB]
Figure 4.Transfer functionS21of a delay line with four harmonics (after signal processing).
and1tis the difference of delay times of the two delay lines for this harmonic.
3 Experimental
3.1 Sample preparation 3.1.1 Crystal cuts
For the determination of the bulk properties of langasite crys-tals several orientations as shown in Fig. 1 are used. Two rectangular 10×10×0.5 mm3X- andZ-cut plates are used for impedance measurements at low frequencies. TheY-cut sample has the same dimensions and operates in the face shear mode of vibration. A circularY-cut sample of 0.27 mm in thickness is excited in the thickness shear mode. For de-termination of most components of the elastic compliance tensor, four differently rotated 10×2×0.5 mm3 rods with electrodes perpendicular to theX axis are prepared. During the machining of langasite rods, the angle ϕ could not be adjusted as precise as other dimensions of the sample with typical uncertainty of about±1◦. In order to overcome this limitation, the samples are characterized at room temperature and the elastic compliance tensor is calculated. The compar-ison of the resulting tensor with literature data and previous pulse-echo measurements on the same crystals enable precise determination of the cut angles.
For the SAW measurements two cuts with Euler angles (0, 138.5, 26.6◦) and (0, 30.1, 26.6◦) are selected. They show largek2 and zero power flow angle (PFA) (Naumenko and Solie, 2001; da Cunha and Fagundes, 1999; Plessky et al., 1998). In addition, the first cut is temperature compensated around room temperature, which makes it attractive for many applications. Because of that, this cut is commercially avail-able from many distributors.
3.1.2 Electrodes BAW samples
about 250 nm. A titanium adhesion layer of a few nanometers is applied.
SAW devices
The metallization of the SAW test devices is done by SAW Components Dresden GmbH using the lift-off technique. Thin Pt layers of 45 and 75 nm are deposited. A Zr film of 4 nm in thickness is taken as adhesion layer. Dewetting of the thin Pt film above that temperature determines a temperature limit for the measurements. In contrast to the BAW samples, thicker Pt layers cannot be used due to increasing reflection and scattering effects at the IDTs which distort the signal and cause additional losses.
3.2 Setup and data evaluation BAW measurements
The electric impedance at low frequencies is measured using a Solartron 1260 gain-phase analyzer to determine the elec-trical conductivity. The impedance in the vicinity of the res-onance frequency of all BAW resonators is acquired using a HP 5100A network analyzer. For high-temperature measure-ments in artificial air containing 20 % O2/Ar, a gas-tight fur-nace with temperature varying between 20 and 900◦C at the rate of 2 K min−1is used. In case of the conductivity deter-mination, the temperature is held constant before each mea-surement in order to equilibrate the samples.
The measured impedance data are further fitted using the physical models of the corresponding resonators in order to obtain the components of stiffness and elastic compliance tensors. It is obvious that the number of free parameters for the fit procedure must be much smaller than the total num-ber of parameters, i.e., 16 for the one-dimensional model of thickness shear resonators. Reasonable fits can be, in gen-eral, expected if the number of free parameters does not ex-ceed three or four (Fritze, 2011b). As a starting point at room temperature, variables such as the sample dimensions, den-sity and electrode areas are determined precisely. Thermal expansion of the material, which influences the dimensions and density, is taken into account. Further, the thickness of electrodes is measured precisely using the surface profiler. In order to calculate the mass load, their density is assumed to be 100 % of the theoretical Pt density as they are prepared by PLD.
The determination of remaining parameters is performed in several steps:
1. Impedance measurements ofX- andZ-cut plates at low frequencies provide information about the dielectric co-efficient and the conductivity in the form of complex coefficientsεˆ11andεˆ33.
2. The fit of analytically solved piezoelectric equations uses the dielectric coefficient and conductivity from step (1).
The determination of elastic properties of langasite involves several crystal orientations and modes of vibration. First, the four differently oriented rods shown in Fig. 1 provide the co-efficientss11(T),s14(T),s33(T) and (s44(T)+s13(T)). Sec-ond, the rectangularY-cut plate vibrating in face shear mode provides the elastic compliance s44(T), and thus, enables the separation ofs13(T) compliance from length-extensional measurements. Finally, the roundY-cut resonator excited in the thickness-shear mode of vibration provides the stiffness coefficientc66(T) used to calculate the elastic compliance
s12(T).
The data evaluation applied here potentially delivers un-reliable absolute values due to, e.g., residual stray capaci-tance of the high-temperature sample holder. To overcome this problems and to verify the models, fit results are com-pared with preliminary pulse-echo measurements performed on the same langasite single crystal.
SAW measurements
Two delay lines – one long and one short – are positioned on one chip. They are connected to the same ports and are measured simultaneously. The chip is mounted on a holder and is connected to the RF-flange of the high-temperature furnace via two rigid coaxial cables made of steel tubes with ceramic husked steel wires. The other side of the RF-flange is connected by standard RF coaxial cables to the network analyzer, which measures the transfer functionS21. Before starting measurements, the atmosphere inside the furnace is changed to nitrogen in order to reduce oxidation effects. The sample is heated at a slow continuous ramp of 50 K h−1up to the final temperature of 800◦C. The transfer functionS21 is measured in temperature steps of 5 K.
A specially developed signal processing algorithm utiliz-ing cross-correlations, is used for the determination of the precise time delay and for extracting SAW propagation pa-rameters as described in detail in (Shrena et al., 2008, 2009). As shown in (Shrena et al., 2009), using a cross-correlation algorithm gives better accuracy for the determination of time delays in comparison to other methods.
4 Results and discussion
4.1 Materials parameters
4.1.1 Electric properties at elevated temperatures The conductivity of the X- and Z-cut langasite plates is summarized in Fig. 5. The anisotropy of the conductivity is clearly visible.
10 12 14 16 18 10
-9 10
-8 10
-7 10
-6 10
-5 10
-4 10
-3
800700 600 500 400 300
X Z
[
S
/
cm
]
10 4
/T [1/K] T [°C]
Figure 5.Conductivity of LGS as function of temperature.
Figure 6.The full set of elastic stiffness coefficients of langasite as function of temperature calculated from BAW measurements (solid line) in comparison with the data obtained by Weihnacht et al. (2012) (dotted line).
They are used to calculate the stiffness tensor c(T) and the piezoelectric tensore(T) using the respective relations. The elastic stiffness and the piezoelectric coefficient as function of temperature are summarized in Figs. 6 and 7, respectively. A comparison of elastic data from this work with data ob-tained by Weihnacht et al. (2012). Weihnacht et al. (2012) show a very good agreement except for the stiffness coef-ficient c33 which differs by about 5 % from the referenced work. In case of the purely acoustic method as used by (Wei-hnacht et al., 2012) it is possible to measure the phase veloc-ity along the x3 axis directly. However, in case of resonant measurement, the excitation of resonant vibration in this di-rection is not possible. As shown in Eq. (7), all components of piezoelectric tensordorerelated to thex3direction equal zero. Therefore, the stiffness coefficient c33 as well as the elastic compliances33 can be determined using the effective stiffness or compliance resulting from a vibration of a rotated crystal. In the related Eq. (10), the term sin4ϕ , dominates only for 45◦rotated rod and nearly vanishes for all other ro-tation angles. For this reason the coefficientss33andc33 are
Figure 7.The piezoelectric coefficient of langasite as function of temperature.
200 300 400 500 600 700 800 10
-5 10
-4 10
-3
10 -8 10
-7 10
-6 10
-5 10
-4 10
-3 10
-2
Q
-1
T [°C]
x
[
S
/
m
]
Figure 8.The inverse resonant quality factorQ−1and the elec-tric conductivityσXof langasite rod operated at 220 kHz in length
extensional mode of vibration.
most error-prone which explains the small discrepancy men-tioned above.
4.1.3 Temperature-dependent loss
As already mentioned in Sect. 2.1, the electrical conductivity and mechanical properties such as viscosity contribute to the losses in high-temperature piezoelectric materials. The vis-cosity of the langasite rod with the angleϕ=0 (see Fig. 1) expressed in form of the inverse resonant quality factorQ−1
(see Eq. 2) is calculated from the physical fit. These data and the electric conductivityσXare shown in Fig. 8. Here, a
max-imum of loss around 500◦C is clearly visible.
4.2 SAW properties
The characterization of SAW devices is carried out up to about 730◦C where the Zr/Pt-metallization failed through de-wetting and decomposition into droplets as visualized in Fig. 9.
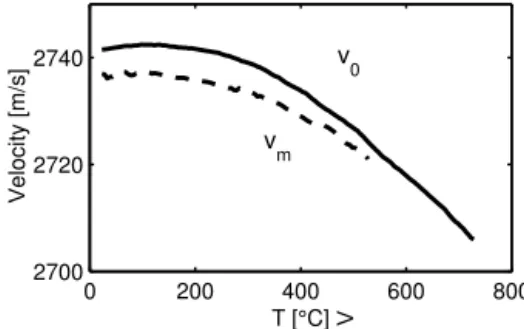
The phase velocities v0 and vm on free and metallized surfaces for the cut (0, 138.5, 26.6◦) are shown in Fig. 10. The obtained phase velocities at room temperature and co-efficients of frequency for a second order polynomial fit are given together with literature data in Table 1.
Figure 9.Dewetted metal layer after heating up to 800◦C.
0 200 400 600 800
2700 2720 2740
T [°C] V
V
elocity [m/s]
v
0
v
m
Figure 10. Phase velocity of Rayleigh waves on free surfacev0 (solid line) and on metallized surfacevm(dotted line), cut (0, 138.5, 26.6◦).
SAW data fork2are caused by the uncertainty of the SAW method. As shown in Eq. (28), k2 results from subtraction of two large numbers which were obtained by an extrap-olation procedure. Furthermore, room temperature data are in satisfactory agreement with the corresponding electrome-chanical coupling coefficient,k2=0.33, calculated from the tensor data given in (Kosinski et al., 2001), and with data obtained by other authors,k2=0.5 (Fachberger et al., 2004) andk2=0.34 (Naumenko and Solie, 2001).
The propagation lossesαon free surfaces for both inves-tigated cuts of langasite are shown in Fig. 12. Similar to the langasite rods operated in length-extensional mode of vibra-tion, SAW devices exhibit a local propagation loss maximum at around 520◦C for all measured frequencies.
The propagation loss on the metallized surface shown in Fig. 13 increases monotonically. However, they exhibit sharp changes of the slope approximately at the same temperature as for the free surface.
4.3 Stability of the electrodes for BAW and SAW resonators
LGS-based SAW and BAW devices exhibit an operation tem-perature limit caused by the stability of the platinum elec-trodes. It is found, that their lifetime drops drastically as their thickness decreases. This effect is described by, e.g., Fire-baugh et al. (1998). Due to this effect the SAW devices used in this work failed at about 730◦C, whereas the BAW
res-Table 1.Comparison of our measurement results with literature data. In case of (Kosinski et al., 2001), the values are calculated using tensor data.
cut v0, m s−1 TCF1, ppm K−1 TCF2, ppb K−2
(0, 138.5, 26.6◦) 2741.9 1.5 −41 (0, 30.1, 26.6◦) 2464.6 28 −39
results of other authors (0, 138.5, 26.6◦)
2741.8a −7a −51a
2734b 1b –
2743c – –
(0, 30.1, 26.6◦) 2462.1
a 31a −69a
2392.1c – –
aFachberger et al. (2004),bNaumenko and Solie (2001),cKosinski et al. (2001).
0 200 400 600 800
0.3 0.4 0.5
T [°C]
k
2 [%]
(0°,138.5°,26.6°)
Figure 11.Coupling coefficientk2for Rayleigh waves on cut (0, 138.5, 26.6◦), calculated with tensor data from BAW measurements (dashed lines) and extracted from SAW measurements (points).
0 200 400 600 800
0 5 10 15 20 25
T [°C]
α
[dB/µs]
150 MHz 450 MHz 750 MHz 1050 MHz
(0°,30.1°,26.6°)
(0°,138.5°,26.6°)
Figure 12.The propagation loss in [dB/µs] of Rayleigh waves on free surface on both cuts (0, 138.5, 26.6◦) and (0, 30.1, 26.6◦), mea-sured at different frequencies.
onators wearing thicker electrodes could be operated up to 900◦C. If more stable electrodes, obtained by, e.g., screen printing, are used, even higher operation temperatures for BAW devices are demonstrated (Fritze, 2011b).
0 200 400 600 800 0
5 10 15 20 25
T [°C]
α
[dB/µs]
150 MHz 450 MHz 750 MHz
(0°,138.5°,26.6°)
Figure 13.The propagation loss in [dB/µs] of Rayleigh waves on metallized surface on cut (0, 138.5, 26.6◦) for different frequencies.
0 200 400 600 800
2400 2500 2600 2700 2800
T [°C]
v [m/s] (0°,30.1°,26.6°)
(0°,138.5°,26.6°)
Figure 14.Comparison of Rayleigh wave velocity on free surface v0obtained from SAW and BAW measurements (solid and dashed lines, respectively).
recent attempts to minimize the degradation of electrodes and prolong the lifetime of SAW elements include use of metal alloys as well as high-temperature ceramic electrodes. Richter et al. report about successful operation of SAW el-ements at 800◦C for several hours using Ti/Pt coated lan-gasite (Richter et al., 2011). Further attempts include appli-cation of thin protective layers, like Al2O3. An example of successful application of multi-layer stack metallization con-sisting of Al/AlxOy/Pt for the high-temperature sensors is
given in (Wall et al., 2015).
4.4 Correlation of SAW-measured phase velocities with calculated BAW data
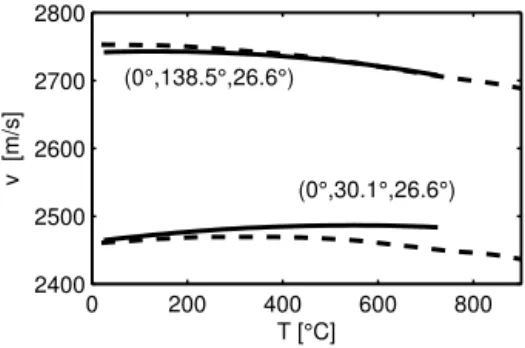
In order to compare the bulk and surface acoustic wave prop-erties, the full set of temperature-dependent materials data is determined using BAW resonators and applied to calculate the phase velocityv0of SAW devices with Euler angles of (0, 138.5, 26.6◦) and (0, 138.5, 26.6◦). As seen in Fig. 14, the results of the calculation and the measured data are in good agreement especially for the (0, 138.5, 26.6◦) cut, which con-firms the validity of the fitted parameters and the calculated materials data.
5 Conclusions
A method of materials data extraction from measured data of BAW resonators is developed for piezoelectric crystals. All components of the stiffness, elastic compliance and piezo-electric tensors for langasite are determined in the temper-ature range from 20 to 900◦C. Furthermore, the conduc-tivity of the crystal in X and Y directions and the qual-ity factor Q for resonant deformations in the X direction are obtained as function of temperature. For these experi-ments, BAW resonators with frequencies in the range 200– 5000 kHz are used. The obtained elastic stiffness tensor is in good agreement with data published by other authors, except for the stiffness coefficientc33, which exhibits a deviation of about 5 % from the literature data.
Based on the obtained tensor data, the phase velocity and the coupling coefficient for SAW propagation of the crystal cuts (0, 138.5, 26.6◦) and (0, 30.1, 26.6◦) is calculated. The same parameters are extracted from measurements of SAW delay lines up to 730◦C, which are fabricated using the crys-tal cuts mentioned above and operated at frequencies from 150 up to 1050 MHz.
Values for the velocity of SAW propagation and coupling coefficients obtained from SAW and from BAW measure-ments show a good agreement. SAW devices exhibit a local maximum of propagation loss at around 520◦C. BAW rods exhibit a maximum of losses at the same temperature.
Thin film Pt electrodes for BAW and SAW devices limit the maximum temperature of measurement to 900 and 730◦C, respectively. The operating temperature may be sig-nificantly increased by application of protective layers and thick electrodes. The latter is, however, feasible in the case of BAW resonators only.
Acknowledgements. The authors thank the German research foundation (Deutsche Forschungsgemeinschaft, DFG) for financial support and the Energy Research Center Niedersachsen.
Edited by: J. Zosel
Reviewed by: two anonymous referees
References
Bardong, J., Schulz, M., Schmitt, M., Shrena, I., Eisele, D., Mayer, E., Reindl, L., and Fritze, H.: Precise measurements of BAW and SAW properties of Langasite in the temperature range from 25 C to 1000 C, in: 2008 IEEE International Frequency Control Sym-posium, 326–331, 2008.
Bechmann, R.: Contour Modes of Square Plates excited Piezoelec-trically and Determination of Elastic and Piezoelectric Coeffi-cients, P. Phys. Soc. Lond., B64, 323–337, 1951.
Bungo, A., Jian, C., Yamaguchi, K., Sawada, Y., Uda, S., and Pis-arevsky, Y.: Analysis of Surface Acoustic Wave Properties of Ro-tated Y-Cut Langasite Substrate, Jpn. J. Appl. Phys., 38, 3239– 3243, 1999.
da Cunha, M. P. and Fagundes, S. D. A.: Investigation on recent quartz-like materials for SAW applications, IEEE Trans. on Ul-trasonics, IEEE Int. Ferro., 46, 1583–1590, 1999.
da Cunha, M. P., Moonlight, T., Lad, R., Bernhard, G., and Frankel, D. J.: Enabling very high temperature acoustic wave devices for sensor & frequency control applications, in: 2007 IEEE Ultra-sonics Symposium, 2107–2110, 2007.
Engan, H.: Surface acsoustic wave multilevel transducers, IEEE T. Son. Ultrason., 6, 395–401, 1975.
Fachberger, R., Holzheu, T., Riha, E., Born, E., Pongratz, P., and Cerva, H.: Langasite and langatate nonuniform material proper-ties correlatedto the performance of SAW devices, in: Frequency Control Symposium and PDA Exhibition, 2001, Proceedings of the 2001 IEEE International, 235–239, 2001.
Fachberger, R., Bruckner, G., Hauser, R., Ruppel, C., Biniasch, J., and Reindl, L.: Properties of radio frequency Rayleigh waves on langasite at elevated temperatures, in: Proc. 2004 IEEE Ultrason-ics Symposium, 1223–1226, 2004.
Firebaugh, S. L., Jensen, K. F., and Schmidt, M. A.: Investiga-tion of High-Temperature DegradaInvestiga-tion of Platinum Thin Films with an In Situ Resistance Measurement Apparatus, J. Micro-electromech. S., 7, 128–135, 1998.
Fritze, H.: High temperature piezoelectric materials: Defect chem-istry and electro-mechanical properties, J. Electroceram., 17, 625–630, 2006.
Fritze, H.: High-temperature piezoelectric crystals and devices, J. Electroceram., 26, 122–161, 2011a.
Fritze, H.: High-temperature bulk acoustic wave sensors, Meas. Sci. Technol., 22, 012002, 2011b.
Fritze, H. and Tuller, H. L.: Langasite for High Temperature Bulk Acoustic Wave Applications, Appl. Phys. Lett., 78, 976–977, 2001.
Fritze, H., Schulz, M., Seh, H., and Tuller, H.: Sensor application-related defect chemistry and electromechanical properties of lan-gasite, Solid State Ionics, 177, 2313–2316, 2006.
Fukuda, T., Takeda, P., Shimamura, K., Kawanaka, H., Kumatoriya, M., Murakami, S., Sato, J., and Sato, M.: Growth of new langa-site single crystals for piezoelectric applications, in: Applications of Ferroelectrics, 1998. ISAF 98, Proceedings of the Eleventh IEEE International Symposium on, 315–319, 1998.
Ikeda, T.: Fundamentals of piezoelectricity, Oxford University Press, Oxford, UK, 1990.
Ingebrigtsen, K. A.: Analysis of interdigital transducers, IEEE T. Son. Ultrason., 403–407, 1972.
Kosinski, J. A., Pastore Jr., R. A., Bigler, E., Pereira da Cunha, M., Malocha, D. C., and Detaint, J.: A Review of Langasite Material Constants from BAW and SAW Data: Toward and Improved Data Set, in: IEEE International Frequency Control Symposium, 278– 286, 2001.
Koskela, J.: Modeling SAW devices including mass-loading effects, Helsinki University of Technology, Helsinki, Finland, 1998. Malocha, D., da Cunha, M., Adler, E., Smythe, R. C., Frederick, S.,
Chou, M., Helmbold, R., and Zhou, Y. S.: Recent Measurements of Material Constants versus Temperature for Langatate, Lan-ganite and Langasite, in: Frequency Control Symposium and
Ex-hibition, 2000. Proceedings of the 2000 IEEE/EIA International, 200–205, 2000.
Mason, W. P.: Physical Acoustics, Principles and Methods, vol. 1A, Academic Press, New York, USA, 1964.
Meitzler, A., Tiersten, H., Warner, A., Berlincourt, D., Couqin, G., and Welsh III, F.: IEEE Standard on Piezoelectricity, ANSI/IEEE Std, IEEE, 1988.
Naumenko, N. and Solie, L.: Optimal cuts of langasite, La3Ga5Sio14 fpr SAW Devices, IEEE T. Ultrason. Ferr., 38, 530–537, 2001.
Peach, R.: A general Green function analysis for SAW devices, in: Proc. IEEE Ultrason. Symp., 221–225, 1995.
Peach, R.: On the existence of surface acoustic waves on piezoelec-tric substrate, IEEE T. Ultrason. Ferr., 49, 1308–1320, 2001. Plessky, V., Koskela, J., Lehtonen, S., and Salomaa, M.: Surface
transverse waves on langasite, in: 1998 IEEE Ultrasonics Sym-posium Proceedings, 139–142, 1998.
Richter, D., Sakharov, S., Forsén, E., Mayer, E., Reindl, L., and Fritze, H.: Thin Film Electrodes for High Temperature Surface Acoustic Wave Devices, Procedia Engineering, 25, 168–171, 2011.
Schneider, T., Richter, D., Doerner, S., Fritze, H., and Hauptmann, P.: Novel impedance interface for resonant high-temperature gas sensors, Sensor. Actuat. B-Chem., 111, 187–192, 2005. Schulz, M. and Fritze, H.: Electromechanical properties of langasite
resonators at elevated temperatures, Renew. Energ., 33, 336–341, 2008.
Sherrit, S. and Mukherjee, B. K.: The Use of Complex Material Constants to Model the Dynamic Response of Piezoelectric Ma-terials, in: IEEE Ultrasonics Symposium, 633–640, 1998. Shrena, I., Eisele, D., Mayer, E., Reindl, L., Bardong, J., and
Schmitt, M.: SAW-relevant material properties of langasite in the temperature range from 25 to 750◦C: New experimental results, in: IEEE Ultrasonics Symposium, 209–212, 2008.
Shrena, I., Eisele, D., Bardong, J., and Reindl, L.: High precision signal processing algorithm to evaluate the SAW properties as a function of temperature, in: IEEE Ultrasonics Symposium, 863– 866, 2009.
Smits, J. G.: Influence of Moving Domain Walls and Jumping Lat-tice Defects on Complex Material Coefficients of Piezoelectrics, IEEE T. Son. Ultrason., SU-23, 168–174, 1976.
Thiele, J. A. and Pereira da Cunha, M.: High temperature LGS SAW gas sensor, Sensor. Actuat. B-Chem., 113, 816–822, 2006. Tuller, H. and Fritze, H.: High-temperature balance, US Patent
6.370.955, 2002.
Wall, B., Gruenwald, R., Klein, M., and Bruckner, G.: A 600◦C Wireless and Passive Temperature Sensor Based on Langasite SAW-Resonators, in: AMA Conferences 2015 – SENSOR 2015 and IRS2 2015, 19–21 May 2015, Nuremberg, Germany, 390– 395, doi:10.5162/sensor2015/C3.3, 2015.
![Figure 7. The piezoelectric coefficient of langasite as function of temperature. 200 300 400 500 600 700 80010-510-410-3 10 -810-710-610-510-410-310-2Q-1 T [°C] x[S/m]](https://thumb-eu.123doks.com/thumbv2/123dok_br/18301068.347680/7.918.527.793.327.484/figure-piezoelectric-coefficient-langasite-function-temperature-q-t.webp)