CPD
6, 1525–1550, 2010Climate signatures of grape harvest dates
Krieger et al.
Title Page
Abstract Introduction
Conclusions References
Tables Figures
◭ ◮
◭ ◮
Back Close
Full Screen / Esc
Printer-friendly Version Interactive Discussion
Discussion
P
a
per
|
Dis
cussion
P
a
per
|
Discussion
P
a
per
|
Discussio
n
P
a
per
|
Clim. Past Discuss., 6, 1525–1550, 2010 www.clim-past-discuss.net/6/1525/2010/ doi:10.5194/cpd-6-1525-2010
© Author(s) 2010. CC Attribution 3.0 License.
Climate of the Past Discussions
This discussion paper is/has been under review for the journal Climate of the Past (CP). Please refer to the corresponding final paper in CP if available.
Climate signatures of grape harvest dates
M. Krieger1,2, G. Lohmann1,2, and T. Laepple1
1
Alfred Wegener Institute for Polar and Marine Research, Bussestr. 24, 27515 Bremerhaven, Germany
2
University of Bremen, Physics Department, Otto-Hahn-Allee, 28359 Bremen, Germany Received: 9 July 2010 – Accepted: 28 July 2010 – Published: 17 August 2010
Correspondence to: M. Krieger ([email protected])
CPD
6, 1525–1550, 2010Climate signatures of grape harvest dates
Krieger et al.
Title Page
Abstract Introduction
Conclusions References
Tables Figures
◭ ◮
◭ ◮
Back Close
Full Screen / Esc
Printer-friendly Version Interactive Discussion
Discussion
P
a
per
|
Dis
cussion
P
a
per
|
Discussion
P
a
per
|
Discussio
n
P
a
per
Abstract
Grape harvest dates have been recorded in many European locations for several cen-turies, and potentially contain important information about past climate. In this study, we systematically analyse the relationship of grape harvest dates recorded in the Bur-gundy region (France) with different climate data sets in order to understand the
con-5
nection between climatic conditions and the time of harvest. The results point to a primary dependence of the grape harvest on the temperature from April to August. The strength of this connection depends on the winter to summer temperature rela-tionship and increases over the last 100 years. The grape harvest date is also related to the winter temperature. This connection is non-stationary on interannual, but
sta-10
ble on decadal-to-multidecadal time scales. Therefore, the grape harvest date can be used for independent reconstructions of local April-to-August temperature on interan-nual time scales as well as remote winter temperature on decadal-to-multidecadal time scales.
1 Introduction
15
To understand climate variability, it is important to obtain climate information reaching back further than the instrumental period, covering the last two centuries. Besides some scattered historical recordings, the only possibility to gather this information is given by so-called proxy data, which do not display any direct information on climate variables but are closely related with the latter.
20
A particular proxy data set is the annually varying grape harvest date (GHD). GHDs have been documented in many European locations for several centuries and are strongly linked with temperature conditions (Jones, 2003; Chuine et al., 2004; Meier et al., 2007). Thus, the GHD can be possibly used for temperature reconstructions. But there are a few limitations due to non-climatic impacts on the GHD, which have to
25
CPD
6, 1525–1550, 2010Climate signatures of grape harvest dates
Krieger et al.
Title Page
Abstract Introduction
Conclusions References
Tables Figures
◭ ◮
◭ ◮
Back Close
Full Screen / Esc
Printer-friendly Version Interactive Discussion
Discussion
P
a
per
|
Dis
cussion
P
a
per
|
Discussion
P
a
per
|
Discussio
n
P
a
per
|
and wine types (Meier et al., 2007; Garcia de Cortazar-Atauri et al., 2010). Further-more, missing years of observation can be a problem. Hence, the data quality differs from place to place. In some cases, the data are only sufficient for qualitative analysis like in the Czech Republic (Br ´azdil et al., 2008). In the case of Besanc¸on (France), ar-guable dates could be identified and discarded in order to build a climatic GHD series
5
(Garnier et al., 2010). In the case of the Burgundy region in France, several homo-geneous GHD series are available and are combined to one GHD series to reduce non-climatic impacts (Chuine et al., 2004).
Despite these difficulties, GHDs have been used for several temperature recon-structions mainly for the spring and summer temperature. Chuine et al. (2004)
re-10
constructed April-to-August temperature in France using a process-based phenology model. Meier et al. (2007) used linear-regression to reconstruct Swiss April-to-August temperature. GHD series were applied for bi-proxy (Etien et al., 2008) and multi-proxy-reconstructions (Etien et al., 2009; Guiot et al., 2005; Mann et al., 2008) as well as for checking other reconstructions (Br ´azdil et al., 2010; Masson-Delmotte et al., 2005).
15
The GHD was also taken into account to discuss the summer heatwave in 2003 (Chuine et al., 2004; Menzel, 2005; Garc´ıa-Herrera et al., 2010; Keenan, 2007).
Besides the spring and summer temperature dependence another interpretation of the GHD was given by Souriau and Yiou (2001), who found a relationship to the North Atlantic Oscillation (NAO). A different approach to analyse the GHD was performed by
20
Schleip et al. (2008), who used the Bayesian analysis to detect nonlinearities within the GHD series. Thereby, the June temperature was found to be most important for the GHD.
In this study we focus on the climatic impacts on the GHD during the instrumental period. Therefore, we give a systematic approach by analysing field correlations of
25
CPD
6, 1525–1550, 2010Climate signatures of grape harvest dates
Krieger et al.
Title Page
Abstract Introduction
Conclusions References
Tables Figures
◭ ◮
◭ ◮
Back Close
Full Screen / Esc
Printer-friendly Version Interactive Discussion
Discussion
P
a
per
|
Dis
cussion
P
a
per
|
Discussion
P
a
per
|
Discussio
n
P
a
per
2 Methods and data
The GHD series (Fig. 1) is taken from Chuine et al. (2004) and covers the period from 1370 to 2003, except for the year 1978. It is based on the GHD series from Le Roy Ladurie (1983). The GHDs were recorded in 18 cities and villages in the Bur-gundy region in France. The Dijon series is defined as reference because it is the
5
longest series. The other 17 series were standardised that they present the same av-erage harvest date as the Dijon series. The final GHD series presents the median date for each year of all 18 series (for detailed description see Chuine et al., 2004). As the Dijon series is the reference series, we mark Dijon in the resulting correlation maps. Non-climatic impacts on the GHD are discussed by Garc´ıa-Herrera et al. (2010); Meier
10
et al. (2007) and Souriau and Yiou (2001). As we primarily analyse the instrumental period, we assume that the GHD is first of all driven by the climate in this period.
We analyse the relationship of the GHD series with several gridded climate data sets. Monthly instrumental data (0.5◦×0.5◦) of near surface temperature, precipitation and total cloud cover are taken from the Climate Research Unit (CRU) (Mitchell et al.,
15
2003) and cover the years from 1901 to 2002. A monthly historical sea level pressure (SLP) data set (5◦×5◦), covering the time from 1899 to 2007, is taken from Trenberth and Paolino Jr. (1980). Furthermore, the monthly sea surface temperature (SST) data set from Kaplan et al. (1998) is used. We also test several reconstruction data sets: near surface temperature (0.5◦×0.5◦) from 1500 to 2002 (Luterbacher et al., 2004),
20
SLP (5◦×5◦) from 1659 to 1999 (Luterbacher et al., 2002) and precipitation (0.5◦×0.5◦) from 1500 to 2000 (Pauling et al., 2006).
The missing value for the year 1978 is excluded in the correlation process except when using filtered data. Lagged GHD series are used, when we examine if earlier years have an influence on the GHD. To test the significance of the correlation, we apply
25
CPD
6, 1525–1550, 2010Climate signatures of grape harvest dates
Krieger et al.
Title Page
Abstract Introduction
Conclusions References
Tables Figures
◭ ◮
◭ ◮
Back Close
Full Screen / Esc
Printer-friendly Version Interactive Discussion
Discussion
P
a
per
|
Dis
cussion
P
a
per
|
Discussion
P
a
per
|
Discussio
n
P
a
per
|
maps, areas of local significant correlation are shaded.
The running correlation is computed, if the stability of the correlation over time is analysed. Therefore, we choose a 50-year time window which moves by one-year steps through the whole time period. It is known that stochastic fluctuations can lead to large variations in correlations between two time series (Gershunov et al., 2001; Sterl
5
et al., 2007). Hence, we use the Monte Carlo procedure described by Sterl et al. (2007) to test the significance of the variations of the correlation through time.
In certain analyses, we use a low-pass filter prior to the correlation analysis. In these cases, the significance of the correlation is established using Monte Carlo experiments in which the same filter is applied on surrogate time series (N=5000).
10
3 Results
3.1 Spring and summer relationship
We correlate the GHD series (Chuine et al., 2004) with the near surface temperature from CRU (Mitchell et al., 2003). The results for the European region for all four sea-sons are shown in Fig. 2.
15
There is no noteworthy correlation in boreal winter (average temperature for Decem-ber, January and February (DJF)). Only some regions in Ireland, Spain and Morocco show a significant correlation. In spring (MAM) a highly negative correlation of up to
ρ=−0.6 can be detected across Europe. The minimum lies over Southern France. With growing distance from Southern France, the correlation gets weaker. Nevertheless, the
20
significant area spans over nearly the whole area of Europe. A similar picture occurs for the summer (JJA). Here the negative correlation is even stronger. Compared with spring, the significant area is shifted to the south-west. There is no significant positive correlation either. In autumn (SON) as well as in winter there are hardly any significant areas. The maximum correlation is below|ρ|=0.35. A common feature shared by all
25
CPD
6, 1525–1550, 2010Climate signatures of grape harvest dates
Krieger et al.
Title Page
Abstract Introduction
Conclusions References
Tables Figures
◭ ◮
◭ ◮
Back Close
Full Screen / Esc
Printer-friendly Version Interactive Discussion
Discussion
P
a
per
|
Dis
cussion
P
a
per
|
Discussion
P
a
per
|
Discussio
n
P
a
per
winter and very high in spring and summer. Field correlations with the reconstructed temperature data set from Luterbacher et al. (2004) yield similar results with highly negative correlation in spring (MAM) and in summer (JJA) (not shown).
A detailed analysis of individual months indicates that the most important time for the GHD is the period from April to August. In Fig. 3a we correlate the GHD series
5
(Chuine et al., 2004) with the average April-to-August near surface temperature from CRU (Mitchell et al., 2003). There is almost the same signature as for spring (MAM) and summer (JJA) in Fig. 2, but the correlation is even higher. The maximum of the correlation is located over the Burgundy region (ρ=−0.8). The correlation with the reconstructed averaged spring and summer temperature from Luterbacher et al. (2004)
10
yields slightly lower values (ρ=−0.7) (not shown).
To investigate if the correlation is stable over time during the instrumental period, we calculate the running correlation of the GHD series with an index of the April-to-August temperature over France (5.5◦W to 6◦E; 42◦N to 51.5◦N). The length of the time window is chosen to 50 years. The correlation coefficient decreases evenly from
15
ρ=−0.6 centred at 1925 to ρ=−0.85 centred at 1975 (Fig. 3b). This difference is significant (p<0.01).
Analogies with the temperature correlation can be found in the correlation with data sets of cloud cover and precipitation in JJA from CRU (Mitchell et al., 2003) as well as with SLP according to Trenberth and Paolino Jr. (1980) (Fig. 4). The correlation maps of
20
cloud cover (Fig. 4a) and precipitation (Fig. 4b) are very much alike with a local positive correlation. In contrast, SLP is negatively correlated with the GHD series (Fig. 4c). The analysis of reconstructed SLP (Luterbacher et al., 2002) and precipitation (Pauling et al., 2006) yield similar results.
The analysis of the relationship of the GHD series with the SST (Kaplan et al., 1998)
25
CPD
6, 1525–1550, 2010Climate signatures of grape harvest dates
Krieger et al.
Title Page
Abstract Introduction
Conclusions References
Tables Figures
◭ ◮
◭ ◮
Back Close
Full Screen / Esc
Printer-friendly Version Interactive Discussion
Discussion
P
a
per
|
Dis
cussion
P
a
per
|
Discussion
P
a
per
|
Discussio
n
P
a
per
|
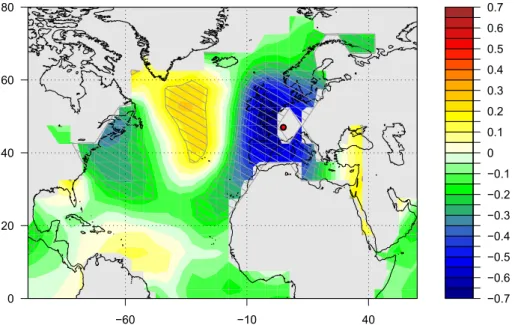
Furthermore, we detect a pattern with positively correlated centres in the tropical North Atlantic (55◦W and 10◦N) as well as east of the Labrador Sea (30◦W and 60◦N) and negative centres near the east coast of the United States (60◦W and 40◦N) and in Europe. This temperature pattern persists in all four seasons (DJF: see Fig. 9a, MAM and SON: not shown).
5
3.2 Winter relationship
In the previous section, we detected a strong correlation of the GHD series with the April-to-August-temperature. In the following, we examine whether data sets in winter show considerable correlations with the GHD as well. If such a correlation is found, it does not imply that direct climatic information on winter is contained in the GHD.
10
The winter season might also have an indirect impact on the grape-vine by influencing the temperature in the period from April to August, to which the vine is closely related (Fig. 3).
To investigate this, we correlate every data set that we examine additionally with the time series of the April-to-August temperature (AAT). The time series is created
15
by averaging the AAT over the region of France. It is the same index that is used for the running correlation in Fig. 3b, but with reversed sign for better comparison with the GHD series. Only in case of a notable difference between the correlations of the ATT time series and the GHD series, it is likely that the GHD contains direct information on the winter.
20
Now, we analyse the outcome where the GHD series and the lagged GHD series (one-year and two-year lag) is used so that we were able to determine the influence of previous winters as well. The relationship of the GHD with winter near surface temperature (Mitchell et al., 2003) is shown in Fig. 2a. All of Europe is correlated slightly negative. Only Asia Minor has a slightly positive correlation. The correlations
25
CPD
6, 1525–1550, 2010Climate signatures of grape harvest dates
Krieger et al.
Title Page
Abstract Introduction
Conclusions References
Tables Figures
◭ ◮
◭ ◮
Back Close
Full Screen / Esc
Printer-friendly Version Interactive Discussion
Discussion
P
a
per
|
Dis
cussion
P
a
per
|
Discussion
P
a
per
|
Discussio
n
P
a
per
shown), with or without lag, do not show considerable differences from the correlations of the GHD series described here.
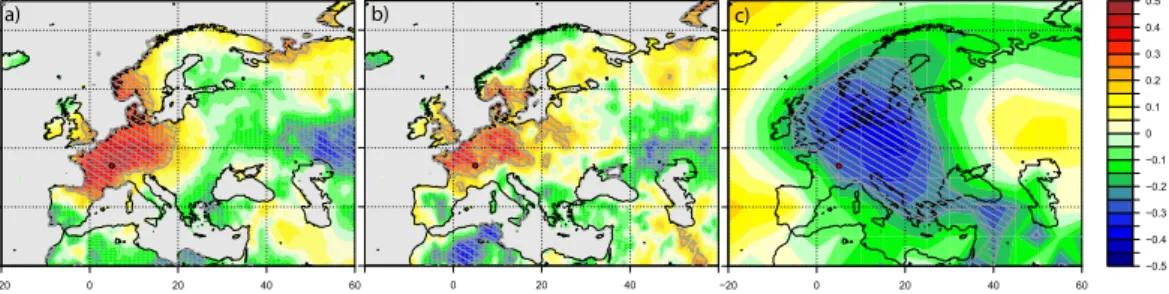
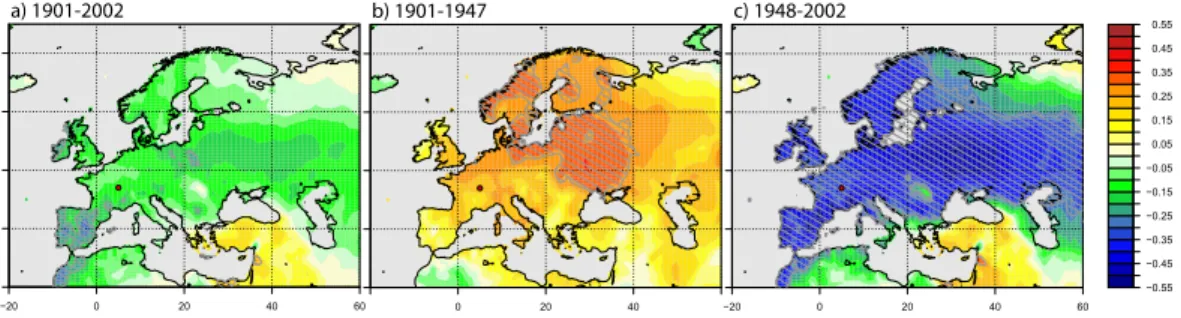
If the total period is partitioned and the correlation is calculated for the single time sections, a remarkable picture appears: the relationship of the GHD and the winter temperature seems to be strongly time-dependent. In the time section from 1901 to
5
1947, the entire European mainland is positively correlated (Fig. 7b). By contrast, in the time period from 1948 to 2002, all of Europe has a strong negative correlation (Fig. 7c). The patterns of the individual time sections are thus opposed. The rela-tionship of the AAT time series with the winter temperature shows a similar behaviour (not shown). The time-dependence of the relationship is statistically significant in both
10
datasets (p<0.01, running correlation, 50 year window).
In Fig. 8, the correlation of the SLP (Trenberth and Paolino Jr., 1980) with the GHD series is shown for different time sections. For the total time period from 1899 to 2003 (Fig. 8a), a weak dipole pattern can be discerned: the boundaries between positive correlation in the north and negative correlation in the south run mostly between 40◦N
15
and 60◦N. The results with lagged GHD series (one- and two-year) for the total time period are characterised by similar pattern, but with slightly higher correlations (not shown). The correlations with the AAT time series, with or without lag, do not lead to any considerable differences (not shown).
As in the case of the temperature the partitioned time sections before and after 1948
20
are opposed (Fig. 8b,c). A pattern similar to the one obtained for the total period (1899 to 2003) appears from 1948 to 2003 (Fig. 8c), however, with a considerably stronger correlation. In contrast, the pattern in the period from 1899 to 1947 shows a negative correlation in the north and a positive correlation in the south (Fig. 8b).
The correlation of the GHD series with the winter SST (Kaplan et al., 1998) for the
25
CPD
6, 1525–1550, 2010Climate signatures of grape harvest dates
Krieger et al.
Title Page
Abstract Introduction
Conclusions References
Tables Figures
◭ ◮
◭ ◮
Back Close
Full Screen / Esc
Printer-friendly Version Interactive Discussion
Discussion
P
a
per
|
Dis
cussion
P
a
per
|
Discussion
P
a
per
|
Discussio
n
P
a
per
|
visibly differs from the GHD series (not shown). The areas of negative correlation are substantially more distinct and stronger while the areas of positive correlation are weaker. The basic pattern, however, remains unchanged.
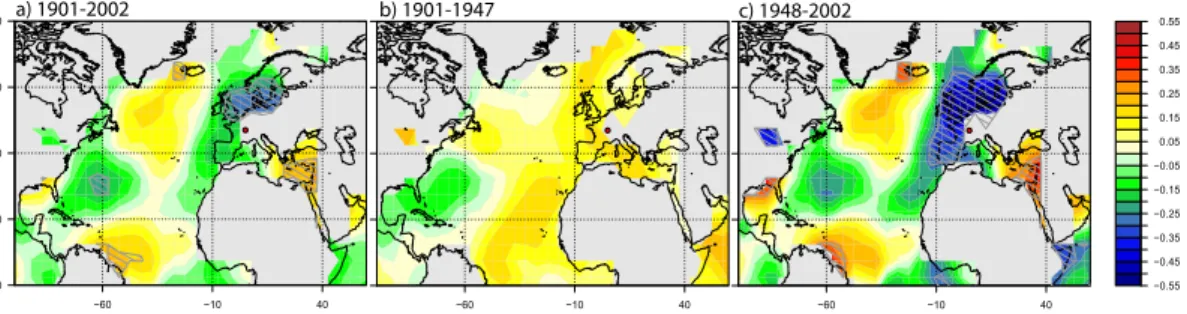
Between the time sections from 1900 to 1947 and from 1948 to 2003, substantial differences are also detected (Fig. 9): in the second time section (c), a pattern,
resem-5
bling that of the total period (a), can clearly be seen. By contrast, practically no pattern can be discerned in the first time section from 1900 to 1947 (b).
For all examined variables, the results of lagged data (no matter if the lag is one or two) show quit similar correlation pattern compared to the unlagged GHD series. This indicates a long term component in the GHD series. Hence, we analyse the
decadal-to-10
multidecadal relationship using a low-pass filter (10 year cutoff,n=21, finite response filter).
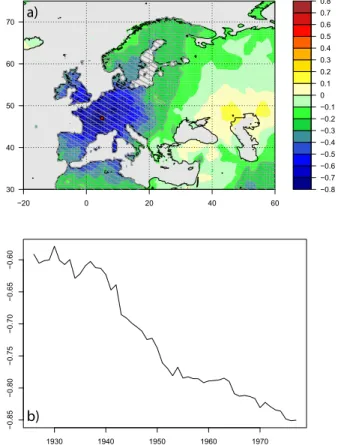
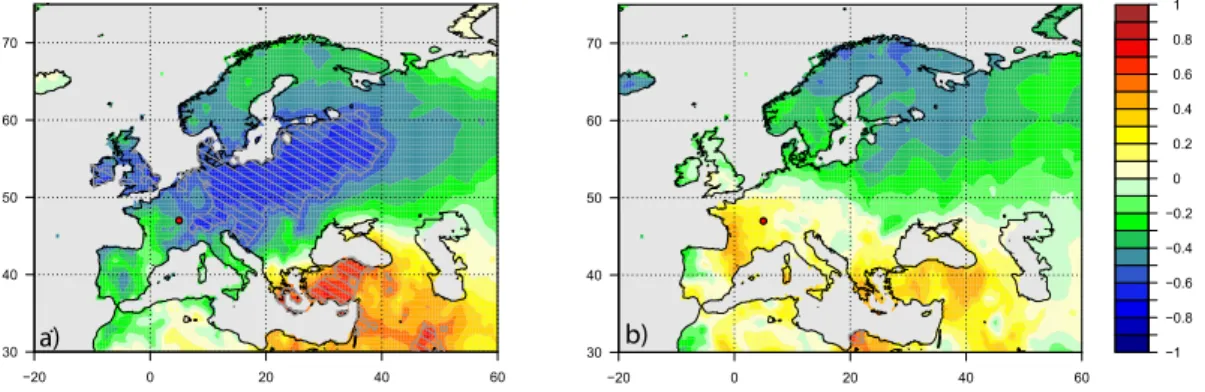
Figure 10a shows the relationship of the filtered GHD series with the filtered winter near surface temperature from CRU (Mitchell et al., 2003). All of Europe is negatively correlated; values of up to ρ=−0.7 are reached. The highest values are in Central
15
and Eastern Europe. Western Europe is also still considerably negatively correlated. Asia Minor is in contrast strongly positively correlated. The correlation of the filtered AAT time series with the winter temperature clearly deviates from this result (Fig. 10b). Here, parts of Central Europe exhibit a slightly positive correlation. Especially, the region of France is positively correlated. Negative correlation can be found mainly in
20
Northern Scandinavia and in the Baltic countries. In total, only values aroundρ=−0.5 are reached.
4 Discussion
4.1 Spring and summer relationship
The near surface temperature in winter and autumn seems to have a minimal impact
25
CPD
6, 1525–1550, 2010Climate signatures of grape harvest dates
Krieger et al.
Title Page
Abstract Introduction
Conclusions References
Tables Figures
◭ ◮
◭ ◮
Back Close
Full Screen / Esc
Printer-friendly Version Interactive Discussion
Discussion
P
a
per
|
Dis
cussion
P
a
per
|
Discussion
P
a
per
|
Discussio
n
P
a
per
over Europe. The correlation with averaged temperature from April to August (Fig. 3) is even higher. The time from April to August coincide with the vine phenology phases before bloom and before veraison (Jones, 2003). The temperature in this period is cru-cial for the GHD (Chuine et al., 2004; Meier et al., 2007; Menzel, 2005). In contrast, the time from veraison to harvest is nearly constant and temperature independent (Chuine
5
et al., 2004; Garcia de Cortazar-Atauri et al., 2010). This matches with our result that in autumn no significant negative correlation can be found anymore (Fig. 2d).
Besides the temperature relationship, other data sets are in connection with the GHD as well. The summer SST of the offshore sea surrounding Europe shows a strong connection to the GHD. This implies that the GHD is in relationship with large-scale
10
climate patterns. Furthermore, cloud cover and precipitation are positively correlated across France in summer, whereas SLP, by contrast, is negatively correlated (Fig. 4). These three results fit together with the temperature result, because high sea level pressure, slight cloud cover and slight precipitation are signs of fair weather, and are thus in connection with high temperature, and vice versa.
15
The analysis of the spring and summer month leads to very consistent results. The Burgundy GHD series seems to be well suited to reconstruct the regional and Western Europe near surface temperature, especially in the time range from April to August as it has been done in several publications (Chuine et al., 2004; Etien et al., 2008, 2009; Guiot et al., 2005). Furthermore, the GHD series could give an input for SST
20
reconstruction in offshore areas in summer.
It is noticeable that the spring and summer dependence occurs in all applied re-construction data sets. Temperature from 1500 to 2002 (Luterbacher et al., 2004), SLP from 1659 to 1999 (Luterbacher et al., 2002) and precipitation from 1500 to 2000 (Pauling et al., 2006) (all not shown) yield almost similar results compared to the
in-25
CPD
6, 1525–1550, 2010Climate signatures of grape harvest dates
Krieger et al.
Title Page
Abstract Introduction
Conclusions References
Tables Figures
◭ ◮
◭ ◮
Back Close
Full Screen / Esc
Printer-friendly Version Interactive Discussion
Discussion
P
a
per
|
Dis
cussion
P
a
per
|
Discussion
P
a
per
|
Discussio
n
P
a
per
|
4.2 Winter relationship
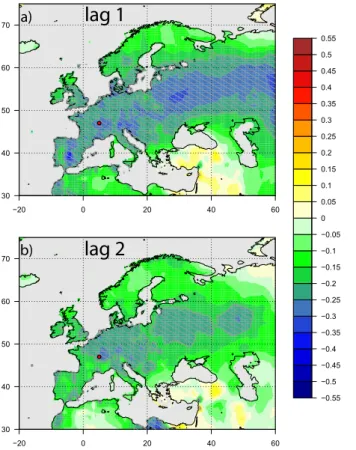
If unfiltered, the winter near surface temperature is only weakly correlated with the GHD series (Fig. 7a). It is remarkable that the one- and two-year lagged GHD series show a similar correlation pattern (Fig. 6). This implies that there is no conclusive impact of a particular winter on the GHD, but rather a long-term connection. This is
5
confirmed by the examination of the low-pass filtered data: the temperature in Europe is significantly negatively correlated with the GHD series (Fig. 10a). It is important that, by contrast, the correlation of the April-to-August temperature (AAT) time series displays obvious differences (Fig. 10b). The long-term connection between GHD and winter temperature thus seems to exist independently from the AAT. An explanation
10
for this relationship could be that the vine adapts to the climatic conditions in winter in the medium term. For example, its development starts earlier after several mild winters. But it remains open, why the centre of negative correlation is shifted to the east, in particular the Burgundy region is not significantly correlated. It is likely that the temperature in winter is not the only long-term impact on the GHD. Further studies
15
are necessary to investigate all long-term components of the GHD series. Anyway, our analysis indicates that the GHD can be used for the reconstruction of Eastern Europe winter temperature on decadal-to-multidecadal time scales (Fig. 10a).
The connection between the GHD and the winter temperature leads to the question, if there also is a link to the NAO. The correlation map of the GHD series with the
20
SLP shows only a weak dipole pattern, which slightly looks similar to a NAO-pattern (Fig. 8a). Likewise, the GHD-SST correlation yields a temperature pattern, which looks similar to a NAO-SST pattern (Rodwell et al., 1999). It can be seen in all four seasons and is stronger than expected, considering the SLP pattern (DJF: Fig. 9a; JJA: Fig. 5; MAM/SON: not shown). This is possibly caused by the temperature memory of the
25
CPD
6, 1525–1550, 2010Climate signatures of grape harvest dates
Krieger et al.
Title Page
Abstract Introduction
Conclusions References
Tables Figures
◭ ◮
◭ ◮
Back Close
Full Screen / Esc
Printer-friendly Version Interactive Discussion
Discussion
P
a
per
|
Dis
cussion
P
a
per
|
Discussion
P
a
per
|
Discussio
n
P
a
per
We also analysed the relationship of the GHD and the SLP using filtered data (10 year cutofflow pass filter, not shown). The results point to a long-term connection of the GHD and the NAO although the interannual relation is non-stationary (Fig. 8). A high correlation of the filtered series with NAO is described by Souriau and Yiou (2001). A detailed analysis of this decadal-to-multidecadal relation is beyond the scope of the
5
present study.
4.3 Stability of the correlations over time
In the winter season the correlations of all examined data sets with the GHD are non-stationary on interannual time scale. For temperature (Fig. 7) as well as for SLP (Fig. 8), the results of the period from 1901 to 1947 and the period from 1948 to 2002 are
10
opposed. For SST (Fig. 9), it is hardly possible to recognise a structure in the first time section while in the second time section an NAO-like pattern clearly exists. The non-stationarity of the temperature relationship is statistically significant (p<0.01). All these differences are also represented by the AAT time series. The correlation with temperature (statistically significant withp<0.01), SLP and SST show the same abrupt
15
change in the middle of the 20th century (not shown). Hence, it is very likely that the stationarity of the GHD-winter temperature relationship is caused by the non-stationary AAT-winter temperature relationship.
Nevertheless, obvious differences between the time periods cannot only be found in winter. The running correlation of the GHD series with the AAT significantly (p<0.01)
20
increases from the first to the second half of the 20th century (Fig. 3b). Garcia de Cortazar-Atauri et al. (2010) found the same variation for the Burgundy GHD series and for the GHD data set from Paris. Meier et al. (2007) noted an increasing correlation of the Swiss GHD series with temperature and proxy data sets in the 20th century. Since several GHD series show this trend, it is very unlikely caused by flaws of the GHD
25
CPD
6, 1525–1550, 2010Climate signatures of grape harvest dates
Krieger et al.
Title Page
Abstract Introduction
Conclusions References
Tables Figures
◭ ◮
◭ ◮
Back Close
Full Screen / Esc
Printer-friendly Version Interactive Discussion
Discussion
P
a
per
|
Dis
cussion
P
a
per
|
Discussion
P
a
per
|
Discussio
n
P
a
per
|
and warm (cold) spring-summers coincide, the GHD-AAT relationship is stronger. This happened in the second half of the 20th century. If warm (cold) winters and cold (warm) spring-summers coincide, the GHD-AAT relationship is weaker. This occurred in the first half of the 20th century. In other words, a positive correlation of winter and spring-summer temperature enhances the GHD-AAT connection.
5
5 Conclusions
The aim of this work was to identify the climatic information contained in the grape harvest date of the Burgundy region. By analysing spatial correlations with several data sets we found three main results:
Firstly, the April-to-August temperature has the largest influence on the harvest date. In
10
large parts of Europe, the correlation with the grape harvest date reaches high negative values (up toρ=−0.8). This agrees with our intuition: warm weather causes an early harvest. Furthermore, the time period from April to August corresponds exactly to the vine’s temperature-sensitive developmental phases. This relationship is confirmed by other data sets, which are in connection with temperature, e.g. total cloud cover,
15
precipitation and sea level pressure. These results justify a reconstruction of the mean April-to-August temperature.
Secondly, the April-to-August temperature is not the only climatic information that is contained in the grape harvest date. We found a long-term impact of the winter temperature on the grape harvest date, which is independent of the April-to-August
20
CPD
6, 1525–1550, 2010Climate signatures of grape harvest dates
Krieger et al.
Title Page
Abstract Introduction
Conclusions References
Tables Figures
◭ ◮
◭ ◮
Back Close
Full Screen / Esc
Printer-friendly Version Interactive Discussion
Discussion
P
a
per
|
Dis
cussion
P
a
per
|
Discussion
P
a
per
|
Discussio
n
P
a
per
Thirdly, the interannular relation of the GHD to the winter temperature shows a strong non-stationarity, which is caused by the non-stationary relationship of winter to summer temperature. This also affects the correlation of the grape harvest date and the April-to-August temperature: a weaker relationship is detected prior to the forties.
To summarise, the grape harvest date contains substantial climatic information and is
5
well-suited to reconstruct the interannual variations of the April-to-August temperature. It can also supply long-term information of the winter temperature in Central Europe. The temporal variations of the correlations over time should be taken into account for reconstructions.
Acknowledgements. We thank I. Chuine, K. Trenberth and Jr. Paolino, A. Kaplan, J.
Luter-10
bacher, A. Pauling as well as the Climate Research Unit for making the data available.
References
Br ´azdil, R., Zahradn´ıˇcek, P., Dobrovoln`y, P., Kotyza, O., and Val ´aˇsek, H.: Historical and re-cent viticulture as a source of climatological knowledge in the Czech Repubulic, Geografie-Sbornik Ceske geograficke spolecnosti, 113, 351–371, 2008. 1527
15
Br ´azdil, R., Dobrovoln`y, P., Luterbacher, J., Moberg, A., Pfister, C., Wheeler, D., and Zorita, E.: European climate of the past 500 years: new challenges for historical climatology, Climatic Change, 101, 7–40, doi:10.1007/s10584-009-9783-z 1–34, 2010. 1527
Chuine, I., Yiou, P., Viovy, N., Seguin, B., Daux, V., and Le Roy Ladurie, E.: Grape ripening as a past climate indicator, Nature (London), 432, 289–290, 2004. 1526, 1527, 1528, 1529,
20
1530, 1534, 1541, 1542, 1543, 1544, 1545
Dietrich, G.: Allgemeine Meereskunde: Eine Einf ¨uhrung in die Ozeanographie, Gebr. Born-traeger, Berlin-Nikolassee, p. 492, 1957. 1535
Etien, N., Daux, V., Masson-Delmotte, V., Stievenard, M., Bernard, V., Durost, S., Guillemin, M. T., Mestre, O., and Pierre, M.: A bi-proxy reconstruction of Fontainebleau (France) growing
25
season temperature from A.D. 1596 to 2000, Clim. Past, 4, 91–106, doi:10.5194/cp-4-91-2008, 2008. 1527, 1534
CPD
6, 1525–1550, 2010Climate signatures of grape harvest dates
Krieger et al.
Title Page
Abstract Introduction
Conclusions References
Tables Figures
◭ ◮
◭ ◮
Back Close
Full Screen / Esc
Printer-friendly Version Interactive Discussion
Discussion
P
a
per
|
Dis
cussion
P
a
per
|
Discussion
P
a
per
|
Discussio
n
P
a
per
|
over the past century: instrumental data versus multiple proxies (tree-ring isotopes, grape harvest dates and forest fires), Climatic Change, 94, 429–456, 2009. 1527, 1534
Garcia de Cortazar-Atauri, I., Daux, V., Garnier, E., Yiou, P., Viovy, N., Seguin, B., Boursiquot, J., Parker, A., van Leeuwen, C., and Chuine, I.: Climate reconstructions from grape harvest dates: Methodology and uncertainties, Holocene, 20, 599–608,
5
doi:10.1177/0959683609356585, 2010. 1527, 1534, 1536
Garc´ıa-Herrera, R., Diaz, J., Trigo, R., Luterbacher, J., and Fischer, E.: A review of the Eu-ropean summer heat wave of 2003, Crit. Rev. Env. Sci. Tec., 40, 267–306, 2010. 1527, 1528
Garnier, E., Daux, V., Yiou, P., and Garc´ıa de Cort ´azar-Atauri, I.: Grapevine harvest dates in
10
Besanc¸on (France) between 1525 and 1847: Social outcomes or climatic evidence?, Climatic Change, doi:10.1007/s10584-010-9810-0, 1–25, 2010. 1527
Gershunov, A., Schneider, N., and Barnett, T.: Low-Frequency Modulation of the ENSO-Indian Monsoon Rainfall Relationship: signal or noise?, J. Climate, 14, 2486–2492, 2001. 1529 Guiot, J., Nicault, A., Rathgeber, C., Edouard, J., Guibal, F., Pichard, G., and Till, C.:
15
Last-millennium summer-temperature variations in Western Europe based on proxy data, Holocene, 15, 489–500, doi:10.1191/0959683605hl819rp, 2005. 1527, 1534
Jones, G.: Winegrape phenology, Phenology: An Integrative Environmental Science, Kluwer Academic Publishers, Dordrecht, The Netherlands, 523–539, 2003. 1526, 1534
Kaplan, A., Cane, M., Kushnir, Y., Clement, A., Blumenthal, M., and Rajagopalan, B.: Analyses
20
of global sea surface temperature 1856–1991, J. Geophys. Res., 103, 18567–18589, 1998. 1528, 1530, 1532, 1545, 1549
Keenan, D.: Grape harvest dates are poor indicators of summer warmth, Theor. Appl. Climatol., 87, 255–256, doi:10.1007/s00704-006-0197-9, 2007. 1527
Le Roy Ladurie, E.: Histoire du climat depuis l’an mil, Champs Flammarion, Paris, 1983. 1528
25
Luterbacher, J., Xoplaki, E., Dietrich, D., Rickli, R., Jacobeit, J., Beck, C., Gyalistras, D., Schmutz, C., and Wanner, H.: Reconstruction of sea level pressure fields over the East-ern North Atlantic and Europe back to 1500, Clim. Dynam., 18, 545–561, 2002. 1528, 1530, 1534
Luterbacher, J., Dietrich, D., Xoplaki, E., Grosjean, M., and Wanner, H.: European seasonal
30
and annual temperature variability, trends, and extremes since 1500, Science, 303, 1499– 1503 doi:10.1126/science.1093877, 2004. 1528, 1530, 1534
CPD
6, 1525–1550, 2010Climate signatures of grape harvest dates
Krieger et al.
Title Page
Abstract Introduction
Conclusions References
Tables Figures
◭ ◮
◭ ◮
Back Close
Full Screen / Esc
Printer-friendly Version Interactive Discussion
Discussion
P
a
per
|
Dis
cussion
P
a
per
|
Discussion
P
a
per
|
Discussio
n
P
a
per
reconstructions of hemispheric and global surface temperature variations over the past two millennia, Proc. Natl. Acad. Sci., 105, 13252–13257 doi:10.1073/pnas.0805721105, 2008. 1527
Masson-Delmotte, V., Raffalli-Delerce, G., Danis, P., Yiou, P., Stievenard, M., Guibal, F., Mestre, O., Bernard, V., Goosse, H., Hoffmann, G. et al.: Changes in European
precipita-5
tion seasonality and in drought frequencies revealed by a four-century-long tree-ring isotopic record from Brittany, Western France, Clim. Dynam., 24, 57–69, 2005. 1527
Meier, N., Rutishauser, T., Pfister, C., Wanner, H., and Luterbacher, J.: Grape harvest dates as a proxy for Swiss April to August temperature reconstructions back to AD 1480, Geophys. Res. Lett., 34, L20705, doi:10.1029/2007GL031381, 2007. 1526, 1527, 1528, 1534, 1536
10
Menzel, A.: A 500 year pheno-climatological view on the 2003 heatwave in Europe assessed by grape harvest dates, Meteorol. Z., 14, 75–77, 2005. 1527, 1534
Mitchell, T., Carter, T., Jones, P., Hulme, M., and New, M.: A comprehensive set of high-resolution grids of monthly climate for Europe and the globe: the observed record (1901– 2000) and 16 scenarios (2001–2100), J. Climate, submitted, 2003. 1528, 1529, 1530, 1531,
15
1533, 1542, 1543, 1544, 1546, 1547, 1550
Pauling, A., Luterbacher, J., Casty, C., and Wanner, H.: Five hundred years of gridded high-resolution precipitation reconstructions over Europe and the connection to large-scale circu-lation, Clim. Dynam., 26, 387–405, 2006. 1528, 1530, 1534
Rodwell, M., Rowell, D., and Folland, C.: Oceanic forcing of the wintertime North Atlantic
Os-20
cillation and European climate, Nature, 398, 320–323, 1999. 1535
Schleip, C., Rutishauser, T., Luterbacher, J., and Menzel, A.: Time series modeling and central European temperature impact assessment of phenological records over the last 250 years, J. Geophys. Res., 113, G04026, doi:10.1029/2007JG000646, 2008. 1527
Souriau, A. and Yiou, P.: Grape harvest dates for checking NAO paleoreconstructions,
Geo-25
phys. Res. Lett, 28, 3895–3898, 2001. 1527, 1528, 1536
Sterl, A., van Oldenborgh, G., Hazeleger, W., and Burgers, G.: On the robustness of ENSO teleconnections, Clim. Dynam., 29, 469–485, 2007. 1529
Trenberth, K. and Paolino Jr., D.: The Northern Hemisphere sea-level pressure data set: trends, errors and discontinuities, Mon. Weather Rev., 108, 855–872, 1980. 1528, 1530, 1532, 1544,
30
1548
CPD
6, 1525–1550, 2010Climate signatures of grape harvest dates
Krieger et al.
Title Page
Abstract Introduction
Conclusions References
Tables Figures
◭ ◮
◭ ◮
Back Close
Full Screen / Esc
Printer-friendly Version Interactive Discussion
Discussion
P
a
per
|
Dis
cussion
P
a
per
|
Discussion
P
a
per
|
Discussio
n
P
a
per
|
Time [Year AD]
Days since Sept. 1st
1400 1500 1600 1700 1800 1900
−10
0
1
0
2
0
30
40
50
1920 1940 1960 1980 2000
Fig. 1.GHD series (Chuine et al., 2004) of the Burgundy region in France from 1370 to 2003 (in
CPD
6, 1525–1550, 2010Climate signatures of grape harvest dates
Krieger et al.
Title Page
Abstract Introduction
Conclusions References
Tables Figures
◭ ◮
◭ ◮
Back Close
Full Screen / Esc
Printer-friendly Version Interactive Discussion
Discussion
P
a
per
|
Dis
cussion
P
a
per
|
Discussion
P
a
per
|
Discussio
n
P
a
per
−20 0 20 40 60 30
40 50 60 70
●
DJF
−20 0 20 40 60 30
40 50 60 70
●
JJA
−20 0 20 40 60 30
40 50 60 70
●
SON
−20 0 20 40 60 30
40 50 60 70
●
MAM
−0.7 −0.65 −0.6 −0.55 −0.5 −0.45 −0.4 −0.35 −0.3 −0.25 −0.2 −0.15 −0.1 −0.05 0 0.05 0.1 0.15 0.2 0.25 0.3 0.35 0.4 0.45 0.5 0.55 0.6 0.65 0.7
a) b)
c) d)
Fig. 2. Correlation of the GHD series (Chuine et al., 2004) with the near surface temperature
CPD
6, 1525–1550, 2010Climate signatures of grape harvest dates
Krieger et al.
Title Page
Abstract Introduction
Conclusions References
Tables Figures
◭ ◮
◭ ◮
Back Close
Full Screen / Esc
Printer-friendly Version Interactive Discussion
Discussion
P
a
per
|
Dis
cussion
P
a
per
|
Discussion
P
a
per
|
Discussio
n
P
a
per
|
corr
1930 1940 1950 1960 1970
−0.85
−0.80
−0.75
−0.70
−0.65
−0.60
b)
−0.8 −0.7 −0.6 −0.5 −0.4 −0.3 −0.2 −0.1
0
0.1 0.2 0.3 0.4 0.5 0.6 0.7 0.8
−20 0 20 40 60
30 40 50 60 70
● a)
Fig. 3. Correlation of the GHD series (Chuine et al., 2004) with averaged April-to-August
CPD
6, 1525–1550, 2010Climate signatures of grape harvest dates
Krieger et al.
Title Page
Abstract Introduction
Conclusions References
Tables Figures
◭ ◮
◭ ◮
Back Close
Full Screen / Esc
Printer-friendly Version Interactive Discussion
Discussion
P
a
per
|
Dis
cussion
P
a
per
|
Discussion
P
a
per
|
Discussio
n
P
a
per
−20 0 20 40 60 30
40 50 60 70
●
a)
0 20 40
●
b)
−0.5 −0.4 −0.3 −0.2 −0.1 0 0.1 0.2 0.3 0.4 0.5
−20 0 20 40 60
●
c)
CPD
6, 1525–1550, 2010Climate signatures of grape harvest dates
Krieger et al.
Title Page
Abstract Introduction
Conclusions References
Tables Figures
◭ ◮
◭ ◮
Back Close
Full Screen / Esc
Printer-friendly Version Interactive Discussion
Discussion
P
a
per
|
Dis
cussion
P
a
per
|
Discussion
P
a
per
|
Discussio
n
P
a
per
|
−0.7 −0.6 −0.5 −0.4 −0.3 −0.2 −0.1 0 0.1 0.2 0.3 0.4 0.5 0.6 0.7
−60 −10 40
0 20 40 60 80
●
Fig. 5. Correlation of the GHD series (Chuine et al., 2004) with the sea surface temperature
CPD
6, 1525–1550, 2010Climate signatures of grape harvest dates
Krieger et al.
Title Page
Abstract Introduction
Conclusions References
Tables Figures
◭ ◮
◭ ◮
Back Close
Full Screen / Esc
Printer-friendly Version Interactive Discussion
Discussion
P
a
per
|
Dis
cussion
P
a
per
|
Discussion
P
a
per
|
Discussio
n
P
a
per
−20 0 20 40 60
30 40 50 60 70
●
b)
lag 2
−20 0 20 40 60
30 40 50 60 70
●
a)
lag 1
−0.55 −0.5 −0.45 −0.4 −0.35 −0.3 −0.25 −0.2 −0.15 −0.1 −0.05 0 0.05 0.1 0.15 0.2 0.25 0.3 0.35 0.4 0.45 0.5 0.55
Fig. 6. Correlation of the GHD series with the winter near surface temperature (Mitchell et al.,
CPD
6, 1525–1550, 2010Climate signatures of grape harvest dates
Krieger et al.
Title Page
Abstract Introduction
Conclusions References
Tables Figures
◭ ◮
◭ ◮
Back Close
Full Screen / Esc
Printer-friendly Version Interactive Discussion
Discussion
P
a
per
|
Dis
cussion
P
a
per
|
Discussion
P
a
per
|
Discussio
n
P
a
per
|
b) 1901-1947 c) 1948-2002
a) 1901-2002
−20 0 20 40 60
30 40 50 60 70
●
0 20 40
●
−0.55 −0.45 −0.35 −0.25 −0.15 −0.05 0.05 0.15 0.25 0.35 0.45 0.55
−20 0 20 40 60
●
Fig. 7. Correlation of the GHD series with the winter near surface temperature (Mitchell et al.,
CPD
6, 1525–1550, 2010Climate signatures of grape harvest dates
Krieger et al.
Title Page
Abstract Introduction
Conclusions References
Tables Figures
◭ ◮
◭ ◮
Back Close
Full Screen / Esc
Printer-friendly Version Interactive Discussion
Discussion
P
a
per
|
Dis
cussion
P
a
per
|
Discussion
P
a
per
|
Discussio
n
P
a
per
b) 1899-1947 a) 1899-2003
−60 −40 −20 0 20 40 60 20
30 40 50 60 70 80
●
−40 −20 0 20 40
●
−0.55 −0.45 −0.35 −0.25 −0.15 −0.05 0.05 0.15 0.25 0.35 0.45 0.55
−60 −40 −20 0 20 40 60
●
c) 1948-2003
Fig. 8.Correlation of the GHD series with the SLP (Trenberth and Paolino Jr., 1980) in winter
CPD
6, 1525–1550, 2010Climate signatures of grape harvest dates
Krieger et al.
Title Page
Abstract Introduction
Conclusions References
Tables Figures
◭ ◮
◭ ◮
Back Close
Full Screen / Esc
Printer-friendly Version Interactive Discussion
Discussion
P
a
per
|
Dis
cussion
P
a
per
|
Discussion
P
a
per
|
Discussio
n
P
a
per
|
a) 1901-2002 b) 1901-1947 c) 1948-2002
−60 −10 40
0 20 40 60 80
●
−60 −10 40
●
−0.55 −0.45 −0.35 −0.25 −0.15 −0.05 0.05 0.15 0.25 0.35 0.45 0.55
−60 −10 40
●
Fig. 9. Correlation of the GHD series with the SST from Kaplan et al. (1998) in winter (DJF).
Different time periods are correlated: (a)total period from 1901 to 2002,(b)1901 to 1947,(c)
CPD
6, 1525–1550, 2010Climate signatures of grape harvest dates
Krieger et al.
Title Page
Abstract Introduction
Conclusions References
Tables Figures
◭ ◮
◭ ◮
Back Close
Full Screen / Esc
Printer-friendly Version Interactive Discussion
Discussion
P
a
per
|
Dis
cussion
P
a
per
|
Discussion
P
a
per
|
Discussio
n
P
a
per
−20 0 20 40 60
30 40 50 60 70
●
a) −1−0.8
−0.6 −0.4 −0.2 0 0.2 0.4 0.6 0.8 1
−20 0 20 40 60
30 40 50 60 70
●
b)
Fig. 10. (a)Correlation of the GHD series with the winter near surface temperature (Mitchell