www.atmos-chem-phys.net/13/11887/2013/ doi:10.5194/acp-13-11887-2013
© Author(s) 2013. CC Attribution 3.0 License.
Atmospheric
Chemistry
and Physics
Analysis of particle size distribution changes between three
measurement sites in northern Scandinavia
R. Väänänen1, E.-M. Kyrö1, T. Nieminen1,2, N. Kivekäs3,4, H. Junninen1, A. Virkkula1,3, M. Dal Maso1,5,
H. Lihavainen3, Y. Viisanen3, B. Svenningsson4, T. Holst6, A. Arneth7, P. P. Aalto1, M. Kulmala1, and V.-M. Kerminen1 1Department of Physics, University of Helsinki, P.O. Box 64, 00014 University of Helsinki, Helsinki, Finland
2Helsinki Institute of Physics, P.O. Box 64, 00014 University of Helsinki, Helsinki, Finland 3Finnish Meteorological Institute, Climate Change Unit, 00101 Helsinki, Finland
4Lund University, Department of Physics, Lund, 22100 Lund, Sweden
5Tampere University of Technology, Dept. of Physics, P.O. Box 692, 33101 Tampere, Finland 6Department of Physical Geography and Ecosystems Science, Sölvegatan 12, 223 62 Lund, Sweden
7Karlsruher Institute of Technology, Instute of Meteorology and Climate Research/Atmospheric Environmental Research
(IMK-IFU), Kreuzeckbahnstr. 19, 82467 Garmisch-Partenkirchen, Germany Correspondence to:R. Väänänen ([email protected])
Received: 15 February 2013 – Published in Atmos. Chem. Phys. Discuss.: 9 April 2013 Revised: 18 October 2013 – Accepted: 30 October 2013 – Published: 9 December 2013
Abstract.We investigated atmospheric aerosol particle
dy-namics in a boreal forest zone in northern Scandinavia. We used aerosol number size distribution data measured with ei-ther a differential mobility particle sizer (DMPS) or scan-ning mobility particle sizer (SMPS) at three stations (Värriö, Pallas and Abisko), and combined these data with the HYS-PLIT (Hybrid Single Particle Lagrangian Integrated Trajec-tory) air mass trajectory analysis. We compared three ap-proaches: analysis of new particle formation events, investi-gation of aerosol particle number size distributions during the air mass transport from the ocean to individual stations with different overland transport times, and analysis of changes in aerosol particle number size distributions during the air mass transport from one measurement station to another. Aitken-mode particles were found to have apparent average growth rates of 0.6–0.7 nm h−1 when the air masses traveled over
land. Particle growth rates during the new particle forma-tion (NPF) events were 3–6 times higher than the apparent particle growth during the summer period. When comparing aerosol dynamics for different overland transport times be-tween the different stations, no major differences were found, except that in Abisko the NPF events were observed to take place in air masses with shorter overland times than at the other stations. We speculate that this is related to the mete-orological differences along the paths of air masses caused
by the land surface topology. When comparing air masses traveling in an east-to-west direction with those traveling in a west-to-east direction, clear differences in the aerosol dy-namics were seen. Our results suggest that the condensation growth has an important role in aerosol dynamics even when NPF is not evident.
1 Introduction
extended summer season (Kulmala et al., 2011; Tunved et al., 2006a). These particles have been estimated to cause a significant cooling effect via their interaction with clouds (Spracklen et al., 2008; Lihavainen et al., 2009), and to be part of a potentially important negative feedback loop in a warming climate (Tunved et al., 2008; Kulmala et al., 2004a; Paasonen et al., 2013).
The cooling potential of secondary particles produced by boreal forests is closely connected with aerosol dynamical processes taking place during atmospheric transport, espe-cially the particle growth, since secondary particles need to reach diameters larger than approximately 50–100 nm in or-der to participate in cloud droplet activation (Kerminen et al., 2005; Komppula et al., 2005; Sihto et al., 2011; Spracklen et al., 2011).
Long-term aerosol measurements conducted at various northern European sites have brought plenty of new in-sight into the formation and growth behavior of boreal for-est aerosols (Kulmala et al., 2004b; Vehkamäki et al., 2004; Dal Maso et al., 2007; Svenningsson et al., 2008; Asmi et al., 2011). The problem with these studies, however, is that particle growth rates are obtained only from a subset of days with the most prominent growth, which is very likely to bias the results. Another problem with measurements conducted at fixed sites is that they provide limited amount of infor-mation on the mutual interaction between various aerosol dynamical processes during atmospheric transport. Finally, such measurements do not reveal the spatial extent of sec-ondary aerosol formation, nor how long it takes to establish a balance between the aerosol formation and removal mech-anisms.
One approach to investigating aerosol dynamics during atmospheric transport is to look for and analyze air mass transport situations between two measurement stations. In the boreal forest environment, aerosol dynamics during at-mospheric transportation has been investigated in only a few studies. Komppula et al. (2006) concentrated on new particle formation (NPF) days in Finnish Lapland. They combined particle number size distribution measurements and simula-tions of aerosol dynamics, and showed that secondary parti-cle formation from biogenic precursors often dominated over the particle sinks when the air masses traveled a distance of over 200 km. Tunved et al. (2004) investigated the south-to-north air mass transport from Aspvreten in southern Sweden to Värriö in northern Finland, whereas Tunved et al. (2006b) analyzed the transport in the opposite direction, from Finnish Lapland to Hyytiälä, which is located about 300 km north of Helsinki. According to these studies, there was a signifi-cant difference between the dynamics of the measured par-ticle number size distributions in these two transport direc-tions; when air masses were moving to the south, the number concentration of particles in the Aitken mode was seen to increase while the mode peak diameter of the number size distribution remained unaltered, whereas for the opposite di-rection the mode peak in the number size distribution was
seen to move to larger sizes. Consequentially, although the total number concentration of particles decreased, the total mass concentration grew.
An alternative approach was introduced by Tunved et al. (2006a), who classified air mass trajectories arriving at Finnish rural stations based on their transport time over the boreal forest area. By combining a large set of such air masses based on trajectory analysis, Tunved et al. (2006a) were able to determine the “average” dynamical behavior of secondary particles formed in clean air transported from sea areas to forest areas. They found that the formation of new particles could be observed only after the air masses have traveled for a few hours above the boreal forest zone, and that the newly formed particles gradually grow in size dur-ing the atmospheric transport in response to biogenic emis-sions. The particle mass concentration was found to increase roughly linearly with the total estimated monoterpene emis-sion into the moving air parcel, whereas the total particle number concentration appeared to saturate between about 1000 and 2000 cm−3after a couple of days of air mass
trans-port.
Fig. 1.A map of northern Scandinavia. The measurement stations are located approximately in a line from west to east in the fol-lowing order: Abisko, Pallas, Värriö (A, P, and V in the map). Red lines show the sector from where the trajectories are accepted when studied the aerosol dynamics over the continent. Blue lines show the limits for the trajectory paths when studying aerosol dynamics between the measurement stations (Map: Natural Earth data).
2 Materials and methods
2.1 Measurements
2.1.1 Site descriptions
In this paper we compare aerosol number size distribution data from three rural stations. Two of them, Värriö and Pal-las, are continuous particle measurement stations and located in Finland. The data set is completed with campaign data from Abisko, which is located in Sweden, near the Norwe-gian border. The measurement sites are located roughly in a line from west to east at latitude 67–68◦N (see Fig. 1), and
the distances from Abisko to Pallas, from Pallas to Värriö, and from Abisko to Värriö are approximately 230, 230, and 440 km, respectively.
Abisko (68.35◦N, 19.05◦E, 360 m a.s.l.) (See
Svennings-son et al., 2008): the measurements were made at Stordalen Mire, 14 km east from the Abisko research station. The mire is situated between Lake Torneträsk and the Kiruna–Narvik road and railway lines in a wide, east–west oriented valley. The surrounding landscape is dominated by a mix of subarc-tic mire, birch forest, and mountain tundra. The main chain of mountains, with several peaks above 1500 m a.s.l., is lo-cated west from the site, and further west is the coast of the Atlantic Ocean (at a distance of ca. 100 km from the station). Pallas (67.97◦N, 24.12◦E, 565 m a.s.l.) (see Hatakka et
al., 2003): the Sammaltunturi measurements site at the Pallas–Sodankylä GAW (Global Atmospheric Watch) station is situated on the top of a fell about 300 m above the sur-rounding area. The sursur-roundings of the station are covered by
mixed boreal forest with Scots pine, spruce and birch trees, whereas the site itself is located about 100 m above the tim-ber line. There are no significant local or regional pollution sources close to the site.
Värriö (67.77◦N, 29.58◦E, 390 m a.s.l.) (see Hari et al.,
1994): the SMEAR (Station for Measuring Ecosystem-Atmospheric Relations) I station in Värriö is situated on a hilltop and it is surrounded by an approximately 60 yr old Scots pine forest. The Värriö research station is located about 1 km south from the measurement site. The altitude of the site, 390 m a.s.l., is slightly below the timber line of the area surrounding the station (400 m a.s.l). There are no local pol-lution sources close to the station. The distance to the near-est small road is 8 km and the distance to the nearnear-est major road is 100 km. The main anthropogenic pollution sources are the mining area in Kovdor, Russia and the nickel–copper smelters in Montchegorsk and Nikel, Russia, located 43 km, 150 km and 190 km, respectively, from the station.
2.1.2 Instrumentation
Data were collected between 1 August 2005 and 31 De-cember 2008. The number size distribution measurements were performed using either a differential mobility particle sizer (DMPS) or a scanning mobility particle sizer (SMPS). Both instruments are based on particle mobility techniques, in which particles are charged and then classified according to their electrical mobility. The number density of several particle diameter bins is counted.
In Abisko, an SMPS was used with a custom-built Hauke-type differential mobility analyzer (DMA) and TSI Model 3010 Condensation Particle Counter (CPC) (Svenningsson et al., 2008) was used. The size range of the instrument was 10–500 nm and the time resolution was 3–5 min. The inlet was placed 3.4 m/4.4 m above the surrounding mire.
In Pallas, the particle number size distribution data were measured using a DMPS with a Hauke-type DMA and TSI CPC Model 3010 (Komppula et al., 2003). The measurement range was 7–500 nm, and the size range was scanned once in every 5.5 min. The measurement inlet was 7 m above the ground (Komppula et al., 2005).
At the Värriö station, a DMPS with two Hauke-type DMAs and a TSI Model 3025 CPC (Ruuskanen et al., 2003; Dal Maso et al., 2005) was used. The size range of the mea-sured particles was 3–850 nm, and the time resolution was 10 min. The inlet was located at a height about 2 m above ground level.
2.2 Data analysis methods
2.2.1 New particle formation events
et al. (2005) (see also Kulmala et al., 2012). On event days, a new growing sub-25 nm particle mode that lasted for at least an hour was observed, and at undefined days either a non-growing new sub-25 nm mode or a non-growing > 25 nm mode was seen. If there was neither a growing nor a sub-25 nm mode, the day was classified as a non-event day. Further-more, the event days were divided into classes Ia and Ib ac-cording to whether it was possible to calculate growth and formation rates of freshly nucleated particles. For the class Ia events, we fitted a sum of up to three lognormal distribu-tions to the particle number size distribution data (Hussein et al., 2005) in order to get the geometric mean diameters of each mode. The growth and formation rates were calculated as in Dal Maso et al. (2005). The growth rate was obtained by fitting a line to the geometric mean diameters of the sub-25 nm modes during the formation burst, and the formation rate was calculated using the equation:
Jnuc = d
Nnuc
dt +Fcoag+Fgrowth, (1)
where dNnuc/dt is the rate of change of nucleated particle
concentration,Fcoag is the loss of particles by coagulation,
andFgrowth is the rate of particles growing out of the size
range. The lower detection limits of the DMPS or SMPS in-struments varied between 3 and 10 nm, which also affected the calculated rates.
2.2.2 Aerosol dynamics over the continent
Tunved et al. (2006a) showed that the total mass concen-tration of submicron aerosol particles in the background air over Scandinavia is linearly proportional to the time the cor-responding air mass had spent over the continent. In this work, we repeated this analysis and extended it to include the Abisko station. We calculated and intercompared the median particle number size distributions for all stations as a func-tion of the time the corresponding air masses had spent over the continent during the last 96 h. In the air mass analysis, we used the trajectories calculated using the HYSPLIT (Hy-brid Single Particle Lagrangian Integrated Trajectory) model (Draxler and Hess, 1998). We limited the area for the tories as shown in Fig. 1. The chosen area allowed the trajec-tories coming from the Atlantic Ocean and ending at Abisko to have a wide range of overland times. Trajectories needed to start over the Atlantic Ocean and spend 90 % of their over-land time inside the chosen sector. The starting altitude over the ocean was not limited, since air masses arriving above the boundary layer at marine environment were also assumed to also be clean enough. The total fractions of air mass trajecto-ries that passed our requirements were 81 % for Abisko, 75 % for Pallas and 58 % for Värriö. We calculated the results for the summer and winter periods separately.
We calculated the apparent growth rate and the increase rates of the particle number and mass concentration and con-densation sink for all the three stations considered here. At
each station, we calculated the hourly averages of particle number size distributions, and assigned those to the corre-sponding overland times calculated from the trajectories. For each of these particle number size distributions we quanti-fied the particle diameter that had the maximum concentra-tion (referred to as peak diameter). Peak diameters increased as a function of the overland time. To quantify this apparent growth, we first took all the peak diameters for each fixed overland hour bin, and calculated their geometric count me-dian diameters (CMD). We used these CMD values for fur-ther analysis instead of the mean values, since for a fixed overland time, the peak diameters were log-normally dis-tributed. Finally, we determined the apparent growth rate by fitting a line to these CMD values as a function of overland time. For statistical reasons, only those overland hour bins with more than 10 number size distributions were taken into account when fitting the lines.
Similar steps to those described above were carried out to calculate the mass accumulation rate and the condensa-tion sink (Dal Maso et al., 2002) increase rate as a funccondensa-tion of the overland time. When calculating the apparent growth, our initial values were the peak diameters, but now we used the mass concentrations or condensation sink values calcu-lated from the particle number size distributions. The count mean diameter values of both the mass concentrations and condensation sink values were calculated for each overland hour bin, and a line was fitted along the results. The average density of the aerosol particles was assumed to be 1.5 g cm−3
(as in Tunved et al., 2006a). We concentrated our study on the largest common range of particle diameters that was mea-sured at each of the stations, namely sizes between 10 and 450 nm, to make the results intercomparable.
2.2.3 Aerosol transport between stations
Particle number size distribution data from several measure-ment stations combined with the calculated air mass trajec-tory information allowed us to regionally study the dynami-cal changes of aerosol particle populations. For this, we fo-cused on the air masses that had traveled over two stations, and then compared the aerosol properties between the dif-ferent station pairs. Each station pair had an upwind and a downwind station.
The aerosol dynamical processes are dependent on the shapes of the particle number size distributions, and thus when studying the evolution of aerosol populations, the ini-tial states need to be comparable. After we had selected the trajectories that passed a pair of measurement stations, we clustered the particle number size distributions measured at the upwind station to obtain a set of different initial states.
members are minimized. In other words, our aim was try to reduce the complexity of the data sets by finding data sub-sets that were internally similar to each other – in our case, groups of similar particle number size distributions. Mea-sured particle number size distributions were mapped into the size bins dN/dlogDp, where dN is the particle number
concentration in each size bin and dlogDp is logarithm of
the width of the size bin. Next we calculated the squared Eu-clidian measure between two number size distributions. The
kmeans method with squared Euclidian measure as a mea-sure has been shown to work best when comparing several clustering algorithms for particle number size distributions (Beddows et al., 2009). However, our method differed from the normalization by Beddows et al. (2009), who normalized the vector lengths. We did not do this, since we were also interested in the aerosol loading, not only the shapes of the particle number size distributions.
One should note that the basis vectors used in our cluster-ing algorithm were chosen in a practical rather than a mathe-matical way; consequentially, the basis vectors are not a nor-malized Euclidean basis set even though we used Euclidean measure. Our aim was to divide the particle number size dis-tributions into separate groups, and the results showed that our method is suited for that.
The selection of the clusters was a two-phase process. First we determined the best total number of clusters. We per-formed the clustering algorithm with different fixed numbers of clusters, and chose the best number based on the mean of the so-called silhouette values (MathWorks Inc., 2011). The silhouette values show how tightly the data points are associ-ated with their assigned clusters and how dissimilar they are from other clusters. The number of clusters that produced the highest silhouette value was chosen. The second phase was to ignore those clusters that had only a low number of size distributions.
Typically, the first phase resulted in 3–6 clusters per site. Of these, clusters with fewer than 30 number size distribu-tions were disregarded (because of the low generalization) in the second phase. Each of the studied clusters was linked to a set of particle number size distributions at the downwind station via the trajectories. The statistical number size distri-butions (mean, and 16th and 83th percentiles) for each clus-ter were calculated and plotted at both the upwind and the downwind station. Furthermore, we fitted a sum of lognor-mal distributions to the mean number size distributions and analyzed the dynamics of the particle modes.
The trajectory selection was carried out as well. We chose the trajectories that passed several measurement sites in the following way. First, the 96 h HYSPLIT backward trajecto-ries that arrived at each station were calculated once per hour, each with a backward time resolution of one hour. We in-creased the resolution of each trajectory to ten minutes by interpolating the paths. We defined an arriving trajectory as having passed another site if it had gone through a circle with a radius of 25 km centered at the other site. The length of the
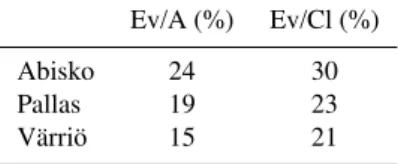
Table 1.Fraction of NPF event days compared to all analyzed days with data (Ev/A) or to days which are classified either to event or non-event days (Ev/Cl). Data from Abisko was from campaigns (most data from the winters 2005–2006 and 2006–2007 are miss-ing), and it thus cannot be compared to the values for Pallas and Värriö.
Ev/A (%) Ev/Cl (%)
Abisko 24 30
Pallas 19 23
Värriö 15 21
radius was based on the uncertainty of the trajectories, which can be of order of 10–30 % of the distance the proceeding trajectory (Stohl, 1998). For example, this means that when the distance from Pallas to Värriö or from Abisko to Pallas is about 200 km, the location error can be tens of kilome-ters. We decreased the effects of different land use by re-stricting the trajectory paths to be between the latitudes of 67.1–69.0◦N. The area inside this corridor is mostly very
sparsely populated. The centers of population include the towns Sodankylä and Kiruna. We did a sensitivity check on the Kiruna mining town by estimating whether it had any influence on measured aerosol populations when air masses were traveling between Abisko and Pallas.
3 Results and discussion
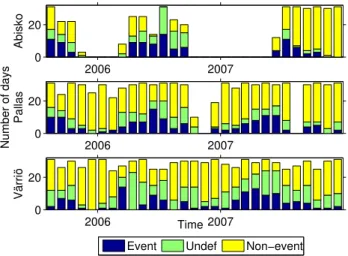
Our data set covered the measured particle number size dis-tributions at the three stations between August 2005 and De-cember 2008. The gaps in the data set limit the intercompari-son of the NPF analysis (Fig. 2). The most complete data set originated from Värriö, and the largest number of gaps was in the Abisko data set (which was derived during a number of shorter measurement campaigns). The fractions of days without data during the whole time period were 52 %, 13 %, and 6 % for Abisko, Pallas and Värriö, respectively. Simul-taneous data from all the three measurement sites were more frequent for summer and autumn compared to the other two seasons. Since there were no data from most of the winter days at Abisko, the fraction of the event days compared to all analyzed (Ev/A) or classified (either event or non-event) (Ev/Cl) days in Abisko cannot be directly compared to those at Pallas or Värriö. When comparing Pallas and Värriö, we found that there was a slightly higher fraction of event days at Pallas (Fig. 3 and Table 1).
Fig. 2.Colored areas show the time intervals when particle number size distribution data is available from corresponding stations.
al. (2004) found lower fractions (monthly Ev/A varied be-tween 3 and more than 20 %), but applied a slightly ent classification from ours, which might cause some differ-ences. In an 11 yr study of Pallas, the value of Ev/A varied between 6 and 27 % during different months (Asmi et al., 2011).
The particle formation rates were calculated at 3.7, and 10 nm for Värriö, Pallas, and Abisko, respectively; these are the lowest measurable particle diameters at these three sites. By doing this calculation, our results can be com-pared with previous studies conducted at the same sites (Ta-ble 2). The mean formation rates were almost equal at all the sites (0.1 cm−3s−1)and confirm previously published
re-sults (Vehkamäki et al., 2004; Dal Maso et al., 2007; Asmi et al., 2011). The mean growth rate of particles during the NPF events in Abisko exceeded the growth rates in Pallas and Värriö.
3.1 Evolution of the particle properties over the continent
It has been shown for both Pallas and Värriö that, on average, the particle size and the accumulated particle mass concen-tration grow as a function of the time that the corresponding air mass has spent over the land (Asmi et al., 2011; Tunved et al., 2006b). We extended this analysis to include Abisko and the winter period.
3.1.1 Summer period
During the summer, air masses originating from the sea and arriving at the continental areas were assumed to be relatively free of anthropogenic influence. Observed particle number size distributions (Fig. 4) and low total particle number con-centrations (Fig. 5c) associated with short overland transport
2006 2007
0 20
Abisko
2006 2007
0 20
Number of days
Pallas
2006 2007
0 20
Time
Värriö
Event Undef Non−event
Fig. 3.Number of NPF event days, non-NPF event days, and
unde-fined days in all measurement sites.
times support this assumption. With short overland times, the particle number size distribution in all stations had a bi-modal structure with mode peaks at 30–40 nm and 130– 170 nm in diameter. This finding fits well with measured ma-rine particle number size distributions (Covert et al., 1996; Koponen et al., 2002; Heintzenberg et al., 2004; O’Dowd et al., 2004).
When the air mass traveled over the land, the formation and growth of aerosol particles could be observed as in-creases in particle number concentrations and mean diam-eters of the Aitken mode. The particle number concentra-tions increased at rates of about 0.01 cm−3s−1until the
over-land times of around 30–40 h and thereafter at rates between about 0.001 and 0.002 cm−3s−1 (Fig. 5c). Eventually, the
total particle number concentration saturated towards levels of 900–1100 cm−3. This feature indicates that by overland
transport times of about 30–40 h, the formation of new parti-cles as the main process had been overtaken either by vapors condensing or by small clusters coagulating onto the larger particles. The slow increase in particle number concentra-tions – even at long overland transport times – might also be connected to primary particle emissions.
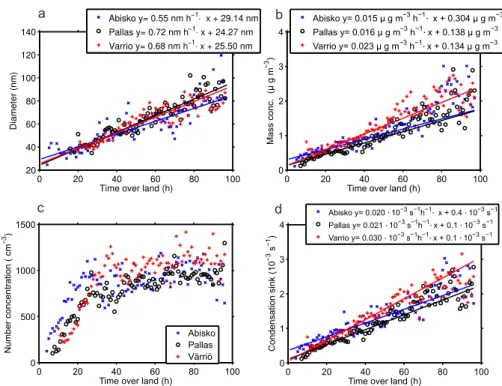
In contrast to the particle number concentration, the parti-cle mode diameter, accumulated mass concentration and con-densation sink all increased during the entire 96 h time period (Fig. 5a, b, d). The condensation sink values corresponding to the 30–40 h overland time were between 0.8×10⁻³s−1
and 1.2×10⁻³s−1.
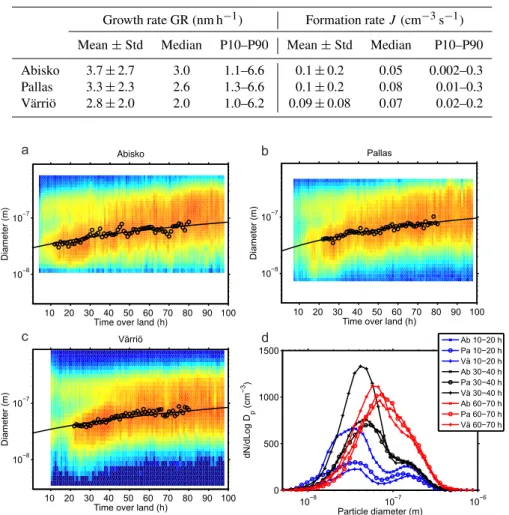
Table 2.Statistics of the properties of NPF events. Calculated means, medians and standard deviations, as well as 10th and 90th percentiles (P10–P90). Here, too, the shorter measurement periods in Abisko prevent direct comparison (see Table 1). Due to different cut-off sizes of the instruments, the formation rates areJ10,J7andJ3, for Abisko, Pallas, and Värriö, respectively.
Growth rate GR (nm h−1) Formation rateJ(cm−3s−1)
Mean±Std Median P10–P90 Mean±Std Median P10–P90
Abisko 3.7±2.7 3.0 1.1–6.6 0.1±0.2 0.05 0.002–0.3
Pallas 3.3±2.3 2.6 1.3–6.6 0.1±0.2 0.08 0.01–0.3
Värriö 2.8±2.0 2.0 1.0–6.2 0.09±0.08 0.07 0.02–0.2
10 20 30 40 50 60 70 80 90 100 10−8
10−7
Time over land (h)
Diameter (m)
Pallas
10 20 30 40 50 60 70 80 90 100 10−8
10−7
Time over land (h)
Diameter (m)
Värriö
10−8 10−7 10−6
0 500 1000 1500
Particle diameter (m)
dN/dLog D
p
(cm
−3)
Ab 10−20 h Pa 10−20 h Vä 10−20 h Ab 30−40 h Pa 30−40 h Vä 30−40 h Ab 60−70 h Pa 60−70 h Vä 60−70 h
a
c d
b
Fig. 4. (a–c)Median number size distributions as a function of time the corresponding air mass has spent over land during the last 96 h. Only
summer period (1.4–30.9) covered.(d)Mean number size distributions for certain time periods for all stations.
average particle number size distributions for 10–20 h over-land times (blue lines in Fig. 4d), we can see that the shapes of the number size distributions were quite similar for all of the stations, with Abisko having the highest number con-centration of Aitken-mode particles. For overland times of 30–40 h (black lines in Fig. 4d), Abisko and Pallas continued to have similar number size distributions, and Värriö clearly had the highest Aitken-mode particle number concentrations. For overland times of 60–70 h, the number size distributions (red lines in Fig. 4d) at all stations were relatively similar and the original bi-modality had in practice disappeared.
In order to compare the growth of the particles, we cal-culated the apparent increase rates with error limits for the mode peak diameter, mass accumulation and condensation sink using the method explained in Sect. 2.2.2 (Table 3). One should note that the error limits were based on a mathemat-ical line fitting, which omits the physmathemat-ical uncertainty in the measurements, the inaccuracy of the method itself and the
pre-assumptions made for the data (e.g. which time inter-val was used when calculating the rates), which are compli-cated to access. Thus the reported errors should be consid-ered lower-limit estimates for the errors.
The apparent particle growth rates when air masses were passing over the land were relatively similar for all the sta-tions, with average values between 0.55 and 0.72 nm h−1
0 20 40 60 80 100 0
1 2 3 4
Time over land (h)
Mass conc. (µ g m
−3)
Abisko y= 0.015 µ g m−3 h−1⋅ x + 0.304 µ g m−3
Pallas y= 0.016 µ g m−3 h−1⋅ x + 0.138 µ g m−3 Varrio y= 0.023 µ g m−3 h−1⋅ x + 0.134 µ g m−3 a
c
b
0 20 40 60 80 100 0
500 1000 1500
Time over land (h)
Number concentration ( cm
−3)
Abisko Pallas Värriö
0 20 40 60 80 100 0
1 2 3 4
Time over land (h)
Condensation sink (10
−3 s −1)
Abisko y= 0.020 ⋅ 10−3 s−1h−1⋅ x + 0.4 ⋅ 10−3 s−1 Pallas y= 0.021 ⋅ 10−3 s−1h−1⋅ x + 0.1 ⋅ 10−3 s−1 Varrio y= 0.030 ⋅ 10−3 s−1h−1⋅ x + 0.1 ⋅ 10−3 s−1
d
Fig. 5.Particle mode diameter(a), integrated mass concentration(b), number concentration(c), and condensation sink(d)as a function of time the corresponding air mass has spent over land.
Table 3.Increase rates of mode peak diameter, accumulated mass concentration, and condensation sink when air masses travel over land.
Summer period (1.4–30.9) covered. See Fig. 5.
Abisko Pallas Värriö
Apparent particle growth rate (nm h−1) 0.55±0.04 0.72±0.04 0.68±0.05
Over-land-times used (h) 12–80 22–80 22–80
Accumulated mass conc. increase (µgm−3h−1) 0.015±0.002 0.016±0.001 0.023±0.001
Over-land-times used (h) 5–50 10–50 12–50
Apparent growth of condensation sink (s−1h−1) 0.022±0.001 0.026±0.001 0.029±0.001
Over-land-times used (h) 5–80 10–80 10–80
averaging the NPF events over all days, we calculated a sepa-rate apparent growth sepa-rate using data from the non-event days only. In the result, no significant difference from the all-data results was seen.
In Tunved et al. (2006a), the average integrated observed particle mass for Pallas and Värriö was calculated to in-crease by 0.014 µgm−3h−1with the time the corresponding
air mass had spent over the continent. In our analysis we ob-tained similar values despite the different data sets used. The integrated particle mass concentration increase rates in our study were between 0.015 and 0.023 µg m−3h−1for the
sta-tions. The overland times used here to calculate the slopes were chosen to be below 50 h because the residuals of the lin-ear fit were smaller for such a time window than if the upper limit had been chosen to be 80 h. In the latter case, slightly larger (between 0.020 and 0.027 µg m−3h−1) slopes were
obtained, but the fitting was worse, especially for Abisko.
These features may be caused by the lower number of data points for the larger overland transport times, yet we cannot exclude the influences of real aerosol dynamic processes, ei-ther. The condensation sink was found to increase linearly with increasing overland transport times at all the stations. The corresponding increase rates were between 0.020 and 0.030 s−1h−1. Värriö had the highest value in line with the
other variables: Värriö had also the highest apparent growth rate, mass accumulation rate and particle number concentra-tion after its saturaconcentra-tion.
0 0.5
1 Värriö
0 0.5
1 Pallas
Fraction of trajectories ending to the site 00 20 40 60 80 100 0.5
1 Abisko
Time over land (h)
Event Non−event Undef
a b
Fig. 6. (a)Distribution of the times the trajectories spent over land.(b)Fractions of the trajectories that ended at each site during event, non-event, or undefined days.
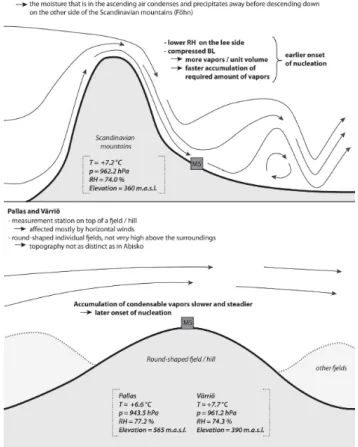
The histogram of the times that the trajectories had spent over land peaked at 8 h for Abisko and at around 20 h for Pallas and Värriö (Fig. 6a), reflecting the relative distances of these stations from the ocean and the prevailing westerly winds. For Pallas and Värriö, the trajectories corresponding to NPF event days peaked at around 20–25 h (slightly ear-lier in Pallas than in Värriö) of the overland transport time. (Fig. 6b). This supports the principal idea that particle nu-cleation occurs easier in fresh air coming from the ocean, while the transport time need to be sufficient for enough condensable gases to be formed. However, in Abisko a fre-quent occurrence of NPF was already observed soon after the air masses had arrived at over the land. The reason for the observed differences between Abisko compared with Pal-las and Värriö cannot be explained by the differences in the values of the condensation sink (Fig. 5d). Moreover, for the extended summer season (April to September during 2005– 2007), there was no significant difference between the sta-tions’ climatology (Fig. 7). Therefore, the reason for the ear-lier onset of nucleation in Abisko must be due to some other factors. Compared with Pallas and Värriö, Abisko has very distinct geographical features as it is located on the lee side of the Scandinavian Mountains and thus affected by air de-scending from over the mountain range, whereas Pallas and Värriö are both located on top of a hill. The Scandinavian Mountains very often generate (Jiang et al., 2004; Schroeder et al., 2009) standing atmospheric gravity waves (Nappo, 2002; Scorer, 1949) on their lee side. We speculate that on average, the air measured in Abisko is constrained into a shallower boundary layer that the air measured in either Pal-las or Värriö, allowing more efficient accumulation of con-densable vapors originating from biogenic emissions over Abisko. This would be the only major difference between the stations we could find that might be able to increase the prob-ability of nucleation already at an earlier stage (Fig. 7). The faster nucleation onset in Abisko was also seen from the me-dian particle number size distributions (Fig. 4a–c): the time when particle number concentrations in the Aitken mode
in-creased significantly was around 7 h for Abisko, 15 h for Pal-las and 20 h for Värriö.
One should note that even though the average climate was fairly similar, the average meteorological conditions related to the short overland times were different between the sta-tions: for the same overland times, the longer distance from the ocean to Pallas or Värriö than to Abisko indicates higher wind speeds, which are likely connected to a lower pressure and thus different rain and radiation profiles. This in turn af-fects the event-day probability.
3.1.2 Winter period
Over northern Scandinavia, natural sources of primary par-ticles and particle precursor vapors are expected to be much lower during the winter period (from the beginning of Octo-ber to the end of March) compared with the summer period. By contrast, due to heating and combustion, primary emis-sions of man-made particles should be at their highest during the winter period (Karvosenoja et al., 2010; Lamberg et al., 2011).
We calculated the median particle number size distribu-tions as a function of overland time for the winter period. Due to the low apparent growth of the Aitken-mode parti-cles, the particle number size distribution remained bimodal even for long overland transport times (Fig. 8a). We also ob-served that when particles traveled over the continent, the mean modal diameters, particle number and mass concentra-tions all increased with increasing overland transport times (Fig. 8b–d). All these increase rates were, however, lower than during the summer time. The apparent growth of sub-80 nm particles was visible during the first 40 h of the over-land transport time, after which the modal mean diameters saturated to values of around 50–70 nm.
Fig. 7.General topographical and meteorological differences be-tween the Abisko station and the Pallas and Värriö stations, and their effect on the onset of nucleation. Mean temperature, pressure and relative humidity are shown for the years 2005–2007 over the period 1.4.–30.9 for each station.
average increase rates of particle number concentrations as function of the overland transport time were of the order of 0.003 cm−3s−1 for Abisko and 0.001 cm−3s−1 for both
Pallas and Värriö. Interestingly, these rates are of similar magnitude as those observed during the summer period at longer (> 30 h) overland transport times.
3.2 Aerosol dynamics between measurement stations
Three measurement sites located in a row (with a total dis-tance of 440 km) offered the possibility of examining the dy-namical properties of aerosols when they are transported by air masses between the sites. In order to do such an investiga-tion, particle number size distributions at the upwind station need to be known. To standardize the starting situations, we first clustered the number size distributions at the upwind sta-tion separately for both summer and winter seasons, and then the changes of each of these clusters were analyzed.
The changes of the particle number size distributions of each cluster at the upwind and downwind stations show the
average evolution during the transport (Figs. 9 and 10). We fitted a sum of lognormal distributions to the mean number size distributions of both stations in each pair to identify the changes in aerosol modes. The resulting peak diameters of these modes and their changes, as well as the mode concen-trations and their changes, are listed for summer and winter periods in Tables 4 and 5, respectively. Since our aim was to use clusters as representative for general patterns rather than just single cases, all clusters with less than 30 number size distribution elements at both ends were discarded. Next we will analyze both air mass transport directions and all the sta-tion pairs along these transport routes. For each site pair, and for both seasons separately, we call the clusters with the high-est number of distribution pairs “the most frequent cluster”, and the cluster with the next highest number of the distribu-tion pairs as “the second-most frequent cluster”.
3.2.1 Abisko-Pallas
When clustering the particle number size distributions at Abisko, as related to air masses in the direction towards Pal-las, the clustering with the highest silhouette value was ob-tained with five clusters for the summer period and with three clusters for the winter period. During the summer, two of these clusters had more than 30 elements, whereas during winter only one cluster had enough elements.
In both seasons, the most frequent cluster at Abisko had a bimodal structure with almost the same mode peak diame-ters, but in summer the particle number concentration of the Aitken mode was almost twice as high as it was during win-ter. In both seasons, the Aitken-mode particle number con-centrations of these most frequent clusters increased during the air mass transport, whereas the accumulation-mode num-ber concentration remained roughly unaltered. For the most frequent cluster of the summer period, the peak diameter of the Aitken mode shifted on average from 29 nm to 48 nm in 15 h, corresponding to the growth rate of 1.3 nm h−1,
whereas during the winter period, practically no shift was seen. The absence of changes during winter compared to the pronounced shift in the particle number size distribution dur-ing the growdur-ing season is most likely connected to the con-densation of organic compounds formed from soil and vege-tation emissions. The concentrations of the combined nucle-ation and Aitken-mode particles of the most frequent clus-ter increased with a rate of 0.01 cm−3s−1during the
sum-mer, and the corresponding increase during the winter was around one third of this value. In both seasons, the accumu-lation mode of the most frequent cluster had a larger mode peak diameter, but smaller concentrations in Pallas than in Abisko.
0 20 40 60 80 100 0
1 2 3 4
Time over land (h)
Mass conc. (µ g m
−3)
Abisko y= 0.012 µ g m−3 h−1⋅ x + 0.14 µ g m−3 Pallas y= 0.007 µ g m−3 h−1⋅ x + 0.08 µ g m−3
Varrio y= 0.008 µ g m−3 h−1⋅ x + 0.24 µ g m−3
0 20 40 60 80 100
0 100 200 300 400 500 600 700
Time over land (h)
Concentration ( cm
−3)
Abisko Pallas Värriö
0 20 40 60 80 100
0 20 40 60 80 100 120 140 160 180
Time over land (h)
Diameter (nm)
Abisko Pallas Värriö
a
c
b
d
Fig. 8. (a)Mean particle number size distributions for certain overland time periods for all stations. Particle mode diameter(b), integrated
mass concentration(c), number concentration(d)as a function of time the corresponding air mass has spent over land. In all subplots, only
the winter period (1.10–31.3) is covered.
the particle concentration of that mode had increased slightly with a rate of 0.004 cm−3s−1.
3.2.2 Pallas-Värriö
Particle number size distributions observed at Pallas, when considering trajectories in the direction to Värriö, clus-tered best to four sets in the summer and to three sets in the winter season, of which two in both cases had enough members for a further analysis. For the most fre-quent cluster during the summer, the Aitken mode shifted towards larger particles (0.6 nm h−1) and its concentration
increased (0.02 cm−3s−1). In winter, the mode peak
diam-eter of Aitken-mode particles of the most frequent cluster shifted with a high rate of 2.1 nm h−1, but the concentration
increase was low with a rate of 0.004 cm−3s−1. In summer,
the accumulation mode of this cluster shifted rapidly towards larger particles (3.3 nm h−1)and its concentration increased
slightly (0.004 cm−3s−1). During wintertime, the
accumu-lation mode was already very weak in Pallas and did not change much. In summer, the general modal dynamics was quite similar to that associated with the Abisko–Pallas trans-port route.
In both seasons, the accumulation mode dominated the second-most frequent cluster at Pallas and the Aitken mode was also present. During the summer period, the number concentration of the accumulation mode of the second-most
frequent cluster decreased and that of the Aitken mode in-creased, but the peak diameters of both modes remained un-changed. During the winter period, the peak diameters of both modes of the second-most frequent cluster increased rapidly (1.7 nm h−1for the Aitken mode and 2.7 nm h−1for
the accumulation mode), and the concentration of accumula-tion mode also increased slightly.
3.2.3 Pallas-Abisko
The Pallas–Abisko air transport route had the least number of paired number size distributions and the only one cluster for summer period had enough members to fulfill the selection criteria of over 30 data pairs. As a result, the conclusions from this analysis are not as firm as those from the analysis of the other transport routes.
The number size distribution at Pallas for the one clus-ter had a low total concentration and trimodal structure with mode peak diameters of 22 nm, 63 nm, and 169 nm. On average, these peak diameters remained relatively un-changed when the air masses traveled to Abisko, and the to-tal concentrations on all size ranges increased. For all the modes, particle number concentrations increased at a rate of 0.002 cm−3s−1. No single process could explain this kind of
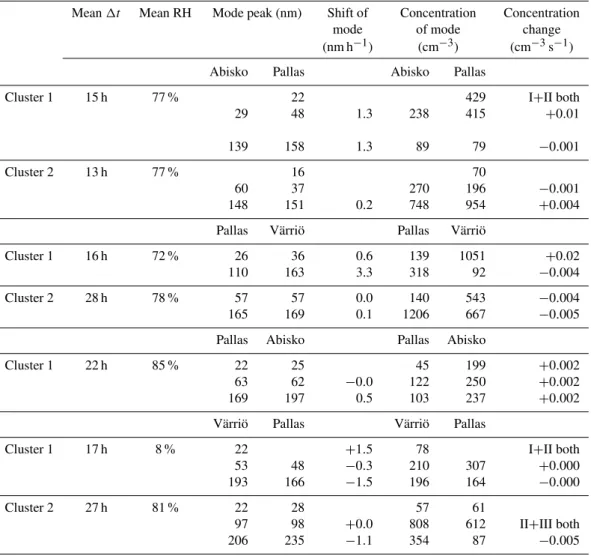
Table 4.Dynamics of particle number size distributions when air masses travel from one site to another, summer season. The initial number size distributions are clustered and a log-normal fitting in the both ends of the paths is used to find the mode peak diameters and mode concentrations. In this table, the changes in mode peak diameters and mode concentrations are shown.
Mean1t Mean RH Mode peak (nm) Shift of Concentration Concentration
mode of mode change
(nm h−1) (cm−3) (cm−3s−1)
Abisko Pallas Abisko Pallas
Cluster 1 15 h 77 % 22 429 I+II both
29 48 1.3 238 415 +0.01
139 158 1.3 89 79 −0.001
Cluster 2 13 h 77 % 16 70
60 37 270 196 −0.001
148 151 0.2 748 954 +0.004
Pallas Värriö Pallas Värriö
Cluster 1 16 h 72 % 26 36 0.6 139 1051 +0.02
110 163 3.3 318 92 −0.004
Cluster 2 28 h 78 % 57 57 0.0 140 543 −0.004
165 169 0.1 1206 667 −0.005
Pallas Abisko Pallas Abisko
Cluster 1 22 h 85 % 22 25 45 199 +0.002
63 62 −0.0 122 250 +0.002
169 197 0.5 103 237 +0.002
Värriö Pallas Värriö Pallas
Cluster 1 17 h 8 % 22 +1.5 78 I+II both
53 48 −0.3 210 307 +0.000
193 166 −1.5 196 164 −0.000
Cluster 2 27 h 81 % 22 28 57 61
97 98 +0.0 808 612 II+III both
206 235 −1.1 354 87 −0.005
3.2.4 Värriö-Pallas
The Värriö–Pallas path included the highest diversity of all observed number size distributions. The clustering procedure resulted in six sets of distributions for the summer and four sets for the winter. In both seasons, the two largest clusters had over 30 elements and were chosen to be studied in more detail.
During both summer and winter, the most frequent cluster had a bimodal structure and no significant change in the to-tal particle number concentration was seen during the trans-port. During the summer, this insignificant total concentra-tion change was achieved by a small increase of Aitken-mode particle concentration while the accumulation-Aitken-mode particles decreased. The total particle number concentrations were slightly higher during summer than in winter.
For the second-most frequent cluster, the accumulation mode was the dominant one at Pallas in both summer and
winter. During the atmospheric transport, the total particle number concentration decreased with clearly different pat-terns between the two seasons. During the winter, very sim-ilar particle number size distribution arrived at Pallas as had been left from Värriö, indicating the sinks and sources of aerosol particles were in balance. In summer the concentra-tion in the two modes in the accumulaconcentra-tion region decreased with a total rate of 0.005 cm−3s−1, whereas during winter
the accumulation mode remained unaltered and the Aitken mode decreased and shifted to larger sizes with rates of 0.005 cm−3s−1and 0.4 nm h−1.
3.2.5 General remarks
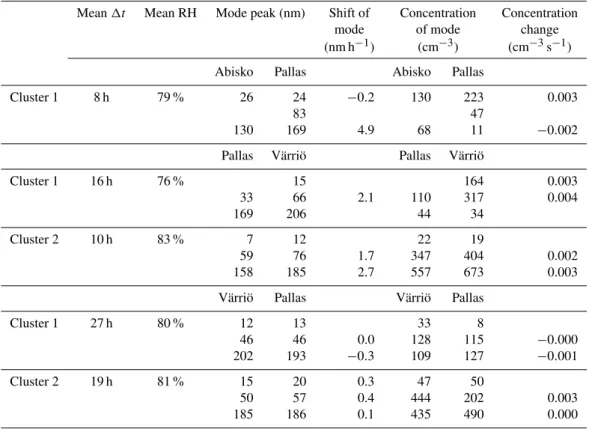
Table 5.Dynamics of particle number size distributions when air masses transport from one site to another. Similar to Table 4, but now covering the winter season.
Mean1t Mean RH Mode peak (nm) Shift of Concentration Concentration
mode of mode change
(nm h−1) (cm−3) (cm−3s−1)
Abisko Pallas Abisko Pallas
Cluster 1 8 h 79 % 26 24 −0.2 130 223 0.003
83 47
130 169 4.9 68 11 −0.002
Pallas Värriö Pallas Värriö
Cluster 1 16 h 76 % 15 164 0.003
33 66 2.1 110 317 0.004
169 206 44 34
Cluster 2 10 h 83 % 7 12 22 19
59 76 1.7 347 404 0.002
158 185 2.7 557 673 0.003
Värriö Pallas Värriö Pallas
Cluster 1 27 h 80 % 12 13 33 8
46 46 0.0 128 115 −0.000
202 193 −0.3 109 127 −0.001
Cluster 2 19 h 81 % 15 20 0.3 47 50
50 57 0.4 444 202 0.003
185 186 0.1 435 490 0.000
between the stations. During the summer period, the mode peak diameter increased at rates between 0.6 and 1.3 nm h−1
and the concentration of the mode increased at rates of 0.01– 0.02 cm−3s−1. When looking at the corresponding
summer-time clusters for the opposite transport direction, the con-centration changes of the Aitken mode were not as intense (rates between−0.001 and 0.002 cm−3s−1)and the shifts in
the peak diameter of the Aitken mode were small (between
−0.3 nm h−1and 0.2 nm h−1). During the winter the general
pattern was similar, even though the concentration increases were several times weaker compared to the summer.
The differences in the aerosol population and dynamics along the wind direction can be related to two factors. First, the western side of the measurement sites is limited by the Atlantic Ocean, whereas in the east it is limited to north-western Russia and hence the continent. It has been shown that clean air from the ocean favors new particle formation and growth (Dal Maso et al., 2007; Sogacheva et al., 2005). During the summer, the air masses connected to the most fre-quent clusters were fresher for the west-to-east transport than for the opposite direction. When considering the air masses traveling from Abisko to Pallas, the average overland time at Abisko was 18 h; for the air masses traveling from Pal-las to Värriö, the average time was 37 h; whereas for the air masses traveling from Pallas to Abisko, the corresponding time at Pallas was 46 h and at Värriö (for air masses
trav-eling from Värriö to Pallas) it was 49 h. This agreed with the initial Aitken-mode peak diameters, which were 29 and 26 nm at Abisko and Värriö, respectively, whereas for the op-posite transport direction they were 63 and 53 nm at Värriö and Pallas, respectively. When the air mass was coming from the continent, it had a larger condensation sink which likely hindered the formation of new particles. Secondly, the wind direction was associated with different meteorological condi-tions. We calculated the relative humidity along the trajecto-ries between the measurement station pairs. For the summer time, the median values of relative humidity for each clus-ter associated with the west-to-east paths were between 72 and 78 %, whereas for the opposite paths they were between 81 and 85 %. The higher relative humidity values have been connected to lower NPF probabilities e.g., at Pallas (Asmi et al., 2011).
During both seasons and for both wind directions, the second-most frequent clusters included a strong accumula-tion mode at the upwind staaccumula-tion, and the same mode also dominated in the downwind station. This was presumably be-cause accumulation-mode particles have the longest lifetime in atmosphere.
The observed shifts in the diameter of the Aitken-mode peak were around 1 nm h−1during the summer period. This
Fig. 9.The dynamics of the particle number size distributions when air masses were moving from one measurement site to another. Summer season 1.4.–30.9 covered. The initial size distributions at the upwind station were clustered to obtain as similar initial states as possible. Each subplot represents one cluster. The first member of the site pair is the upwind site, and the second member is the downwind site. For each cluster, the mean number size distribution at the upwind station is plotted with solid red line, and the shad-owed red area shows the 16–83th percentiles. Similarly, the blue solid line is the mean of the corresponding size distributions at the downwind station, and shaded blue area shows the above-mentioned percentiles. The number n shows the amount of size distribution pairs in each cluster.
land. Again, this was about one-third of the average growth rate observed during NPF events. The increase rates of the Aitken-mode particles were up to 0.02 cm−3s−1. When
com-paring this with the average formation rates during NPF events, we saw that the latter were five times larger. These differences reflect the choice of the data behind the values and stress that the growth and formation rates observed only during the most obvious nucleation days can give misleading numbers of the changes of the total aerosol population.
Fig. 10.The dynamics of the number particle size distributions
when air masses were moving from one measurement site to an-other. Similar to Fig. 9, but covering the winter season, 1.10–31.3.
The vast majority of the land area between Pallas and Abisko is inhabited and covered by boreal forest. Inside the possible trajectory sector, we estimated the Kiruna min-ing town to be the most potent anthropogenic source that might influence the aerosol population. Our trajectory anal-ysis showed that, of the trajectories used for the clusters be-tween Abisko and Pallas, (both ways), only 0–8 % passed Kiruna closer than 15 km away, so this town is unlikely to have significantly affected the results.
The fractions of considered trajectories that were within the mixing boundary layer at the upwind station during the transport from the upwind to the downwind station were the following: from Abisko to Pallas 97 %, from Pallas to Abisko 87 %, from Pallas to Värriö 94 % and from Värriö to Pal-las 98 %. We therefore conclude that in the vast majority of cases, the airflow was also connected vertically.
4 Summary and conclusions
and condensation sinks displayed a similar behavior between all the stations. During the summer period, Värriö had the largest rates for the mass concentration increase and conden-sation sink increase, while these two quantities were rather similar for the other two stations. Abisko station differs from Pallas and Värriö with respect to its environment by being surrounded by mountains and the ocean; Pallas is situated above the tree line on the top of a fell, which is sometimes in the clouds, while Värriö is also located on a hill, but inside a boreal forest. The result can be interpreted that the footprint of aerosols is large, which flattens the differences resulting from the near and mid-scale surroundings. At a large scale, all the stations are situated in the boreal forest zone, which has its characteristic biological emissions from soil and veg-etation. During the summer period, the NPF event day proba-bility peaked at overland times of 20–25 h in Värriö and Pal-las, and this number size distribution was flat in Abisko, but this difference was not seen to have an effect on the apparent particle growth rates.
Due to this large-scale homogeneity of the aerosol pro-cesses over northern Scandinavia, the effect of wind direc-tions on the aerosol dynamics between site pairs could be studied separately. Western air masses arriving from ocean have previously been connected to an increased NPF event probability (e.g., Dal Maso et al., 2007). Our study supports this view by showing that during the summer season, both of the transport routes from the west-to-east direction showed an intensifying Aitken mode with an increase in both particle size and concentration. No such phenomenon was observed for the opposite air mass transport direction. Since changes in the Aitken mode were considerably weaker during the win-ter time, the result supported the assumption that biogenic volatile emissions were linked to the particle growth.
We found that during the summer season, the Aitken-mode particles grew at an apparent rate of 1 nm h−1or less during
the air mass transport. The average apparent growth rates of Aitken-mode particles were between 0.55 and 0.72 nm h−1
when looking at air masses arriving from the ocean at the in-dividual stations, and in the range of 0.5–1.3 nm h−1 when
looking at air masses transported between two stations. Both these rates were found to be several times smaller than aver-age particle growth rates during NPF events. This indicates that during the summer season, the condensational growth has an important effect in the regional-scale air masses also when the evident nucleation, i.e. “banana curve”, is not ob-served. Also, when the air masses were traveling from west to east from site to site during the summer period, the air masses for the most frequent clusters at initial site had been overland less than 40 h on average. The Aitken-mode particle concentration increase rates of these clusters were of order of magnitude of 0.01 cm−3s−1; this agrees with the apparent
particle concentration increase rate with the overland times of below 30–40 h above the continent.
During the atmospheric transport, the net effect of the source and sink processes on the particle number
concentra-tion depends on the initial aerosol populaconcentra-tion and its time evolution. The NPF was seen to increase particle number concentrations for overland times up to 30–40 h or, alter-natively, as long as the diameter of the Aitken-mode cles remained below about 40–50 nm. After that, the parti-cle number concentration saturated, which means that NPF was balanced by coagulation and other sink processes. The net accumulation of secondary mass on newly formed and preexisting aerosol particles seemed to continue for at least 4 days of overland transport time.
Acknowledgements. Financial support from the Academy of
Fin-land Centre of Excellence program (project no. 1118615) and the Nordic Centre of Excellence CRAICC (CRyosphere–Atmosphere Interactions in Changing Climate) is gratefully acknowledged.
Edited by: J. Bäck
References
Asmi, E., Kivekäs, N., Kerminen, V.-M., Komppula, M., Hyvärinen, A.-P., Hatakka, J., Viisanen, Y., and Lihavainen, H.: Secondary new particle formation in Northern Finland Pallas site between the years 2000 and 2010, Atmos. Chem. Phys., 11, 12959–12972, doi:10.5194/acp-11-12959-2011, 2011.
Beddows, D. C. S., Dall’Osto, M., and Harrison, R. M.: Cluster analysis of rural, urban, and curbside atmospheric particle size data, Environ. Sci. Technol., 43, 4694–4700, doi:10.1021/es803121t, 2009.
Covert, D. S., Wiedensohler, A., Aalto, P., Heintzenberg, J., Mc-Murry, P. H., and Leck, C.: Aerosol number size distribu-tions from 3 to 500 nm diameter in the arctic marine bound-ary layer during summer and autumn, Tellus B, 48, 197–212, doi:10.1034/j.1600-0889.1996.t01-1-00005.x, 1996.
Dal Maso, M., Kulmala, M., Lehtinen, K., Mäkelä, J., Aalto, P., and O’Dowd, C.: Condensation and coagulation sinks and formation of nucleation mode particles in coastal and bo-real forest boundary layers, J. Geophys. Res., 107, 8097, doi:10.1029/2001JD001053, 2002.
Dal Maso, M., Kulmala, M., Riipinen, I., Wagner, R., Hussein, T., Aalto, P. P., and Lehtinen, K. E. J.: Formation and growth of fresh atmospheric aerosols: eight years of aerosol size distribution data from SMEAR II, Hyytiälä, Finland, Boreal Environ. Res., 10, 323–336, 2005.
Dal Maso, M., Sogacheva, L., Aalto, P. P., Riipinen, I., Komp-pula, M., Tunved, P., Korhonen, L., Suur-Uski, V., Hirsikko, A., Kurtén, T., Kerminen, V.-M., Lihavainen, H., Viisanen, Y., Hans-son, H., and Kulmala, M.: Aerosol size distribution measure-ments at four Nordic field stations: identification, analysis and trajectory analysis of new particle formation bursts, Tellus B, 59, 350–361, doi:10.1111/j.1600-0889.2007.00267.x, 2007. Draxler, R. R. and Hess, G.: An overview of the HYSPLIT_4
mod-elling system for trajectories, dispersion, and deposition, Aust. Meteorol. Mag., 47, 295–308, 1998.
Atmos. Chem. Phys., 9, 2481–2497, doi:10.5194/acp-9-2481-2009, 2009.
Hari, P., Kulmala, M., Pohja, T., Lahti, T., Siivola, E., Palva, L., Aalto, P., Hämeri, K., Vesala, T., and Luoma, S.: Air pollution in eastern Lapland: challenge for an environmental measurement station, Silva Fenn., 28, 29–39, 1994.
Hatakka, J., Aalto, T., Aaltonen, V., Aurela, M., Hakola, H., Komp-pula, M., Laurila, T., Lihavainen, H., Paatero, J., and Salminen, K.: Overview of the atmospheric research activities and results at Pallas GAW station, Boreal Environ. Res., 8, 365–383, 2003. Heintzenberg, J., Birmili, W., Wiedensohler, A., Nowak, A.,
and Tuch, T.: Structure, variability and persistence of the submicrometre marine aerosol, Tellus B, 56, 357–367, doi:10.1111/j.1600-0889.2004.00115.x, 2004.
Hussein, T., Dal Maso, M., Petäjä, T., Koponen, I. K., Paatero, P., Aalto, P. P., Hämeri, K., and Kulmala, M.: Evaluation of an auto-matic algorithm for fitting the particle number size distribution, Boreal Environ. Res., 10, 337–355, 2005.
Jiang, J. H., Eckermann, S. D., Wu, D. L., and Ma, J.: A search for mountain waves in MLS stratospheric limb radi-ances from the winter Northern Hemisphere: Data analysis and global mountain wave modeling, J. Geophys. Res., 109, D03107, doi:10.1029/2003JD003974, 2004.
Karvosenoja, N., Kangas, L., Kupiainen, K., Kukkonen, J., Karp-pinen, A., Sofiev, M., Tainio, M., Paunu, V.-V., Ahtoniemi, P., Tuomisto, J. T., and Porvari, P.: Integrated modeling as-sessments of the population exposure in Finland to primary
PM2.5from traffic and domestic wood combustion on the
res-olutions of 1 and 10 km, Air Qual. Atmos. Health, 4, 179–188, doi:10.1007/s11869-010-0100-9, 2010.
Kerminen, V.-M., Lihavainen, H., Komppula, M., Viisanen, Y., and Kulmala, M.: Direct observational evidence linking atmospheric aerosol formation and cloud droplet activation, Geophys. Res. Lett., 32, L14803, doi:10.1029/2005GL023130, 2005.
Komppula, M., Lihavainen, H., Hatakka, J., Paatero, J., Aalto, P., Kulmala, M., and Viisanen, Y.: Observations of new particle for-mation and size distributions at two different heights and sur-roundings in subarctic area in northern Finland, J. Geophys. Res., 108, 4295, doi:10.1029/2002JD002939, 2003.
Komppula, M., Lihavainen, H., Kerminen, V.-M., Kulmala, M., and Viisanen, Y.: Measurements of cloud droplet activation of aerosol particles at a clean subarctic background site, J. Geophys. Res., 110, D06204, doi:10.1029/2004JD005200, 2005.
Komppula, M., Sihto, S.-L., Korhonen, H., Lihavainen, H., Ker-minen, V.-M., Kulmala, M., and Viisanen, Y.: New particle formation in air mass transported between two measurement sites in Northern Finland, Atmos. Chem. Phys., 6, 2811–2824, doi:10.5194/acp-6-2811-2006, 2006.
Koponen, I. K., Virkkula, A., Hillamo, R., Kerminen, V.-M., and Kulmala, M.: Number size distributions and concentrations of marine aerosols: Observations during a cruise between the En-glish Channel and the coast of Antarctica, J. Geophys. Res., 107, 4753, doi:10.1029/2002JD002533, 2002.
Kulmala, M., Suni, T., Lehtinen, K. E. J., Dal Maso, M., Boy, M., Reissell, A., Rannik, Ü., Aalto, P., Keronen, P., Hakola, H., Bäck, J., Hoffmann, T., Vesala, T., and Hari, P.: A new feedback mecha-nism linking forests, aerosols, and climate, Atmos. Chem. Phys., 4, 557–562, doi:10.5194/acp-4-557-2004, 2004a.
Kulmala, M., Vehkamäki, H., Petäjä, T., Dal Maso, M., Lauri, A., Kerminen, V.-M., Birmili, W., and McMurry, P. H.: Formation and growth rates of ultrafine atmospheric parti-cles: a review of observations, J. Aerosol Sci., 35, 143–176, doi:10.1016/j.jaerosci.2003.10.003, 2004b.
Kulmala, M., Alekseychik, P., Paramonov, M., Laurila, T., Asmi, E., Arneth, A., Zilitinkevich, S., and Kerminen, V.-M.: On measure-ments of aerosol particles and greenhouse gases in Siberia and future research needs, Boreal Environ. Res., 16, 337–362, 2011. Kulmala, M., Petäjä, T., Nieminen, T., Sipilä, M., Manninen, H. E., Lehtipalo, K., Dal Maso, M., Aalto, P. P., Junni-nen, H., and PaasoJunni-nen, P.: Measurement of the nucleation of atmospheric aerosol particles, Nat. Protoc., 7, 1651–1667, doi:10.1038/nprot.2012.091, 2012.
Lamberg, H., Nuutinen, K., Tissari,J., Ruusunen, J., Yli-Pirilä, P., Sippula, O., Tapanainen, M., Jalava, P., Makkonen, U., Teinilä, K., Saarnio, K., Hillamo, R., Hirvonen, M.-R., and Jokiniemi, J.: Physicochemical characterization of fine particles from small-scale wood combustion, Atmos. Environ., 45, 7635– 7643, doi:10.1016/j.atmosenv.2011.02.072, 2011.
Law, K. S. and Stohl, A.: Arctic Air Pollution: Origins and Impacts, Science, 315, 1537–1540, doi:10.1126/science.1137695, 2007. Lihavainen, H., Kerminen, V.-M., Tunved, P., Aaltonen, V., Arola,
A., Hatakka, J., Hyvärinen, A., and Viisanen, Y.: Observational signature of the direct radiative effect by natural boreal forest aerosols and its relation to the corresponding first indirect effect, J. Geophys. Res., 114, D20206, doi:10.1029/2009JD012078, 2009.
Lu, J. and Cai, M.: Quantifying contributions to polar warming amplification in an idealized coupled general circulation model, Clim. Dynam., 34, 669–687, doi:10.1007/s00382-009-0673-x, 2010.
MathWorks Inc., Matlab Documentation Center: Kmeans
clus-tering[Homepage of Mathworks], [Online], available at: http:
//www.mathworks.se/help/stats/kmeans.html (last access: 17 Novermber 2012), 2011.
Nappo, C. J.: An introduction to atmospheric gravity waves, Aca-demic Press, San Diego, California, USA, 47–80, 2002. O’Dowd, C. D., Facchini, M. C., Cavalli, F., Ceburnis, D., Mircea,
M., Decesari, S., Fuzzi, S., Yoon, Y. J., and Putaud, J. P.: Bio-genically driven organic contribution to marine aerosol, Nature, 431, 676–680, doi:10.1038/nature02959, 2004.
Paasonen, P., Asmi, A., Petäjä, T., Kajos, M. K., Äijälä, M., Jun-ninen, H., Holst, T., Abbatt, J. P. D., Arneth, A., Birmili, W., van der Gon, H. D., Hamed, A., Hoffer, A., Laakso, L., Laakso-nen, A., Leaitch, W. R., Plass-Dülmer, C., Pryor, S. C., RäisäLaakso-nen, P., Swietlicki, E., Wiedensohler, A., Worsnop, D. R., Kerminen, V.-M., and Kulmala, M.: Warming-induced increase in aerosol number concentration likely to moderate climate change, Nat. Geosci., 6, 438–442, doi:10.1038/ngeo1800, 2013.
Ruuskanen, T. M., Reissell, A., Keronen, P., Aalto, P. P., Laakso, L., Gronholm, T., Hari, P., and Kulmala, M.: Atmospheric trace gas and aerosol particle concentration measurements in Eastern Lapland, Finland 1992–2001, Boreal Environ. Res., 8, 335–350, 2003.
Scorer, R. S.: Theory of waves in the lee of mountains, Q. J. Roy. Meteor. Soc., 75, 41–56, doi:10.1002/qj.49707532308, 1949. Screen, J., Deser, C., and Simmonds, I.: Local and remote controls
on observed Arctic warming, Geophys. Res. Lett., 39, L10709, doi:10.1029/2012GL051598, 2012.
Shindell, D. and Faluvegi, G.: Climate response to regional radiative forcing during the twentieth century, Nat. Geosci., 2, 294–300, doi:10.1038/ngeo473, 2009.
Sihto, S.-L., Mikkilä, J., Vanhanen, J., Ehn, M., Liao, L., Lehtipalo, K., Aalto, P. P., Duplissy, J., Petäjä, T., Kerminen, V.-M., Boy, M., and Kulmala, M.: Seasonal variation of CCN concentrations and aerosol activation properties in boreal forest, Atmos. Chem. Phys., 11, 13269–13285, doi:10.5194/acp-11-13269-2011, 2011. Sogacheva, L., Dal Maso, M., Kerminen, V.-M., and Kulmala, M.: Probability of nucleation events and aerosol particle concentra-tion in different air mass types arriving at Hyytiälä, southern Fin-land, based on back trajectories analysis, Boreal Environ. Res., 10, 479–491, 2005.
Spracklen, D. V., Bonn, B., and Carslaw, K. S.: Boreal forests, aerosols and the impacts on clouds and climate, Philos. T. Roy. Soc. A, 366, 4613–4626, doi:10.1098/rsta.2008.0201, 2008. Spracklen, D. V., Carslaw, K. S., Pöschl, U., Rap, A., and Forster,
P. M.: Global cloud condensation nuclei influenced by carbona-ceous combustion aerosol, Atmos. Chem. Phys., 11, 9067–9087, doi:10.5194/acp-11-9067-2011, 2011.
Stohl, A.: Computation, accuracy and applications of trajectories – A review and bibliography, Atmos. Environ., 32, 947–966, doi:10.1016/S1352-2310(97)00457-3, 1998.
Svenningsson, B., Arneth, A., Hayward, S., Holst, T., Massling, A., Swietlicki, E., Hirsikko, A., Junninen, H., Riipinen, I., and Vana, M.: Aerosol particle formation events and analysis of high growth rates observed above a subarctic wetland-forest mosaic, Tellus B, 60, 353–364, doi:10.1111/j.1600-0889.2008.00351.x, 2008.
Tunved, P., Korhonen, H., Ström, J., Hansson, H.-C., Lehtinen, K. E. J., and Kulmala, M.: A pseudo-Lagrangian model study of the size distribution properties over Scandinavia: transport from As-pvreten to Värriö, Atmos. Chem. Phys. Discuss., 4, 7757–7794, doi:10.5194/acpd-4-7757-2004, 2004.
Tunved, P., Hansson, H. C., Kerminen, V.-M., Ström, J., Maso, M. D., Lihavainen, H., Viisanen, Y., Aalto, P., Komppula, M., and Kulmala, M.: High natural aerosol loading over boreal forests, Science, 312, 261–263, doi:10.1126/science.1123052, 2006a. Tunved, P., Korhonen, H., Ström, J., Hansson, H. C., Lehtinen, K.,
and Kulmala, M.: Is nucleation capable of explaining observed aerosol integral number increase during southerly transport over Scandinavia?, Tellus B, 58, 129–140, 2006b.
Tunved, P., Ström, J., Kulmala, M., Kerminen, V.-M., Dal Maso, M., Svenningson, B., Lunder, C., and Hansson, H. C.: The natural aerosol over northern Europe and its relation to anthropogenic emissions – implications of important climate feedbacks, Tellus B, 60, 473–484, doi:10.1111/j.1600-0889.2008.00363.x, 2008. Vehkamäki, H., Dal Maso, M., Hussein, T., Flanagan, R.,