A Social Network Approach Reveals
Associations between Mouse Social
Dominance and Brain Gene Expression
Nina So1,2, Becca Franks1,3, Sean Lim1, James P. Curley1*
1Psychology Department, Columbia University, New York, NY 10027, United States of America,2Doctoral Program in Neurobiology and Behavior, Columbia University, New York, NY 10025, United States of America,3UBC Animal Welfare Program, 2357 Main Mall, Vancouver, BC, V6T 1Z4, Canada
Abstract
Modelling complex social behavior in the laboratory is challenging and requires analyses of dyadic interactions occurring over time in a physically and socially complex environment. In the current study, we approached the analyses of complex social interactions in group-housed male CD1 mice living in a large vivarium. Intensive observations of social interac-tions during a 3-week period indicated that male mice form a highly linear and steep domi-nance hierarchy that is maintained by fighting and chasing behaviors. Individual animals were classified as dominant, sub-dominant or subordinate according to their David’s Scores and I& SI ranking. Using a novel dynamic temporal Glicko rating method, we ascertained that the dominance hierarchy was stable across time. Using social network analyses, we characterized the behavior of individuals within 66 unique relationships in the social group. We identified two individual network metrics, Kleinberg’s Hub Centrality and Bonacich’s Power Centrality, as accurate predictors of individual dominance and power. Comparing across behaviors, we establish that agonistic, grooming and sniffing social networks pos-sess their own distinctive characteristics in terms of density, average path length, reciprocity out-degree centralization and out-closeness centralization. Though grooming ties between individuals were largely independent of other social networks, sniffing relationships were highly predictive of the directionality of agonistic relationships. Individual variation in domi-nance status was associated with brain gene expression, with more dominant individuals having higher levels of corticotropin releasing factor mRNA in the medial and central nuclei of the amygdala and the medial preoptic area of the hypothalamus, as well as higher levels of hippocampal glucocorticoid receptor and brain-derived neurotrophic factor mRNA. This study demonstrates the potential and significance of combining complex social housing and intensive behavioral characterization of group-living animals with the utilization of novel sta-tistical methods to further our understanding of the neurobiological basis of social behavior at the individual, relationship and group levels.
OPEN ACCESS
Citation:So N, Franks B, Lim S, Curley JP (2015) A Social Network Approach Reveals Associations between Mouse Social Dominance and Brain Gene Expression. PLoS ONE 10(7): e0134509. doi:10.1371/journal.pone.0134509
Editor:Igor Branchi, Istituto Superiore di Sanità, ITALY
Received:April 23, 2015
Accepted:July 9, 2015
Published:July 30, 2015
Copyright:© 2015 So et al. This is an open access article distributed under the terms of theCreative Commons Attribution License, which permits unrestricted use, distribution, and reproduction in any medium, provided the original author and source are credited.
Data Availability Statement:All relevant data are within the paper and its Supporting Information files.
Funding:This research was supported by the Psychology Department, Columbia University.
Introduction
Study of social behavior in laboratory mice has primarily focused on short-term social encoun-ters between familiar or unfamilar dyads [1,2]. The ancestors of laboratory mice are various substrains of Mus (Mus musculus,Mus domesticus,Mus castaneus,Mus moloisha) [3] and it is
not possible to explicitly state what the natural ecology of a laboratory mice would have been. However, what all of these subspecies share in common is that they live in large groups with organized social structures and dominance hierarchies [4,5]. Attempts to explore social organi-zation of mice have been limited, but do include studies of the spatial organiorgani-zation of wild mice, wild-derived mice and lab mice in semi-natural environments [6,7], and of the territorial-ity of male mice living in small groups in large arenas [8–10]. More recently, the spatial organi-zation of small groups of mice in large arenas has been explored using automated tracking technologies [11–14]. However, these approaches have low resolution when distinguishing between highly similar behaviors that may occur rapidly or briefly (e.g. fighting, chasing), as well as those behaviors that occur between individuals whose identity may be obscured by other individuals or objects (e.g. nestboxes). Thus, these approaches may have significant limi-tations when used to describe complex social encounters in group-living environments.
Across species, understanding the social behavior and organization of any group of individ-uals requires evaluation of multiple levels of analysis: the individual, relationship, and group, and changes in these levels over time [15]. Social network analysis (SNA) has emerged an important methodological tool for unraveling social complexity at these multiple levels of anal-yses [16]. The advantage of SNA is that social groups can be analyzed by examining individual social behaviors within the context of their own direct relationships with others as well as their indirect relationships, thus building up a more complete picture of the social lives of group-liv-ing animals. SNA has most commonly been applied in behavioral ecology and primatology, for instance to explore the fitness benefits of individual differences in network position or how these are associated with variation in personality traits and genetic polymorphisms such as the serotonin transporter gene [15–19].
An important feature of living in a social group is that animals must quickly and flexibly exhibit dominance and subordinate behaviors according to the relative social position of their social partners. Social hierarchies in a group, once established, can be remarkably stable over time. In those studies of animals who are given the opportunity to spatially distribute them-selves and to form social hierarchies, converging evidence from a diverse array of species including fish, primates and humans indicates the critical importance of the amygdala and hypothalamus in modulating this behavioral flexibility [20–27]. Although little is known as to the neurobiological basis of mouse social hierarchies living in large groups, studies of dyadic interactions have similarly implicated the medial and central nuclei of the amygdala [28–32] and the hypothalamus including the preoptic area [33–36] in the integration and evaluation of emotional and social information to eventuate rapid expression of contextually appropriate social behavior. Further, expression of the peptide hormone corticotrophin releasing factor (CRF) in these regions has also been shown to promote the learning and evaluation of social and emotional stimuli as well as dynamically modulating both dominant and subordinate behaviors dependent on social context in dyadic contests [37–39].
behaviors between individuals. We also utilize SNA to characterize the agonistic (fighting and chasing) as well as other social (sniffing and allogrooming) behavioral interactions of mice. Through comparison with other well-established methodologies of social dominance analysis, we propose that particular global and individual level network metrics are especially well suited to characterizing dominance power in animal social networks. We also test whether the social networks of different behaviors are related to determine if fighting and chasing are equally meaningful representations of dominance relationship status, to identify if other social behav-ior networks are related to agonistic network patterns and to understand what the functions of sniffing and allogrooming are in mouse social groups. We also analyze the relative gene expression of CRF of each individual in the medial and central nuclei of the amygdala, the medial preoptic area of the hypothalamus and also in the hippocampus as a control region. We hypothesized that those animals that were able to reach the top of dominance hierarchies would have higher relative expression in the amygdala and hypothalamus. Additionally, in the hippocampus, we investigate each individual’s relative gene expression of brain derived neurotrophic factor (BDNF). BDNF has been shown to be an important modulator of neural plasticity and social learning [40], and it is also elevated in mice who are quicker to learn their social dominance or subordinate status [41]. There is also evidence that hippocampal BDNF may specifically promote the ability of individuals to acquire knowledge about their social dominance [42,43]. We therefore hypothesized that more dominant animals would show increases in the relative expression of BDNF. Finally, we also test whether an individual’s social role was predictive of the relative expression of the glucocortiocoid receptor (GR) gene in the hippocampus.
Materials and Methods
Subjects and Housing
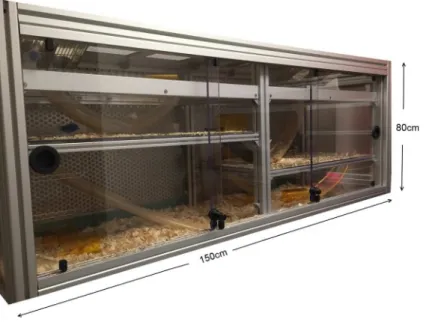
12 male outbred CD1 mice aged 6 weeks were purchased from Charles River and housed in groups of 4 for 3 weeks prior to testing. All mice were individually and uniquely marked by dying their fur with a blue, nontoxic, non-hazardous marker (Stoelting Co.). These marks remain for up to 12 weeks and only require one application, thus enabling each animal to be uniquely identified throughout the study. All animals were also given a unique and random two-letter code for identification purposes. At 9 weeks of age, all mice were weighed and placed into a large custom built mouse vivarium (length 150cm, height 80cm, width 80cm; Mid-Atlan-tic)(Fig 1). The vivarium consisted of three sides of Plexiglas with sliding front doors and a metal backboard containing multiple holes for air circulation. The vivarium was split into two sides, each with two shelves. Standard food chow and water was provided ad libitum at the top shelf via cage lids that protruded through the vivarium roof. Animals could access each shelf via the backboard or via ramps and tunnels that connected each shelf and side. Multiple enrich-ment objects such as plastic igloos and wooden blocks were also provided. Floors of each shelf and side were covered with pine shaving bedding. The animals were kept in the same room throughout the study, with white lights (light cycle) coming on at 2400 hours and red lights (dark cycle) coming on at 1200 hours, at a constant temperature (21–24°C) and humidity (30–
50%). Mice were housed in the Department of Psychology at Columbia University. All proce-dures were conducted with approval from the Columbia University Institutional Animal Care and Use Committee (ICAUC).
Behavioral Observations
day. At each time interval, trained observers recorded the location, behavior and social partner (target individual) of every mouse (focal individual) in the vivarium (see ethogram inS1 Table). On a typical day, observations began at 10 AM and ended at 5 PM, thus our sampling period covered the last two hours of the white light cycle and the first half of the red light cycle. All data were inputted live to an android device and uploaded to our secure server using Qual-trics (QualQual-trics, Provo, UT). Fighting, chasing, allogrooming and sniffing data were used for all subsequent analyses.
Data Structure & Matrix Organization
All recorded behaviors directed from one individual to another were organized into separate square matrices by each behavior (fighting, chasing, sniffing, grooming). These matrices are referred to as interaction frequency sociomatrices. In social network analysis they are also referred to as the valued data. Each row and column refers to a specific individual, with the ini-tiator/giver of each behavior being represented by the row and the receiver of each behavior being represented in the column. As individuals cannot initiate behaviors against themselves no data exists in the diagonal of each matrix. Additionally, a fifth matrix was comprised (‘all aggression’matrix) which is the sum of the entries for the fighting and chasing interaction frequency sociomatrices. These data are also referred to as directed or asymmetric data as indi-viduals may direct behaviors more frequently to indiindi-viduals than they receive those same behaviors from the same individuals. For other analyses, each interaction frequency socioma-trices are binarized. One set of binary masocioma-trices produced are the presence/absence binary matrices. Here, each cell of the binary matrix is given a‘0’if a‘0’exists in the corresponding cell in the frequency interaction sociomatrix. Cells are given a‘1’if any value greater than‘0’
exists in the corresponding cell in the frequency interaction sociomatrix. These matrices cap-ture whether‘individual i’was ever observed directed each behavior to‘individual j’in the matrix (a‘1’indicating the presence of that behavior and a‘0’indicating the absence of that behavior). A second binarizing method produces win/loss matrices. This method is only applied to the fighting, chasing and‘all aggression’behavioral matrices. Here, if‘individual i’
Fig 1. The mouse vivarium.
directs a greater number of a particular behavior towards‘individual j’than it receives from
‘individual j’then a‘1’is entered into the binary matrix in the cell [row i, column j] and a‘0’is entered into the binary matrix in the corresponding cell [row j, column i]. In this sense,‘ indi-vidual i' is considered the‘winner’and‘individual j’the‘loser’. If individuals direct the same amount of behavior towards each other (i.e. they tie and there is no clear winner) then both cells get a‘0’[44,45]. This is performed for every potential relationship in the matrix. Both the presence/absence and win/loss binary matrices are considered directed, asymmetric data and are also referred to as adjacency matrices for the social network analysis. These operations are performed using the R package compete v0.1 [46].
Dominance Hierarchy Analysis
Data analysis was undertaken primarily in R version 3.2.0 [47]. The following three global mea-sures of dominance hierarchies were undertaken independently upon the fighting, chasing and all aggression interaction frequency sociomatrices.a) Linearity–The hierarchy linearity was assess using De Vries’improved linearity index that corrects for unknown relationships [48]. This method computes a modified Landau’s h’linearity index value which ranges from 0 (no linearity) to 1 (strictly linear). The probabilistic significance of this linearity was determined by performing 10,000 two-step randomizations whereby data within each matrix are permuted producing a range of h’values against which the computed h’value can be compared. This was calculated using the R package compete v0.1 [46].b) Steepness–The steepness of a hierarchy is a measure of how large the absolute differences in dominance contest winning ability are between adjacently ranked individuals [49]. A steepness of‘0’would represent these differences being very small and a steepness of‘1’represents these differences being very large. Here, we calculate steepness using the R package Steepness v0.2.2 [50]. Briefly, a dyadic dominance index (Dij) is calculated which is equal to the proportion of wins and losses corrected for the frequency of interactions. Dij then can be used to calculate normalized David’s Scores (DS) for each individual (see below for more information). Regressing the normalized DS against the individual rank of each DS determines the steepness. The probabilistic significance of hierarchy steepness (i.e. against the null hypothesis of random win likelihoods for individuals across all relationships) is then computed by performing 10,000 randomizations. We also report the steepness calculated based on the Pij dominance indices which do not account for individual differences in frequency of interaction and are simply a ratio of total wins to total interactions.
c) Directional Consistency (DC)–The DC index is calculated for each sociomatrix and ranges from 0 (where there is equal likelihood that directed behavior occurs in each direction between individuals) to 1 (where all directed behavior is always in the most frequent direction) [51]. DC is calculated across all dyads and is equal to (H-L)/(H+L) where H is the number of times the behavior occurred in the most frequent direction and L is the number of times the behavior occurred in the least frequent direction within each dyad. The DC is a commonly used and straightforward index to assess dominance structure but there is no significance testing associ-ated with it. We calculassoci-ated DC using the R package compete v0.1 [46].
Individual Dominance Measures
diagonal and all‘0’s would be beneath the diagonal. As this is rarely achieved, this method computes those matrices that minimize the number of rank inconsistencies, i.e. those matrices that possess the fewest‘1’s under the diagonal. The final rank order is equivalent to the row/ column order of individuals. This method does not always produce one optimal solution, for a given matrix there may be several solutions. For those matrices where more than one ranking solution was found, we calculated the average I&SI rank across all optimal solutions found for each individual. We calculated I&SI ranks using the R package compete v0.1 [46]. To calculate each individual's I&SI rank in our data we determined all potential rank order solutions for each behavior matrix and averaged the ranks for each individual to determine their final aver-age I&SI rank.b) David’s Scores–We calculated the David’s score of each individual, which is a cardinal score of the overall success of an individual at winning contests relative to the suc-cess of its opponents [53–55]. This is achieved by calculating the dyadic proportion of wins (Pij) for each individual i in contests with another individual j. If individuals never interact, then Pij and Pji = 0. The DS of each individual is then calculated by adjusting for the raw versus weighted sums of Pij for i and j. David’s Scores were calculated using the R package Steepness v0.2.2 [50].
Glicko Rating System
contests. The Glicko analysis was performed on data containing fights only, chases only and all aggressive behaviors (fights and chases combined). Glicko Ratings were analyzed using the
‘PlayerRatings’package in R. Intercorrelations between individual dominance ratings and ranks were analyzed using Spearman rank tests in R.
Social Network Analysis
For social network analysis, we converted interaction frequency sociomatrices for each behav-ior (fighting, chasing, sniffing, grooming) into presence/absence binary adjacency matrices (see
Data Structure and Matrix Organizationsection above). Network measures were analyzed using the‘igraph v0.7.1’and‘sna v2.3–2’packages in R, and UCINET 6 [59–61]. Networks were visualized using Gephi v0.8.2 using the GC-Viz plugin layout algorithm [62]. Given the vast array of potential social network metrics that could be analyzed, we chose a small subset that met the following criteria: i) those that are appropriate for asymmetric directed networks–
i.e. not those that require matrices to be symmetrized, ii) those that make theoretical sense in the context of this study–i.e. those that are informative to describing the hierarchical nature of the social group and individual differences in influence and power.
Global Network Measures. To compare global network structural similarities and differ-ences across behavioral networks we applied three common measures of inter-connectivity [63]: a)Density–the proportion of all possible ties that exist in the network; b)Average Path Length–the average number of steps between any two individuals in the network. Unreachable nodes are given the maximum path length; c)Reciprocity–the proportion of mutual ties that exist in the network. We also analyzed the degree to which power is unequally shared within each network. d)Out-degree Centralization–This measures the degree of variability in the distribution of out-degree across all individuals in the network normalized to the maximum achievable centralization for a network of the same size (which occurs when one individual is at the center of a star network graph and is the only individual to connect to any other indi-vidual) [63]. Higher scores reflect greater variability in the distribution of out-degree between individuals, indicating that the power of individuals varies substantially. e)Out-closeness Centralization–Individuals with high out-closeness centrality are highly connected to many individuals in short steps. The global network centralization measure reflects how variable the distribution of these centrality scores are across individuals in the network normalized to a theoretical maximum achieved with a star network graph [63]. Networks with high out-close-ness centralization scores possess individuals with highly unequally distributed power.
Individual Network Measures. To compare the position of individuals in each behavioral network, we computed the following measures of centrality and influence for each presence/ absence binary matrix [63].a)Out-degree & In-degree–The number of ties of each individual to (out) and from (in) all other individuals.b)Out-closeness & In-closeness Centrality–
Whereas‘degree’measures only take into account the total number of ties of each individual, the closeness centrality measures reflect how closely tied each individual is to every other indi-vidual in the network. High out-closeness centrality indicates an indiindi-vidual is closely connected to many individuals in relatively few steps; high in-closeness centrality is reflective of having many other individuals being closely connected to an individual via relatively short paths.c)
Betweenness centrality–This measure indicates how proportionally frequently an individual lies on shortest paths between all other pairs of individuals in the network. We further exam-ined two measures of individual power by analyzing the win/loss binary matrices for fighting, chasing and all aggression.d)Bonacich’s Power Centrality–This measure defines an
powerful individuals being those who have directed ties to many other individuals who do not have very many outgoing directed ties themselves. In this sense, individuals become more powerful as individuals that they are tied to become weaker. The minimum value ofβshould be [1 / (the maximum out-degree of any individual)] [64]. Here, theβvalue used is -0.09.e)
Hub Centrality–This measure was developed by Kleinberg [65] to evaluate the connectivity of
webpages. Briefly, individuals that have a high number of outgoing ties will have higher hub scores especially if these outgoing ties are directed to‘authorities’–these are individuals who receive a lot of ties from other individuals.
Social Network Statistical Analysis. Statistical analysis of global metrics were undertaken using bootstrapping methods provided by UCINET [59]. We tested whether the density of each network was significantly different from a theoretically maximally connected network of density = 1 by randomly permuting ties within each network 5,000 times to generate a distri-bution of network densities to which the observed value can be compared. Comparison of densities between behavioral networks was performed using a bootstrapped version of the paired t-test with 5,000 permutations in UCINET. We also tested whether the patterning of relationships between individuals was similar or dissimilar across different behavioral networks by testing whether they were significantly associated with each other using the quadratic assignment procedure (QAP) regression in UCINET [59,66] which accounts for non-indepen-dence in the data. The QAP is similar to a Mantel test. A standard regression is computed across all corresponding cells for each pair of behavior networks to be tested. Then the cells of one matrix are randomly permuted and the regression is repeated. This permutation procedure is repeated 5,000 times, following which the observed regression coefficient is compared to the distribution of coefficients to determine a p-value. We also tested whether the fighting and chasing networks had a hierarchical like structure by testing whether the maximum out-degree of each network significantly differed from random by computing the out-degree for 5,000 random networks drawn from a Bernoulli graph distribution that had the exact same number of nodes and graph density as each behavior network [67]. Similarly, we tested whether the grooming network had significantly higher reciprocity than expected by chance by comparing to 5,000 random networks with the same number of nodes and graph density. P-values were determined by calculating the proportion of computed maximum out-degrees that were greater than or equal to the observed value for each network. This was performed using the SNA pack-age in R [60]. Individual variation in network metrics were compared across behavior networks using Spearman rank correlations in R. As values for the fighting network were not normally distributed, this non-parametric approach was taken for all tests (even those not involving the fighting network) to be consistent and conservative across tests. As each measure (e.g. sniffing out-degree) could be correlated with three other behavior networks (fighting, chasing, groom-ing), we used a Bonferonni corrected significance level of p = (0.05/3) 0.0167. Intercorrelations between individual network metrics and dominance ranks were also analyzed using Spearman rank tests in R.
Real Time PCR analysis
diameter area along the midline from Bregma +0.14mm to -0.7mm. The hippocampus was col-lected bilaterally from Bregma -0.82mm to -1.46mm by extracting tissue within the boundaries of the hippocampal structure using a 0.5mm diameter Micro-Punch. RNA was isolated from the dissected brain regions of each male using the AllPrep DNA/RNA Mini Kit (Qiagen) and reverse transcribed to cDNA using the SuperScript III First-Strand Synthesis System for RT-PCR applications (Invitrogen). Quantitative RT-PCR was performed with 1μL of cDNA
using an ABI 7500 Fast Thermal Cycler and the Fast SYBR Green Master Mix reagent (Applied Biosystems). All primer probes (Sigma-Aldrich) were designed to span exon boundaries ensur-ing amplification of only mRNA. For each gene, CTvalues were normalized to cyclophillin A
(endogenous control). Relative expression values were obtained by theΔΔCTmethod with
fold-change being determined respective to the individual with the lowest expression value for each gene in each brain region. The following validated quantitative PCR primers were used for mRNA analysis [69]: brain-derived neurotrophic factor—BDNF (Forward: CCATAAAGG ACGCGGACTTGTACA, Reverse: AGACATGTTTGCGGCATCCAG); Ccorticotrophin-releasing hormone—CRF (Forward: GGGAAGTCTTGGAAATGGC, Reverse: GCAACATTT CATTTCCCGAT); cyclophilin A—CYPHA (Forward: GAGCTGTTTGCAGACAAAGTTC, Reverse: CCCTGGCACATGAATCCTGG); glucocorticoid receptor—NR3C1 (Forward: AACTGGAATAGGTGCCAAGG, Reverse: GAGGAGAACTCACATCTGGT). Intercorrela-tions between relative gene expression and individual network metrics and dominance ranks were analyzed using Spearman rank tests in R. We also conducted separate principal compo-nents analyses (PCA) for the fighting and chasing networks on individual network metrics and dominance ranks used in the correlation analysis. This was done using the FactoMineR R pack-age v1.30 [70]. Each produced one component‘dominance’that accounted for the majority of variance (87%) and thus individual components scores were also correlated against the expres-sion of each gene. Note—one sample of mPOA CRF was contaminated and disregarded from analyses.
Results
1. Social Dominance
The frequency interaction sociomatrices and binarizedsociomatrices are presented inFig 2and
S2andS3Figs.
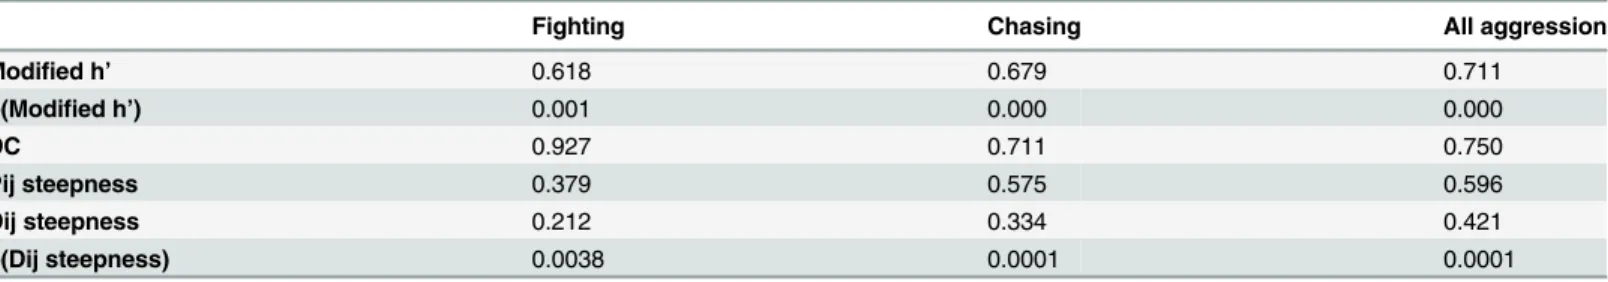
Dominance Hierarchy analysis. All three agonistic interaction frequency sociomatrices (chasing, fighting, all aggression) possessed significant linearity of social dominance (Table 1). The observed values of Landau's modified h' value from each agonistic interaction frequency sociomatrix was significantly higher than the distribution of possible h' values generated from permuting each matrix 10,000 times (S4 Fig). Further, the directional consistency of the fight-ing sociomatrix was extremely high with 93% of all fights occurrfight-ing in the direction of more dominant to more subordinate individual (Table 1). The directional consistency of the chasing sociomatrix was also very high, with 71% of all chases occurring in the direction of more dominant individual to more subordinate individual. A third complementary measure of the structure of social hierarchy is the steepness of the hierarchy. This is a measure of how much inter-individual variability exists in the overall win success of contests. We found that when considering fighting and chasing matrices separately or when considering all aggressive acts together that all hierarchies had highly significant steepness (p<0.0003;Table 1)
Spearman’s Rank test). Further, the location of attack did not affect the likelihood of winning or losing by any individual as has been observed in previous studies [71].
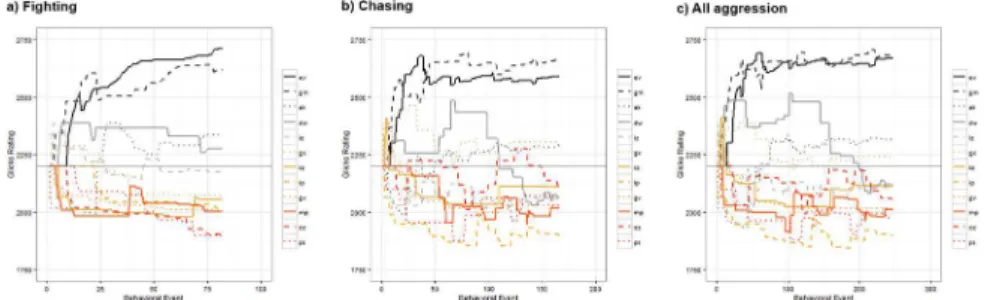
Temporal analysis. The results of the Glicko analysis on the pairwise fighting, chasing and all aggressive behavior data are presented inFig 3. The final Glicko ratings and rankings of each individual are shown inTable 2. With the fighting, chasing and all aggression data, four individuals finished with a rating above their initial starting rating of 2200. As can be seen fromFig 3, the consistency of the rank order of Glicko ratings was very high across time with very little change-over in rankings of individual animals occurring after the initial first third of the data. This was especially the case for the temporal distribution of individual differences in fighting ratings. Further, as shown inS1 Figthe general pattern of individual differences in the distribution of Glicko ratings was very consistent over a range of 'c' constant values (1–20). As can also be seen fromS5 Fig, there exists incredibly high consistency in individual ranks of final Glicko ratings for fighting across this range of c-values, therefore making the choice of 'c' value for our data relatively trivial.
Consistency of ranking methods. We examined the consistency between ranking meth-ods based on cardinal values (David's scores), minimizing matrix inconsistencies (I&SI) and temporal pairwise contests (Glicko). All three methods were extremely significantly positively
Fig 2. Frequency of observed social interactions.a) Fighting, b) Chasing, c) All aggression, d) Sniffing, e) Grooming. Behaviors are directed from individuals in rows to those in columns.
doi:10.1371/journal.pone.0134509.g002
Table 1. Summary statistics of dominance hierarchy analysis for chasing, fighting and all aggression. (Modified h' = Landau’s modified h’index of lin-earity; p(Modified h’) = p-value for Landau’s modified h’index of linearity after 10,000 randomizations; DC = directional consistency; Pij steepness = Pij index of steepness of hierarchy; Dij steepness = Dij index of steepness of hierarchy which controls for frequency of interaction; p(Dij steepness) = p-value of Dij after 10,000 randomizations.
Fighting Chasing All aggression
Modified h’ 0.618 0.679 0.711
p(Modified h’) 0.001 0.000 0.000
DC 0.927 0.711 0.750
Pij steepness 0.379 0.575 0.596
Dij steepness 0.212 0.334 0.421
p(Dij steepness) 0.0038 0.0001 0.0001
correlated to one another using Spearman rank correlation tests even after correcting for multi-ple comparisons (Table 3, Spearman's rho range between 0.73–0.96, all p<.0001). Thus, the
ranking of individuals within each behavioral context was extremely similar regardless of the ranking method chosen. When comparing the consistency of individual competitive ability between fighting versus chasing behaviors, dominance scores were significantly correlated for I&SI ranks (rho = 0.80, p<0.005), Glicko scores (rho = 0.69, p<0.05), and David's scores
(rho = 0.77, p<0.005).
2. Social Network Analysis
Using social network analysis, we sought to address three key questions: i) How similar or dif-ferent are the fighting, chasing, sniffing and grooming networks to each other in their global structure? ii) Are the positions of individuals in one social network similar or different to their position in other behavioral networks? iii) Can an individual’s social dominance be character-ized by individual differences in the fighting and chasing networks? Depending upon the met-ric being evaluated, frequency interaction sociomatmet-rices and/or binarized matmet-rices were used (seeMethods). These networks are visually represented inFig 4.
i) Assessment of Global Network Structure. The binarized presence/absence networks were analyzed for group structure. Densities of networks varied from 31.1% of all potential ties between individuals being present in the fighting network to 82.6% of all potential ties being present in the sniffing network (Table 4). Using a bootstrap test with 5,000 samples, all binar-ized networks deviated significantly from a theoretical density of 1 (i.e. the condition in which all individuals would be connected). z-values ranged between -6.55 and -9.45 with p<0.0002
for all networks except for the sniffing presence/absence binarized network where z = -2.25, p = 0.031. Thus, all social networks possess significant social organization (seeS2 Table). Sig-nificant dissimilarities between the densities of different networks were assessed using permu-tation paired-samples t-tests with 5,000 permupermu-tations to generate bootstrapped t-statistics and p-values. The density of the sniffing network was significantly larger than those of all other networks (all t-statistics>4.39, all p-values<0.001). The fighting (t = 3.21, p = 0.024) and
grooming (t = 1.70, p = 0.042) networks were also significantly less dense than the chasing net-work. There was no significant difference in the density of the grooming and fighting networks. Similar to the density measures, the fighting network has a very high average path length meaning that individuals are not heavily interconnected, whereas the sniffing network has a low average path length indicating high interconnectivity. Consistent with the other measures, the sniffing network had the highest reciprocity indicating more balanced interactions. The fighting network had the lowest reciprocity indicating very unbalanced relationships. Of note,
Fig 3. Temporal changes in individual Glicko Dominance Ratings.a) Fighting, b) Chasing, c) All aggression. All individuals arbitrarily begin with a 2200 rating and ratings are recalculated for each individual following a contest.
the grooming network’s reciprocity showed a trend (p = 0.062) to be significantly higher than expected by chance compared to random networks of the same size and density.
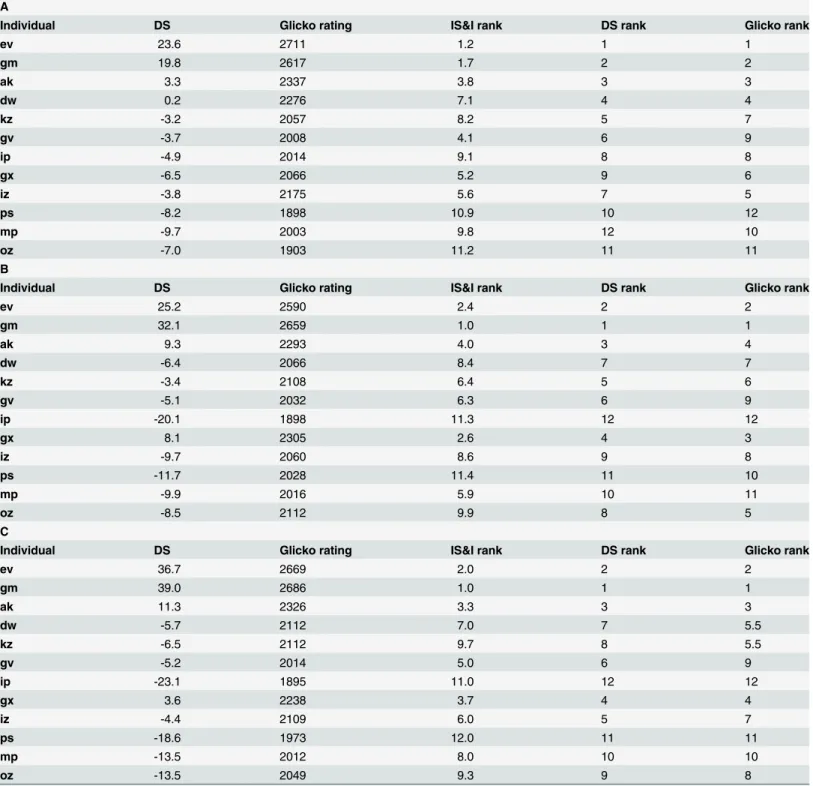
Table 2. Individual measures of social dominance for A) Fighting, B) Chasing and C) All Aggression sociomatrices.
A
Individual DS Glicko rating IS&I rank DS rank Glicko rank
ev 23.6 2711 1.2 1 1
gm 19.8 2617 1.7 2 2
ak 3.3 2337 3.8 3 3
dw 0.2 2276 7.1 4 4
kz -3.2 2057 8.2 5 7
gv -3.7 2008 4.1 6 9
ip -4.9 2014 9.1 8 8
gx -6.5 2066 5.2 9 6
iz -3.8 2175 5.6 7 5
ps -8.2 1898 10.9 10 12
mp -9.7 2003 9.8 12 10
oz -7.0 1903 11.2 11 11
B
Individual DS Glicko rating IS&I rank DS rank Glicko rank
ev 25.2 2590 2.4 2 2
gm 32.1 2659 1.0 1 1
ak 9.3 2293 4.0 3 4
dw -6.4 2066 8.4 7 7
kz -3.4 2108 6.4 5 6
gv -5.1 2032 6.3 6 9
ip -20.1 1898 11.3 12 12
gx 8.1 2305 2.6 4 3
iz -9.7 2060 8.6 9 8
ps -11.7 2028 11.4 11 10
mp -9.9 2016 5.9 10 11
oz -8.5 2112 9.9 8 5
C
Individual DS Glicko rating IS&I rank DS rank Glicko rank
ev 36.7 2669 2.0 2 2
gm 39.0 2686 1.0 1 1
ak 11.3 2326 3.3 3 3
dw -5.7 2112 7.0 7 5.5
kz -6.5 2112 9.7 8 5.5
gv -5.2 2014 5.0 6 9
ip -23.1 1895 11.0 12 12
gx 3.6 2238 3.7 4 4
iz -4.4 2109 6.0 5 7
ps -18.6 1973 12.0 11 11
mp -13.5 2012 8.0 10 10
oz -13.5 2049 9.3 9 8
(DS = David’s Score; Glicko rating =final rating calculated by Glicko rating system; I&SI rank = rank calculated using I&SI algorithm; DS rank = rank calculated using David’s Scores; Glicko rank = rank calculated usingfinal Glicko rating).
Significantly, the fighting network has very high out-degree and out-closeness network cen-tralization scores of>0.7, indicating that this network has an incredibly high concentration of
power among few individuals. The chasing network has moderately high network centraliza-tions values of 0.38–0.51 indicating also a concentration of power to relatively few individuals. However, the grooming and sniffing networks have low centralization scores of<0.2 indicating
that there is no power structure in these networks. Congruently, both the fighting (p = 0.000) and chasing (p = 0.011) networks had a maximum out-degree that was significantly greater than expected compared to 5,000 randomly generated networks of the exact same size and den-sity. Interestingly, we note that the sniffing network had a trend (p = 0.064) to have a minimum in-degree lower than expected compared to 5,000 random graphs.
ii) Comparing individuals across networks. To assess whether the patterning of individ-ual network positions were similar or different across different behavioral networks QAP cor-relation tests were performed. Each test used 5,000 permutations to obtain a bootstrapped Pearson correlation coefficient and associated p-value (S3 Table). A significant correlation was found between the fighting and chasing binary networks suggesting that an individual position in each network was associated with each other (r = 0.402, p = 0.002) but no relationship was
Table 3. Individual consistency between ranking methods.
Fighting rho Fighting-p Chasing rho Chasing p All aggression rho All aggression p
I&SI–DS 0.83 <0.005 0.87 <0.001 0.96 <0.0001
I&SI—Glicko 0.86 <0.001 0.73 0.01 0.84 <0.001
DS—Glicko 0.89 <0.0001 0.92 <0.0001 0.92 <0.0001
(DS = David's scores)
doi:10.1371/journal.pone.0134509.t003
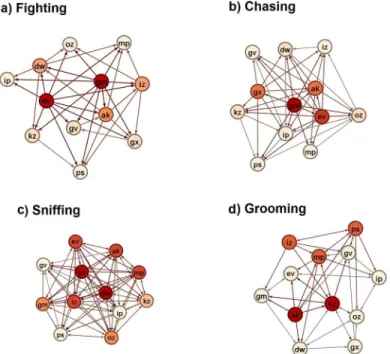
Fig 4. Visual representations of the a) fighting, b) chasing, c) sniffing and d) grooming social networks.Nodes are colored from cream to red based on out-degree. More red colors represent individuals with a relatively higher out-degree. Fighting and chasing networks are based on the win-loss binary matrices. Sniffing and grooming networks are based on the presence-absence binary matrices.
found between the fighting and grooming or sniffing networks. An individual's associations in the chasing network was also positively correlated with the sniffing network (r = .328, p<
.001). The grooming network was not significantly correlated with any other network. To examine whether the strength of existing associations between any two individuals is predictive of the strength of the same association in another network, QAP correlation tests were also performed on the fighting, chasing, sniffing and grooming frequency sociomatrices (S3 Table). The strength of ties in the fighting network was significantly correlated with the strength of ties in the chasing (r = 0.639, p<.001) and sniffing networks (r = .280 p = .001) but
not the gooming network. The strength of existing associations in the chasing, sniffing and grooming networks were all positively correlated with each other (seeS3 Table), indicating that those individuals who directed these behaviors more frequently at other individuals were also more likely to perform each of the other behaviors to those individuals more frequently than to other individuals with whom they had links.
Following [72] we also compared individual node-level network measures to assess how the patterning of individual network position correlated across networks using Spearman rank cor-relation tests (a Bonferonni adjusted p-value of 0.0167 was used as each network was compared to 3 others, e.g. fighting with chasing, sniffing, and grooming, the adjusted p-value for signifi-cance testing was 0.05/3 = 0.0167). Two clear associations were detected when examining the association between individual network metrics for different behaviors (S4 Table). Very strong relationships were found between individual out-degree (rho = 0.78, p<0.005) and
out-close-ness (rho = 0.67, p = 0.0181) scores in the fighting and chasing networks and between individ-ual in-degree (rho = 0.87, p<0.001) and in-closeness (rho = 0.82, p = 0.001) in the sniffing and
chasing networks. Thus individuals that fight many other individuals also chase many other individuals and animals that get chased more also get sniffed more. All other associations did not reach Bonferonni adjusted p-significance criteria, including all associations between indi-viduals' betweenness across networks. Interestingly, no individual network scores of individu-als in the grooming network significantly correlated with any other behavioral network.
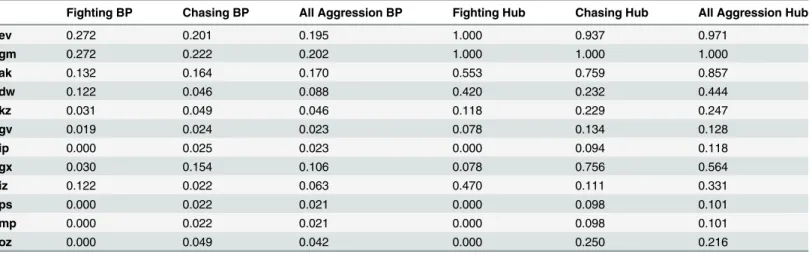
iii) Assessment of individuals' dominance within networks. Individual power scores are shown inTable 5. An individual’s Bonacich's power centrality score (rho = 0.71, p<0.01) and
hub score in the fighting and chasing networks are significantly associated with one another (rho = 0.71, p<0.01). For all three networks (fighting, chasing, all aggression), individual
Bona-cich power centrality and hub centrality scores are very tightly correlated indicating that both are reliable measures of power dominance (rhos 0.90–0.99, all p<.0001).
To examine the relationship between individual differences in dominance and network power measurements, we correlated (using Spearman tests) each individual's I&SI, David's score and Glicko ranking (Table 2) against their Bonacich's power and hub score ranking (Table 5). Even correcting for multiple comparisons, all fighting dominance rankings were highly correlated with fighting network power rankings (rho ranges 0.85–0.95, all p<.001)
and the same relationships were also observed for measures of chasing (rho ranges 0.68–0.94,
Table 4. Group level network metrics for the fighting, chasing, sniffing and grooming presence/ absence sociomatrices.
Density Av. Path length Reciprocity Out-degree centralization Out-closeness centralization
Fighting 0.311 5.432 0.146 0.752 0.717
Chasing 0.530 1.545 0.514 0.512 0.376
Sniffing 0.826 1.174 0.862 0.190 0.164
Grooming 0.364 1.773 0.500 0.198 0.137
all p<.02). There is therefore a very high correspondence between traditional metrics of
domi-nance and network power rankings (seeS6 Fig).
3. Neurobiology of individual differences in social dominance and
network position
The relationship between the level CRF mRNA in the medial amygdala, central amygdala, mPOA and hippocampus, BDNF and GR mRNA expression in the hippocampus and various measures of fighting dominance rank were examined. The PCAs conducted on both the fight-ing and chasfight-ing variables found that component 1 (‘dominance’) accounted for 87% of total variance. All variables loaded onto component one with eigenvalues>0.9 with the exception of
in-closeness that loaded with an eigenvalue of -0.77. We therefore also correlated individual component scores against each gene. Results of multiple spearman's rank correlation tests can be found inS5 Table. As there is a high degree of inter-correlation between the dominance measures we present all results with individual rho and p-values. In the amygdala, we found very highly significant correlations between level of CRF mRNA in the medial and central nuclei and fighting dominance with more highly ranked individuals having relatively higher levels of CRF mRNA (S5 Table). The strongest of these observed relationships were associa-tions with social network measures of power (Fig 5). Interestingly, although the associations are in the same direction, medial amygdala and hypothalamic CRF expression was only cantly associated with dominance in the chasing network on a few ranking metrics. No signifi-cant relationship was found between fighting dominance and relative hippocampal CRF mRNA. However, relative hippocampal GR and BDNF expression is significantly higher in more dominant individuals of both the fighting and chasing networks. Further, sniffing and grooming network measures of out-Closeness and in-Closeness do not relate to any measure of gene expression in any brain region (S5 Table.).
Discussion
Here we show that by acquiring longitudinal observational data on a group of laboratory mice living in a large, complex environment, that it is possible to acquire a detailed understanding of the social behavior of individuals, the temporal patterning of dyadic social relationships and
Table 5. Individual differences in a) Bonacich’s Power Centrality and b) Kleinberg’s Hub Centrality.
Fighting BP Chasing BP All Aggression BP Fighting Hub Chasing Hub All Aggression Hub
ev 0.272 0.201 0.195 1.000 0.937 0.971
gm 0.272 0.222 0.202 1.000 1.000 1.000
ak 0.132 0.164 0.170 0.553 0.759 0.857
dw 0.122 0.046 0.088 0.420 0.232 0.444
kz 0.031 0.049 0.046 0.118 0.229 0.247
gv 0.019 0.024 0.023 0.078 0.134 0.128
ip 0.000 0.025 0.023 0.000 0.094 0.118
gx 0.030 0.154 0.106 0.078 0.756 0.564
iz 0.122 0.022 0.063 0.470 0.111 0.331
ps 0.000 0.022 0.021 0.000 0.098 0.101
mp 0.000 0.022 0.021 0.000 0.098 0.101
oz 0.000 0.049 0.042 0.000 0.250 0.216
(Calculated fromfighting, chasing and all aggression win/loss sociomatrices.)
the overall group social structure. This is achieved through applying statistical methodologies that are routine in field work in primatology and behavioral ecology, and by also using recently developed statistical techniques such as social network analysis and the Glicko pairwise com-parison model. In particular, we demonstrate that inbred CD1 male mice have a highly ordered social structure with individual mice having non-random, directionally consistent, social rela-tionships. We demonstrate that all individuals recognize their niche in the social group and are capable of behaving appropriately towards other individuals.
Mice form a stable dominance hierarchy
All individual mice were observed to be aggressive at least once and to receive aggression at least once, but there was a great deal of inter-individual variability. The directionality of these aggressive behaviors were not random and we found strong evidence for a linear dominance hierarchy when considering fighting behavior, chasing behavior or both aggressive behaviors combined (Table 1). Applying De Vries’method for calculating dominance linearity to fre-quency interaction sociomatrices, all modified Landau values (h’) were above 0.62, with all p-values being<0.001 indicating strong linearity. We also found that dominance hierarchies
based on fighting and chasing had significant steepness, again demonstrating that the agonistic relationships of these mice were organized. Directional consistency was also very high, with 71% of chasing and 93% of fighting interactions being in the direction of dominant to subordi-nate individuals. This is suggestive that the fighting behavior exhibited by male mice is a stronger enforcer of dominance relationships than chasing behavior, which may occur in the direction of subordinate to dominant.
Our findings were strongly supported by evaluation of global metrics of social networks based upon binarized sociomatrices of each behavior (Table 4). The fighting network had extremely low density and reciprocity, and very high average path lengths and out-degree and out-closeness centralization coefficients. Essentially, this describes a social network that has low cohesion, connectedness and compactness, with mostly unidirectional ties between indi-viduals (meaning that fighting behaviors are typically directed), with power and influence being centralized to relatively few individuals. The chasing network showed a similar pattern to the fighting network but not quite as extreme. For instance, the reciprocity and average path length of the chasing network was very similar to the grooming network, but the chasing net-work did possess moderately high out-degree and out-closeness centralization coefficients indicative of power being restricted to relatively few individuals (though more individuals than the fighting network). Consistent with these findings, we also demonstrated that both the
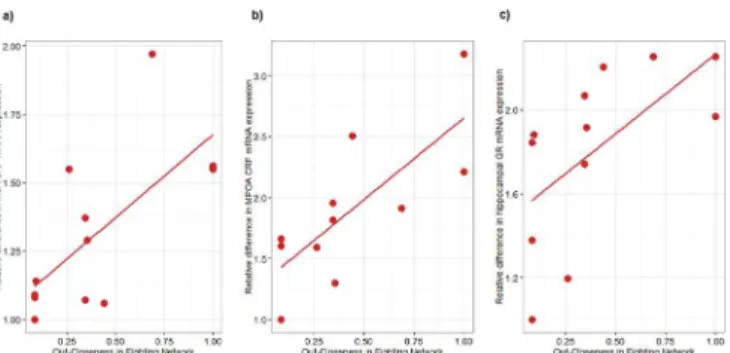
Fig 5. Association between individual differences in Out-Closeness Centrality in the fighting network and relative gene expression.a) CRF mRNA in the Medial Amygdala, b) CRF mRNA in the mPOA, c) GR mRNA in the hippocampus.
fighting and chasing networks possessed individuals whose maximum out-degree (the highest number of individuals in the group that any one individual attacked or chased) was signifi-cantly higher than would be expected for networks of their given size and density, further dem-onstrating the hierarchical nature of these mice agonistic interactions.
Given the organized hierarchical structure of the fighting and chasing dominance data, we were also able to successfully rate and rank individuals and found a high degree in stability of rank order of individuals over time (Table 2). We also introduce a novel method of evaluating the relative rating and rank of an individual’s dominance over time using the Glicko rating sys-tem [56]. When considering the final Glicko ratings and deviations (Fig 3), it appears that there are broadly two categories of dominant and two categories of subordinate mice. The two most dominant mice have the highest ratings followed by two sub-dominant individuals. Two individuals are the most subordinate with the remaining mice having intermediate rankings. This is somewhat similar to findings of hybrid F1-C57129S male mice housed in groups of four who can be classified as dominant, active subordinate, passive subordinate, or submissive based on agonistic interactions [73].
We also introduce two individual level social network metrics that can be utilized to determine the power of an individual. In our group of mice, we found a statistically very strong relationship between Bonacich’s Power Centrality (which considers individuals who direct behavior towards others who do have relatively fewer connections to be more powerful) and Kleinberg’s Hub Centrality (which considers individuals who have many outgoing ties that connect to individuals with many incoming ties as being more powerful) [64,65]. We also show that these scores were highly correlated with more traditional methodologies of ranking individuals such as I&SI and David Score’s as well as Glicko rating for agonistic behaviors (Table 3). We suggest that these network metrics could potentially be very useful additional tools in the study of individual variation of social dominance, as well as in aiding in identifying the social roles of individuals, which is a key aim of network analysis [74,75].
Importantly, it appears that all male mice in this large social group are capable of determin-ing their social rank and behavdetermin-ing appropriately (more aggressively towards subordinates, and more defensively towards dominants). Our findings contrast somewhat with the few previous attempts at investigating dominance structures in mice that typically report that there exists one despotic dominant mouse in a social group with all other individuals being subordinate. There are several reasons for this. Firstly, the ancestral species of mice have extremely flexible social systems meaning that under varied ecological and social conditions that different hierar-chical styles of social groups may emerge from despotic to completely linear [5,71,76–78]. In the laboratory, differences in housing conditions or experimental design may change social structure. For instance, despotic dominance appears to be more common among small groups of fewer than 5 or 6 individuals living in standard sized cages [9,79–82], whereas if mice are given more space, it has been reported that groups will start to form some form of social hierar-chy with previously subordinate animals starting to dominate some other individuals [10,83]. Differences may of course be also due to strain differences in aggressive and subordinate behav-iors, which are known to exist [9,84], though we purposefully chose CD1 mice due to their common use in social behavior tests and willingness to engage in agonistic interactions [41,85].
Relationship between agonistic and other social behaviors
Sniffing. In many studies of dyadic interactions, the time spent socially investigating (sniffing) another animal is most often utilized as a proxy for the‘sociability’of that animal [1]. Our data suggest that in a large group of male mice, sniffing between individuals occurs very frequently and appears to be related to chasing behavior. The high levels of mutual sniffing interactions and interconnectivity of the sniffing network was evidenced by the high density, reciprocity and low average path length of the network (Table 4). Nevertheless, the network density was still significantly less than a theoretical density of 1 indicating the presence of highly differentiated social relationships and the reciprocity was not higher than expected by chance for a network of its given size and density (S2 Table). Several findings indicate that the organization of sniffing within the social group was somewhat related to patterns of social dominance. Firstly, the sniffing network had a minimum in-degree of 5, which was lower than expected compared to random graphs of the same size and density (p = 0.06). This suggests that the most dominant individuals are getting approached and sniffed less than would be expected by chance. Secondly, using QAP correlations, both the presence/absence and the strength of a network tie were highly positively associated between the chasing and sniffing net-works and the strength of associations between the fighting and sniffing network were also associated (S3 Table). Finally, we also found that the individual in-degree and in-closeness net-work scores were highly correlated between chasing and sniffing netnet-works, indicating that ani-mals who were chased by many different individuals are also those who are likely to get sniffed by many different social partners (S4 Table).
Significantly, even though chasing and fighting networks are closely related on multiple measures, there was no association in terms of the presence of ties between the sniffing and fighting networks. This is again suggestive of subtle differences between fighting and chasing in how dominance is exerted in the social group. From this data, we would concluded that social investigation in the form of sniffing may actually be a dominance related behavior with subor-dinate mice avoiding sniffing dominant males, at least when occurring between males who are familiar to one another in a stable social group, in contrast to how it is often used to determine the general‘sociability’of mice. Some support for this comes from studies of scent marking in mice, as subordinate mice are known to avoid investigating the urine scent marks of more dominant individuals [86,87].
Allogrooming
reciprocity of grooming ties to be higher than would be expected by chance, suggesting that perhaps this behavior may serve some mutually affiliative function between pairs of mice. One other study that examined the direction of allogrooming interactions in laboratory mice reported that for various inbred strains the most common grooming interactions were between subordinates, followed by subordinates grooming dominants and lastly dominants grooming other dominants [9]. One interpretation of our and these data may be that allogrooming most often provides social buffering and support between reciprocally subordinate mice, and when occurring reciprocally between dominant and subordinate mice may serve to maintain the dominance hierarchy but have opposite functions (to maintain dominance and to ameliorate aggression respectively).
Dominance rank and brain gene expression
We found a very strong relationship between relative individual mRNA levels of CRF in the medial amygdala, central amygdala and MPOA with fighting dominance rank and network measures of power and out-closeness (S5 TableandFig 5). More dominant individuals have relatively higher mRNA expression of CRF. Medial amygdala and hypothalamic CRF mRNA expression was also associated with dominance and power in the chasing network but less strongly than the fighting network. No relationship between hippocampal CRF and fighting or chasing dominance or network measures of power were found. These relationships appear to be specific to dominance as no relationship was observed between CRF expression and groom-ing or sniffgroom-ing network metrics.
There is strong evidence for the coordinated involvement of the MeA, CeA and mPOA in the regulation of social behaviors relevant to social dominance [21,25,27]. The MeA, which receives inputs from the accessory olfactory system and main olfactory system via the cortical nucleus of the amygdala, projects to multiple brain regions implicated in the regulation of social behavior [92]. The mPOA and other medial hypothalamic nuclei receive direct innerva-tions from the anteroventral and posterodorsal divisions of the MeA with relevance for the modulation of defensive and aggressive behavior. Both the MeA and mPOA show increases in cFos expression in both aggressive and subordinate individuals following dyadic resident-intruder encounters [35,93]. Though the exact role of the mPOA during these agonistic social encounters remains to be elucidated, it is thought to modulate an individual’s arousal in response to socially relevant cues [35]. Further, the medial and capsular subdivisions of the CeA, a nucleus that is critical for the coordination of sensory experience, social learning and memory and emotional behaviors [29], receives substantial innervations from the MeA [94]. Descending projections from the medial division of the CeA innervate the hypothalamus pro-viding an additional association between the MeA and hypothalamus [95]. Unsurprisingly, lesions of the MeA lead to multiple deficits in social memory as well as the expression of and learning about aggressive and subordinate behaviors demonstrating the key importance of this nucleus as a critical regulator of social dominance and subordination behaviors [31,96,97]. More recently, discrete glutametergic and GABAergic neuronal populations in the MeA have been reported to regulate social aggression [27].
aggression and social investigation [37], whilst intra-amygdalar administration with CRF-R1 antagonists inhibits the induction of submissive behaviors in mice when given immediately after social defeat stress [102]. Indeed, there is a lot of support for the role of CRF being an important facilitator for the formation of emotional memories particularly those related to social avoidance [103–105]. We suggest that our findings may support a hypothesis that those individuals with higher CRF expression in the amygdala (MeA and CeA) as well as the mPOA achieve higher dominance rank through CRF’s actions, elevating levels of aggression and improving the abilities of mice to detect and remember social chemosensory information such that they are more likely to exhibit appropriate subordinate or dominant behavior towards other individuals. Determining if this may occur through the direct actions of CRF on CRF1R receptors or the CRF-binding-protein (CRFBP) which occur at high levels in the amygdala and hypothalamus [106,107], or though the interaction of CRF expressing neurons with other neu-roendocrine systems such as serotonergic, dopaminergic or noradrenergic neurons [39] will form the basis of future work.
We found that the relative hippocampal expression of BDNF mRNA was significantly related to all metrics of dominance rank and individual network power with more dominant animals having higher BDNF expression (S5 Table). The strong association between BDNF and chasing dominance may be related to increased territoriality of more dominant mice. More dominant male mice living in large groups are known to increase their activity levels compared to prior to group formation [81] and exhibit territorial patrolling behavior [10]. A consistent finding is that physical activity increases the expression of hippocampal BDNF, neural plasticity and cognition [108]. We hypothesize that the increased physical activity by more dominant chasing animals may have driven the observed BDNF expression differences. Potentially, the neural plasticity induced by increased territorial dominance may promote the required neural plasticity and improved spatial memory required of patrolling dominant ani-mals. Interestingly, one recent study reports that hippocampal neurogenesis was related to the territoriality and roaming entropy of mice living in large groups [11]. Several studies also indi-cate that hippocampal BDNF may promote learning about an individual’s social role following aggressive encounters [41,109], particularly in more dominant individuals [43]. Taken together with our data, it could be hypothesized that individual mice who are able to ascend a domi-nance hierarchy do so in part because of their elevated hippocampal BDNF levels.
It is also possible that individual differences in hippocampal BDNF expression may be related to variations in social stress experienced, as it is well known that mice that experience social defeat or other forms of social stress show reductions in hippocampal BDNF levels [110,111]. However, this does not explain why the observed relationship between BDNF and chasing dominance was higher than that between fighting dominance. Further, the relationship between individual BDNF expression levels and in- and out-closeness were equivalent. If the differences in BDNF expression were specifically related to differences in social stress experi-enced, it would be expected that in-closeness would have a stronger relationship to gene expression levels than out-closeness.
dominant mice tend to have lower baseline CORT levels than subordinates amongst those liv-ing in small groups (fewer than 5) [114] and an attenuated stress response in response to physi-cal stressors [115], though others do also report that these baseline differences may disappear in mice that have lived together for periods of several weeks [116], and may even be higher in dominant mice living in enriched conditions [117].
Conclusions
The study of laboratory mice social behavior has proliferated recently due to the increased desire to develop animal models of human mental disease [1,19]. Most of our understanding of the neurobiology of social behavior however still relies on dyadic social interactions. We and others [11–14] have proposed that there is a growing need to embrace and explore the com-plexity social behavior at individual, relationships and group levels in more ecologically and ethologically relevant paradigms. Here, we have shown that we are able to study the dominance interactions of male mice using traditional and novel statistical approaches including social network analysis. We have demonstrated that large groups of male mice form fighting and chasing dominance hierarchies with individual mice having a definitive rank order, and that individual differences in rank and measures of power are associated with changes in MeA, CeA and mPOA CRF mRNA expression and hippocampal BDNF and GR expression. Although we are unable in the current study to determine whether these individual differences in gene expression are causally responsible for the divergence in social ranks or are a consequence of these changes, we aim to evaluate this in future work by determining if it is possible to alter dominance network position and structure via targeting gene expression of individual mice in a brain-region specific manner.
Supporting Information
S1 Fig. The distribution of final Glicko ratings +/- deviations of each of 12 mice as calcu-lated using a range of constant values (cvals) of 1 to 20.
(TIF)
S2 Fig. Presence/absence sociomatrices.a) Fighting, b) Chasing, c) All aggression, d) Sniffing, e) Grooming. A‘1’indicates that individuals in rows directed that behavior to individuals in columns at least once during the observation period. A‘0’indicates that that behavior was never observed to have occurred directed from individuals in rows to individuals in columns. (TIF)
S3 Fig. Win/loss sociomatrices.a) Fighting, b) Chasing, c) All aggression. A‘1’indicates that individuals in rows directed each particular behavior more frequently to individuals in columns than they received the same behavior from individuals in columns.
(TIF)
S4 Fig. Results of Permutation Test to test for significance of linearity.The observed Landau’s modified h’value of dominance hierarchy linearity for each agonistic sociomatrix (fighting, chasing, all aggression) is compared against the values obtained after 10,000 random-izations of each sociomatrix. The dashed line represents the observed h’value. (p<0.001).
(TIF)
S5 Fig. High individual consistency in dominance rank based on Glicko ratings for fighting data using a range of c-values (1–20).
S6 Fig. Consistency of Dominance Methods.Relationship between Kleinberg’s Hub Central-ity calculated from the fighting win/loss sociomatrix and a) I&SI rank, b) David’s Scores, c) Final Glicko Rating.
(TIF)
S1 Supplementary Codes and Data.–All raw data and R scripts used in the data analysis. (ZIP)
S1 Table. The ethogram used for behavioral observations.
(DOCX)
S2 Table. Densities of individual behavior networks based on presence/absence socioma-trices.All networks are significantly different from possessing a density of 1 indicating specific-ity of social ties in the network.
(DOCX)
S3 Table. Pearson correlations between individual behavior networks calculated using QAP.For a) presence/absence of a tie, b) strength of a tie. (p<0.001,p<0.01,p<0.05, $p<.1).
(DOCX)
S4 Table. Individual differences in individual level network metrics calculated from fight-ing, chasfight-ing, sniffing and grooming presence/absence sociomatrices.
(DOCX)
S5 Table. Associations between relative gene expression and dominance measures.
(DOCX)
Acknowledgments
Our thanks to Cait Williamson and Joe LeSauter for assistance with animal husbandry and for their critical comments on earlier drafts of the manuscript. Also to the members of the Curley Lab for their help in animal observations.
Author Contributions
Conceived and designed the experiments: BF JC. Performed the experiments: NS BF SL JC. Analyzed the data: NS BF JC. Contributed reagents/materials/analysis tools: JC. Wrote the paper: NS BF JC.
References
1. Kas MJ, Glennon JC, Buitelaar J, Ey E, Biemans B, Crawley J, et al. (2014) Assessing behavioural and cognitive domains of autism spectrum disorders in rodents: current status and future perspec-tives. Psychopharmacology (Berl) 231: 1125–1146.
2. Brodkin ES (2007) BALB/c mice: low sociability and other phenotypes that may be relevant to autism. Behav Brain Res 176: 53–65. PMID:16890300
3. Frazer KA, Eskin E, Kang HM, Bogue MA, Hinds DA, Beilharz EJ, et al. (2007) A sequence-based var-iation map of 8.27 million SNPs in inbred mouse strains. Nature 448: 1050–1053. PMID:17660834 4. Berry RJ (1970) The Natural History of the House Mouse. Field Studies 3: 219–262.
5. Crowcroft P (1955) Territorality in wild house mice,Mus musculusL. J Mammal: 299–301.
6. Gray SJ, Jensen SP, Hurst JL (2000) Structural complexity of territories: preference, use of space and defence in commensal house mice, Mus domesticus. Anim Behav 60: 765–772. PMID:11124874 7. Perony N, Tessone CJ, Konig B, Schweitzer F (2012) How random is social behaviour? Disentangling
8. Mackintosh JH (1970) Territory formation by laboratory mice. Anim Behav 18: 177–183.
9. Mondragon R, Mayagoitia L, Lopez-Lujan A, Diaz JL (1987) Social structure features in three inbred strains of mice, C57Bl/6J, Balb/cj, and NIH: a comparative study. Behav Neural Biol 47: 384–391. PMID:3606534
10. Poole TB, Morgan HD (1976) Aggressive behaviour of male mice (Mus musculus) towards familiar and unfamiliar opponents. Anim Behav 23: 470–479.
11. Freund J, Brandmaier AM, Lewejohann L, Kirste I, Kritzler M, Kruger A, et al. (2013) Emergence of individuality in genetically identical mice. Science 340: 756–759. doi:10.1126/science.1235294 PMID:23661762
12. Ohayon S, Avni O, Taylor AL, Perona P, Roian Egnor SE (2013) Automated multi-day tracking of marked mice for the analysis of social behaviour. J Neurosci Methods 219: 10–19. doi:10.1016/j. jneumeth.2013.05.013PMID:23810825
13. Shemesh Y, Sztainberg Y, Forkosh O, Shlapobersky T, Chen A, Schneidman E (2013) High-order social interactions in groups of mice. Elife 2: e00759. doi:10.7554/eLife.00759PMID:24015357 14. Weissbrod A, Shapiro A, Vasserman G, Edry L, Dayan M, Yitzhaky A, et al. (2013) Automated
long-term tracking and social behavioural phenotyping of animal colonies within a semi-natural environ-ment. Nat Commun 4: 2018. doi:10.1038/ncomms3018PMID:23771126
15. Hinde RA (1973) Interactions, Relationships and Social Structure. Man 11: 1–17.
16. Wey T, Blumstein DT, Shen W, Jordan F (2008) Social network analysis of animal behaviour: a prom-ising tool for the study of sociality. Anim Behav 75: 333–344.
17. Croft DP, Madden JR, Franks DW, James R (2011) Hypothesis testing in animal social networks. Trends Ecol Evol 26: 502–507. doi:10.1016/j.tree.2011.05.012PMID:21715042
18. Sueur C, Jacobs A, Amblard F, Petit O, King AJ (2011) How can social network analysis improve the study of primate behavior? Am J Primatol 73: 703–719. doi:10.1002/ajp.20915PMID:21181869 19. Donaldson ZR, Hen R (2015) From Psychiatric Disorders to Animal Models: A Bidirectional and
Dimensional Approach. Biol Psychiatry 77: 15–21. doi:10.1016/j.biopsych.2014.02.004PMID: 24650688
20. Bauman MD, Lavenex P, Mason WA, Capitanio JP, Amaral DG (2004) The development of social behavior following neonatal amygdala lesions in rhesus monkeys. J Cogn Neurosci 16: 1388–1411. PMID:15509386
21. Bickart KC, Dickerson BC, Barrett LF (2014) The amygdala as a hub in brain networks that support social life. Neuropsychologia 63: 235–248. doi:10.1016/j.neuropsychologia.2014.08.013PMID: 25152530
22. Kumaran D, Melo HL, Duzel E (2012) The emergence and representation of knowledge about social and nonsocial hierarchies. Neuron 76: 653–666. doi:10.1016/j.neuron.2012.09.035PMID: 23141075
23. Machado CJ, Bachevalier J (2006) The impact of selective amygdala, orbital frontal cortex, or hippo-campal formation lesions on established social relationships in rhesus monkeys (Macaca mulatta). Behav Neurosci 120: 761–786. PMID:16893284
24. Maruska KP, Zhang A, Neboori A, Fernald RD (2013) Social opportunity causes rapid transcriptional changes in the social behaviour network of the brain in an African cichlid fish. J Neuroendocrinol 25: 145–157. doi:10.1111/j.1365-2826.2012.02382.xPMID:22958303
25. Noonan MP, Sallet J, Mars RB, Neubert FX, O'Reilly JX, Andersson JL, et al. (2014) A neural circuit covarying with social hierarchy in macaques. PLoS Biol 12: e1001940. doi:10.1371/journal.pbio. 1001940PMID:25180883
26. Rosvold HE, Mirsky AF, Pribram KH (1954) Influence of amygdalectomy on social behavior in mon-keys. J Comp Physiol Psychol 47: 173–178. PMID:13163250
27. Hong W, Kim DW, Anderson DJ (2014) Antagonistic control of social versus repetitive self-grooming behaviors by separable amygdala neuronal subsets. Cell 158: 1348–1361. doi:10.1016/j.cell.2014. 07.049PMID:25215491
28. Bolhuis JJ, Fitzgerald RE, Dijk DJ, Koolhaas JM (1984) The corticomedial amygdala and learning in an agonistic situation in the rat. Physiol Behav 32: 575–579. PMID:6541350
29. Davis M, Walker DL, Miles L, Grillon C (2010) Phasic vs sustained fear in rats and humans: role of the extended amygdala in fear vs anxiety. Neuropsychopharmacology 35: 105–135. doi:10.1038/npp. 2009.109PMID:19693004