Coupling between Theta Oscillations and
Cognitive Control Network during
Cross-Modal Visual and Auditory Attention:
Supramodal vs Modality-Specific
Mechanisms
Wuyi Wang1*, Shivakumar Viswanathan2, Taraz Lee1, Scott T. Grafton1*
1Institute for Collaborative Biotechnologies and the Department of Psychological & Brain Sciences, University of California Santa Barbara, Santa Barbara, California, United States of America,2Department of Neurology, University Hospital of Cologne, Cologne, Germany
*[email protected](SG);[email protected](WW)
Abstract
Cortical theta band oscillations (4–8 Hz) in EEG signals have been shown to be important for a variety of different cognitive control operations in visual attention paradigms. However the synchronization source of these signals as defined by fMRI BOLD activity and the extent to which theta oscillations play a role in multimodal attention remains unknown. Here we investigated the extent to which cross-modal visual and auditory attention impacts theta oscillations. Using a simultaneous EEG-fMRI paradigm, healthy human participants per-formed an attentional vigilance task with six cross-modal conditions using naturalistic sti-muli. To assess supramodal mechanisms, modulation of theta oscillation amplitude for attention to either visual or auditory stimuli was correlated with BOLD activity by conjunction analysis. Negative correlation was localized to cortical regions associated with the default mode network and positively with ventral premotor areas. Modality-associated attention to visual stimuli was marked by a positive correlation of theta and BOLD activity in fronto-parie-tal area that was not observed in the auditory condition. A positive correlation of theta and BOLD activity was observed in auditory cortex, while a negative correlation of theta and BOLD activity was observed in visual cortex during auditory attention. The data support a supramodal interaction of theta activity with of DMN function, and modality-associated pro-cesses within fronto-parietal networks related to top-down theta related cognitive control in cross-modal visual attention. On the other hand, in sensory cortices there are opposing effects of theta activity during cross-modal auditory attention.
a11111
OPEN ACCESS
Citation:Wang W, Viswanathan S, Lee T, Grafton ST (2016) Coupling between Theta Oscillations and Cognitive Control Network during Cross-Modal Visual and Auditory Attention: Supramodal vs Modality-Specific Mechanisms. PLoS ONE 11(7): e0158465. doi:10.1371/journal.pone.0158465
Editor:Suliann Ben Hamed, Centre de Neuroscience Cognitive, FRANCE
Received:March 11, 2016
Accepted:June 16, 2016
Published:July 8, 2016
Copyright:© 2016 Wang et al. This is an open access article distributed under the terms of the Creative Commons Attribution License, which permits unrestricted use, distribution, and reproduction in any medium, provided the original author and source are credited.
Data Availability Statement:fMRI t-maps data have been uploaded tohttp://neurovault.org/collections/ 1486.
Funding:This work was supported by the Institute for Collaborative Biotechnologies through contract no. W911NF-09-D-0001 from the U.S. Army Research Office. The funder had no role in study design, data collection and analysis, decision to publish, or preparation of the manuscript.
Introduction
Our environment exposes us to a constant barrage of independent simultaneous sensory events across multiple sensing modalities. In order to make sense of this multitude of information, it is often necessary to ignore irrelevant sensory information from particular sensory modalities or spatial locations while selectively enhancing the processing of other streams of information
through the use of cross-modal attention control [1,2]. Achieving cross-modal attention
con-trol requires both modality-specific mechanisms as well as general top-down (i.e., supramodal)
cognitive control [3,4]. A fundamental question is whether top-down mechanisms are required
to enhance processing in specific sensory modalities and if these can be demonstrated by
electrophysiological means in humans [5,6]. Cross-modal visual and auditory attention and
their underlying neural characteristics have been extensively studied. Recent studies show that the modulation of both amplitude and phase of EEG oscillation could be important
mecha-nisms to enable cross-modal interactions [7–9]. In addition, a recent EEG and fMRI study
showed that when there is competition between visual and auditory stimuli, requiring active endogenous control of attention, there is modulation of activity within the sensory cortices,
sensorimotor areas and the default mode network (DMN) [10].
It has been hypothesized that cross-modal multisensory control, along with several other forms of cognitive control rely on underlying brain dynamics that are reflected in EEG theta
oscillations (4–8 Hz). This low-frequency oscillation, commonly thought to emanate from
frontal cortex, is a strong candidate for organizing activities across widely separated cortical
regions during cognitive processes [11–13]. Recent work shows that theta oscillations have an
important role in top-down control [14,15]. Furthermore, source localization of theta
oscilla-tions were found to be situated broadly within regions associated with cognitive control includ-ing the frontal cinclud-ingulate cortex (CC) as well as motor areas, sensory cortex, and the basal
ganglia (BG)[11]. Based on these prior studies, we hypothesized that theta modulation would
be important for supramodal control of attention. Several studies have proposed that the underlying neural activity producing frontal theta oscillations can facilitate or inhibit other
regions by distal synchronization in the theta band [11,16]. These putative local-distal
interac-tions are a challenge to identify from EEG data alone. An alternative approach that we adopt here is to treat the magnitude of EEG theta oscillation as a regressor that can be correlated with simultaneously recorded fMRI BOLD activity. To do this EEG oscillations in a pre-defined fre-quency band were derived over short blocks of similar trials, (although it is also possible to
adopt this approach on a trial by trial basis for suitable experimental designs) [17–21]. This
allows for an identification of putative correlates of EEG oscillations assessed over the whole brain. Taking this approach, a previous study showed that BOLD activity within the medial
prefrontal and temporal-parietal cortices correlated with theta band amplitude [22]. In another
study, there was a negative correlation between frontal theta power and BOLD in DMN during
working memory maintenance [19]. In this light, it is possible that theta oscillations play a role
in maintaining task performance or possibly limit a switch of cognition to the DMN, which is
known to be involved in stimulus independent thought [23].
We adopted a mixed experimental design with cross-modal visual and auditory stimuli
analogous to those used previously in the literature [1,24]. Participants were simultaneously
As noted above, source localization has linked theta oscillations to the medial frontal cortex
and thus, is thought to be related to networks involved in cognitive control [11]. In this study,
we extend this view by testing for interactions between theta modulation (measured at Fz and Cz electrodes, overlying medial frontal cortex) and brain activity, as measured by fMRI voxel-wise BOLD activity. If theta power influences a functional system, there should be a correlation
between theta amplitude and regional BOLD in that system [17,25]. With our approach, we
can assess two potential relationships between theta amplitude and BOLD: a. Supramodal
net-works—These are areas of significant correlation between theta and BOLD for visual, auditory,
and critically, the conjunction of visual and auditory selective attention. That is, no matter
what the modality, the supramodal network is engaged. b. Modality specific networks—These
are brain areas of significant theta-BOLD correlation that are significant for auditory or visual processing alone. We note that this is not the same as directly comparing task related activity during the two modalities of attention, which gives an indication of the effect of cross-modal attention on sensory processing. Rather, it is the differential influence of theta related activity with underlying circuits supporting either auditory or visual attention.
Materials and Methods
Ethical Statement
All subjects provided informed written consent prior to experimental sessions, all procedures were approved by the Human Subject Committee, Office of Research, University of California Santa Barbara. All participants were paid for participating in the experiment.
Subjects
We collected simultaneous EEG-fMRI and behavioral data from 17 right-handed healthy adult
subjects aged 18–26, (7 males) recruited from the local community. Two participants were
excluded from further analysis due to unreliable recordings of behavioral data leaving a final sample of 15 participants. All subjects had normal or adjusted-to-normal vision, and no history of psychiatric disorders and neurological diseases.
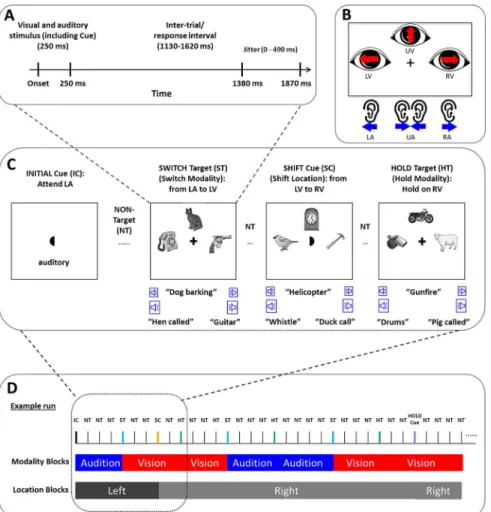
Stimuli, Task and Experiment Structure
Subjects were required to detect specific visual or simultaneously presented auditory stimuli. The visual stimuli consisted of 22 pictures of different objects selected from the Snodgrass and
Vanderwart set [26]. The pictures included animals, vehicles, instruments, weapons, and tools.
All the pictures were converted to grayscale, and scaled to be of the same size and luminance. For each trial, three different stimuli were simultaneously displayed at three locations on the
computer monitor (i.e. left, right and up) surrounding a central fixation cross (SeeFig 1C). On
a subset of trials (see below), at trial onset the central fixation cross was briefly replaced with
one of three“crescent moon”shaped cues. The curved side of the moon indicated the
appropri-ate spatial direction of attention (left, right or up) to use for all subsequent trials. Both the visual targets and occasional moon cues were only presented for 250 ms.
A set of 22 auditory stimuli that matched the identity of the visual stimuli were obtained
from a free sound website (www.freesound.org). The original sound files were edited to have
the same sampling rate and to be exactly 250 msec in duration. For each trial subjects were pre-sented with three auditory stimuli: One for the left ear, one for the right ear and another in both ears. The stimulus presented to both ears was spatially perceived to be in the midline in
auditory stimuli were adjusted such that the intensity of a stimulus presented to both ears was 70% of the intensity of a stimulus in one ear.
Participants were asked to detect either of two targets (a chicken or a sheep, counterbal-anced across participants) presented in the attended sensory modality (auditory or visual) and in one of the three attended spatial positions (left, right or up). The subject was required to maintain attention in one sensory modality or the other until a target was detected. Similarly, they were required to attend to a single spatial location until a visual moon cue at fixation indi-cated a change. One of the two targets (chicken/sheep) indiindi-cated that the subject should con-tinue to look for targets in the currently attended modality (hold trial). The other target indicated that subjects should switch their focus of attention to the other sensory modality (switch trial). To monitor performance, participants were asked to press a button with the right hand whenever they detected either type of target and to withhold button pressing for all other stimuli. Reaction Time (RT) was defined as the time between target onset and the button
Fig 1. The experimental paradigm.(A) The timing of one trial. (B) On any given trial, the subject was relying on one of six possible states of covert attention. These corresponded to a visual (upper panel) or auditory focus of attention (lower panel). In addition, subjects focused attention to the left, right or upward perceptual space. (C) A structural diagram showing that three stimuli each are presented in the visual and auditory modalities while the subjects also maintain spatial attention to any of three locations. Examples of targets indicating a switch or hold between sensory modalities or moon cues indicating a shift in spatial attention are also shown. (D) An example of a run and the independent blocking structure for object and spatial attention. The individual blocks of the two attended sensory modalities (visual and auditory conditions) as a function of spatial location were analyzed in both EEG and fMRI data analysis.
response, accuracy was defined as the ratio between correct response trials and all trials, and all other button presses were coded as false alarms (FA). The instructions for directing spatial attention, the central visual moon cues, were presented in random order, and timed to be inde-pendent of targets. Thus, for any given trial there were six possible cross-modal attentional states for each subject: Left Visual (LV), Left Auditory (LA), Upper Visual (UV), Upper
Audi-tory (UA), Right Visual (RV) and Right AudiAudi-tory (RA), as shown inFig 1B.
The experiment involved two sessions on different days. There was a half-hour training ses-sion on the first sesses-sion, followed by the main experiment on the second sesses-sion in the fMRI scanner. Both sessions were completed within 3 days of each other. During the training session, participants were first familiarized with all the auditory and visual stimuli that would be pre-sented in the task; and trained to identify and name the target stimuli. Participants practiced the task until they were able to perform the task with greater than 90% accuracy. All partici-pants were prepared for EEG and then positioned in the MRI scanner. All visual stimuli were back-projected into the scanner bore, viewed by a coil-mounted mirror. All auditory stimuli were delivered by an MRI-compatible headphone (3M Peltor Optime l H510A Headband Ear Muffs). At the beginning of each functional MRI run, a prompt was displayed that indicated which of the two modalities (auditory or visual) the participants should attend to and what spa-tial location to attend to for at the outset of that run. Participants were instructed to maintain eye gaze to the central fixation cross or moon throughout each run. They were verbally reminded to only monitor the relevant sensory modality until they detected the switch target at which point they should monitor the other sensory modality before the start of formal run. The ratio of visual targets and auditory targets was 1:1; the ratio of target and non-target sti-muli was 1:3; the ratio of switch targets and hold targets was 1:1 (all trials with switch targets were excluded from following behavioral, EEG and fMRI data analysis); the ratio of stimuli with spatial cues versus stimuli without spatial cues was 1:24; and the ratio of spatial cues indi-cating the same versus a new spatial direction was 2:1 (all trials with spatial cue were ignored on following EEG and fMRI data analysis). This led to the formation of mini-blocks of
conse-cutive trials of a similar type as defined inFig 1B. This blocking structure facilitated analysis of
fMRI data, while also allowing for EEG analysis of single rapidly presented trials. The order of target stimuli were pseudo-random: The switch targets only occurred in the attended sensory modality, while the hold targets could occur in the attended modality or as lures in the unat-tended sensory modality. After the stimuli were displayed for 250 msec, there was a waiting
period with a pseudorandom duration from 1.13 to 1.62 sec, as shown inFig 1A. Such a
tempo-ral jitter aided in estimating blood oxygenation level dependent (BOLD) signal responses. Each participant performed a series of practice trials before enter into MR scanner, then 6 full fMRI-EEG runs. Each fMRI run lasted approximately 16 min. In total, there were 3600
tri-als (600 for each of the 6 attention conditions). An example run is shown inFig 1D.
Partici-pants were encouraged to maintain their focus of attention on the appropriate sensory modality and spatial location even if they missed a target during run. To determine if subjects were attending to the correct sensory modality, motor responses were evaluated in relationship to blocks of consecutive trials of the same expected sensory modality. Only those blocks of tri-als where correct motor responses were made to switch or hold targets were considered in fur-ther analyses. The overall number of blocks of trials that were rejected because of false alarms or missed switch/hold targets was 16%.
Eye Tracking
MRI compatible camera and automated video processing using the same way as reported on
previous study [27]. The experimenters monitored qualitative eye position for each trial and
provided feedback when subjects deviated from the central position. Only subjects who main-tained visual fixation throughout the study are included in the analysis.
EEG data acquisition and analyses
EEG data were recorded simultaneously with fMRI data by using a 64 channel MRI-compatible
BrainAmp MR Amplify Plus system (Brain Products, Germany,http://www.brainproducts.
com), along with a suitable electrode cap (Falk Minow Services, Germany), which is based on
the extended 10–20 system and a reference electrode located in between Fz and Cz. Horizontal
eye movements were detected by using the electrodes located nearest to the left and right outer canthi respectively (i.e. HEOG and IO) while vertical eye movements and blinks were detected with frontal electrodes FP1 and FP2. In addition, an electrocardiogram (ECG) electrode was fixed on the skin of the back at the level of the participant's heart. Both EEG and ECG signals
were sampled at 5 KHz, and the impedances of electrodes were kept below 20 kΩacross the
entire recording period.
The EEG signals were analyzed using Brain Vision Analyzer 2.0 (Brain Products, Germany) and EEGLAB 11 (sccn.ucsd.edu/eeglab) in Matlab (The MathWorks) software. MRI gradient switching artifacts were removed via Brain Vision Analyzer. The correction process creates an artifact template for each TR based on scanner triggers, and this template is subtracted from
the raw EEG data [28]. Following this correction, the data was down sampled to 250 Hz. The
ballistocardiogram artifact was removed via Niazy’s OBS method [29] using the FMRIB plugin
for EEGLAB. After BCG correction the data from the ECG electrode was discarded. The ocular and muscular artifacts were removed using AAR 1.3 (Automatic Artifact Removal toolbox) plugin for EEGLAB 11. After ocular and muscular correction, the FP1, FP2, HEOG and IO electrodes were excluded from further analyses. The resulting signal from each electrode in each imaging session was band pass filtered between 0.1 and 35 Hz using the Basic FIR filter available in EEGLAB.
Following this preprocessing, EEG data were analyzed with two approaches: block-wise and trial based frequency analysis. For the block-wise analysis, consecutive trials corresponding to the same attention condition (i.e. LV, LA, RV, RA, UV and UA) were combined as a continu-ous epoch for which filter analysis was performed. As noted above, we excluded all blocks where participants made at least one wrong response (by either failing to respond to a switch or hold target in the relevant sensory modality or by incorrectly responding to a hold target in non-relevant sensory stream). In order to assess theta band oscillations in each block, the EEG spectrum from 4 to 8 Hz was calculated from average of Fz and Cz electrodes of each subject. The ITC (inter-trial coherence, i.e. event-related phase-locking) and ERSP (event-related spec-tral perturbation) were calculated on each trial. For each subject, the absolute value estimate of oscillation theta band amplitude for each block within the six conditions were used as parame-ter weights for subsequent fMRI analysis (see below).
fMRI data acquisition and analyses
The functional MRI data were recorded with a Siemens 3T Magnetom TIM Trio system with a
12-channel phased-array head coil. BOLD signals contrast was determined by a T2-weighted
brain was acquired (TR = 15 msec; TE = 4.2 msec; FA = 9 degrees; FOV = 256 mm). Functional data were realigned to the first volume acquired and spatially smoothed with a 6.0 mm
full-width at half-maximum Gaussian kernel using the AFNI software package [30]. Each
func-tional run was mean-centered and detrended for linear and polynomial trends using linear least squares. Parameter related modulations of the BOLD signal were modeled in a generalized linear model (GLM) framework with independent regressors for task related activity corre-sponding to each of the 6 tasks of interest (2 sensory modalities X 3 spatial locations), defined for each mini-block of trials of a similar type. In addition to these 6 regressors of the mean BOLD response for each condition, separate regressors were included that varied proportion-ally with the amplitude in the theta band for each mini-block. The inclusion of these regressors allowed us to determine BOLD activity that scaled linearly with theta amplitude in each condi-tion. Maps of the resulting 12 parameter estimates (beta values) were computed from the GLM from each session and normalized on a subject-by-subject basis to a standard space (MNI) template. Group maps were created by computing a single sample t-test comparing the group mean at each voxel to 0. All reported clusters of activity were corrected for multiple
compari-sons via Monte Carlo simulations using AFNI’s 3dClustSim function by ensuring that the size
of a given cluster of activation was sufficiently large to rule out discovery by chance (corrected
α<0.05). Those significant activity in BOLD would reveals large scale circuits that have mean
activity correlated with EEG theta oscillation.
Results
Behavior
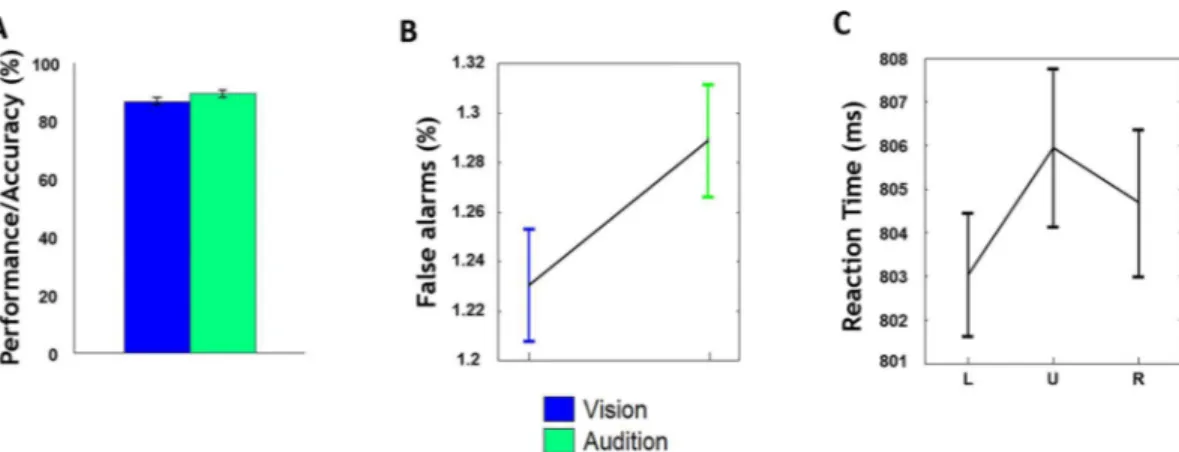
In general, cross-modal visual target detection was faster than cross-modal auditory target detection across all three spatial locations. The mean RT on trials with a visual target (570 ms)
was significantly shorter than those with an auditory target (1038 ms) (P<0.001, two-way
ANOVA). The slower cross-modal auditory target detection processing was expected given
similar findings using other multi-modal discrimination tasks [31–33]. There was no
signifi-cant difference in mean accuracy across the three spatial locations (left: 84%; up: 85%; right: 87%) and between visual (84%), auditory (86%) target detection (P = 0.72, two-way ANOVA), seeFig 2A. The mean false alarm (FA) rate during visual attention was not significantly
differ-ent from that during auditory attdiffer-ention (P = 0.13, two-way ANOVA), seeFig 2B. There was no
significant difference in mean RT of vision and audition across three spatial locations of stimuli
streams (P = 0.3, one-way ANOVA), seeFig 2C. Given the absence of behavioral differences as
a function of spatial location, we collapsed the subsequent fMRI results across spatial position and focused on sensory modality effects irrespective of spatial attention.
ITC and ERSP
The results of ITC estimated for each trial, collapsed across spatial location, show a phase-locking event happening in the theta band on both visual and auditory tasks and located in central and rostral areas of the scalp, especially in the middle-frontal region. Corresponding results from ERSP show a strong synchronization of power during visual and auditory attention, focused
par-ticularly on middle-frontal regions of scalp maps, as shown inFig 3. These results support our
selection of Fz and Cz electrodes for measuring theta power across all six conditions.
To do this, BOLD activity from all blocks of trials with visual attention was directly compared with blocks of trials with auditory attention (collapsed across spatial locations). This
compari-son (p<0.05 corrected) was intended to supplement the subsequent interpretation of the effects
of theta power on BOLD activity. As shown inFig 4andTable 1, when attending to visual
sti-muli there was significantly greater activity in superior occipital gyrus (SOG), middle occipital gyrus (MOG), inferior occipital gyrus (IOG) and fusiform gyrus (FG), as well as the precuneus, angular gyrus (AG), posterior cingulate cortex (PCC) and anterior cingulate cortex (ACC), and dorsal fronto-parietal network, i.e. middle frontal gyrus (MFG), inferior frontal gyrus (IFG), insular lobe (IL), postcentral gyrus (PostG), supplementary motor area (SMA), superior parie-tal lobule (SPL), inferior parieparie-tal lobule (IPL) (red). When attending to auditory stimuli, there was relatively greater activity (blue) in bilateral superior temporal gyrus (STG). These cross-modal differences in primary sensory areas as a function of sensory cross-modality are consistent
with previous studies [34] and demonstrate this effect generalizes to naturalistic stimuli.
Fig 2. Behavioral performance and the correlation between behavioral reaction time.(A) The performance accuracy during visual and auditory target detection. (B) The false alarms for visual and auditory blocks. (C) The mean RT from combing visual and auditory on three target locations, i.e. left (L) up (U) right (R). Error bars represent, for each condition,±SE across subjects.
doi:10.1371/journal.pone.0158465.g002
Fig 3. Group-level ITC and ERSP scalp topographies based on theta band oscillation.Up-left: Group-level topography of ITC for visual attention.Up-right: Group-level topography of ERSP for visual attention. Down-left: Group-level topography of ITC for auditory attention.Down-right: Group-level topography of ERSP for auditory attention. All results averaged across the three spatial (L, U and R) conditions.
Supramodal networks
—
The relationship between theta oscillation and
BOLD across all trials
To identify the likely supramodal sources of theta oscillations, we estimated the relationship between EEG oscillation and BOLD activity for each of the six types of attentional state (2
Fig 4. Crossmodal effect of sensory modality on differences of BOLD signal.A direct comparison between BOLD activity from all visual attention blocks was compared with all auditory attention blocks. The auditory cortex (STG) shows significantly greater activity (blue) during auditory attention, while the visual cortex, the regions relevant with DMN (ACC, AG, PCC and Precuneus) and left dorsal frontal parietal network shows significantly greater activity (yellow and red) during the visual attention compared to the auditory task. This was an exploratory analysis, with p<0.05 corrected. Results are collapsed across three spatial locations (L, U and R).
doi:10.1371/journal.pone.0158465.g004
Table 1. Average MNI coordinates (peak), size and t-value of clusters showing significant Crossmodal effect of sensory modality on differences of BOLD signal (P<0.05, corrected).
Anatomical Region Hemisphere Size X y z t-value
MOG, IOG, FG, AG, SOG, SPL R- 2033 -44 78 -4 3.84
IOG, MOG, SPL, IPL L- 1744 48 69 -6 3.83
SMA, Precuneus, PCC M- 805 3 3 57 3.70
IFG, IL L- 297 36 -24 -18 3.72
PostG L- 215 42 18 42 3.67
STG L- 162 63 27 9 3.80
MFG L- 152 30 -33 27 3.65
Thalamus R- 117 -15 27 0 3.76
ACC M- 112 -3 -36 15 3.66
STG R- 109 -66 30 12 3.77
sensory modalities X 3 spatial locations). We then collapsed across sensory location, resulting in both positive and negative correlations related to either visual or auditory attention. To assess supramodal sources, we calculated the conjunction combining auditory and visual sets
of results. As shown inFig 5and summarized inTable 2A, the conjunction analysis revealed
Fig 5. Supramodal correlates of theta amplitude based on conjunction analysis.(p<0.05, corrected). Results are collapsed across 3 spatial (L, U and R) conditions. There is an overall negative relationship of theta and BOLD in bilateral PCC and CN, left mSFG and AG, right SFG (blue). There is an overall positive relationship of theta and BOLD in right ventral PreG (red).
doi:10.1371/journal.pone.0158465.g005
Table 2. Average MNI coordinates (peak), size and t-value of clusters showing significantly correlation between EEG oscillation and BOLD activity (P<0.05, corrected).
Anatomical Region Hemisphere Size X y z t-value
A, Supramodal correlates based on conjunction analysis
PCC M- 128 -2 52 30
SFG R- 95 -21 -66 18
CN M- 78 6 -9 -3
mSFG L- 50 3 -42 36
PreG R- 47 -56 -2 18
AG L- 38 45 63 27
B, Theta correlated BOLD—Visual Conditions
mSFG, ACC, SFG, MidOG M- 1338 6 -60 18 2.52
M-SMA, SFG, PostG, SPL L- 930 0 6 57 2.46
PreG, PostG, RO, IL R- 899 -36 3 42 2.47
AG, IPL R- 400 -54 60 27 2.36
CN M- 362 -15 -18 15 2.44
PCC M- 329 -3 54 30 2.42
C, Theta correlated BOLD—Auditory Conditions
PreG, RO, STG R- 840 -33 12 30 2.41
AG, MOG L- 428 51 60 30 2.38
mSFG, ACC M- 398 3 -51 15 2.43
Cuneus, PCC M- 390 6 66 24 2.44
Cluster size is given in voxels (3×3×3). Abbreviations: L-, left; R-, right; M-, middle; SFG, superior frontal gyrus; mSFG, medial segment of the SFG; MidOG, mid orbital gyrus; ACC, anterior cingulate cortex; CN, caudate nucleus; IL, insula lobe; PreG, precentral gyrus; PostG, postcentral gyrus; SMA,
supplementary motor area; RO, rolandic operculum; STG, superior temporal gyrus; PCC, posterior cingulate cortex; AG, angular gyrus; SPL, superior parietal lobule; IPL, inferior parietal lobule; MOG, middle occipital gyrus.
that theta oscillation significantly displayed a negative linear relationship (P<0.05, corrected) with BOLD activity in medial segment of the superior frontal gyrus (mSFG), superior frontal gyrus
(SFG), AG and PCC, areas of the default mode network (DMN) [35], as well as caudate nucleus
(CN). There was an overall positive relationship of theta and BOLD in right ventral precentral gyrus (PreG). That is, weaker the theta power coincided with greater relative BOLD activity.
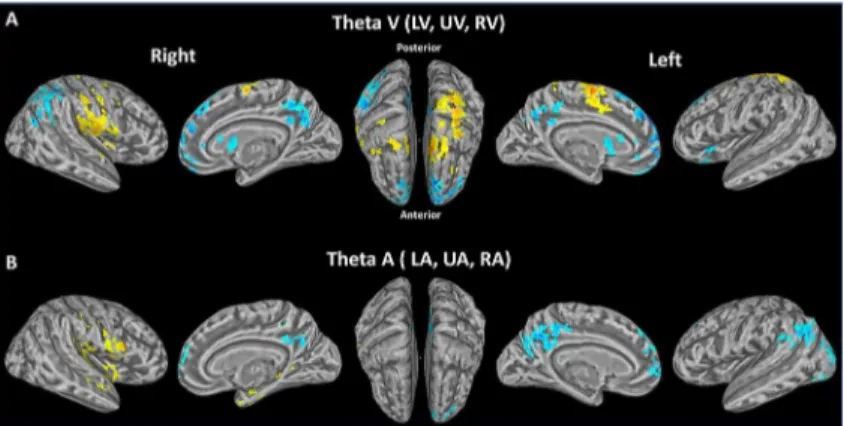
The effects of sensory modality: Modality Specific Networks
The previous section demonstrates a strong correlation between theta and BOLD activity in mul-tiple regions in the brain, irrespective of the focus of endogenous attention with respect to either spatial location or sensory modality. We next tested if differences of endogenous attention towards visual or auditory targets would impact the brain network associated with theta activity. Of note, the mean theta amplitude for visual (i.e. LV, UV and RV) and auditory (i.e. LA, UA and
RA) attention did not differ (V: 0.567μV; A: 0.527μV; P = 0.168). Thus, any differences as a
func-tion of sensory modality could not be attributed to theta amplitude alone. For the visual attenfunc-tion conditions (collapsed across spatial location), there was a significant positive relationship with theta oscillation in bilateral SMA and PostG, left SFG and SPL, right PreG, rolandic operculum
(RO) and IL (Fig 6A;Table 2B), consistent with a role of theta in interaction with a set
visuomo-tor regions. Of note, during the visual attention conditions, theta oscillation had a significant neg-ative relationship with BOLD activity in mSFG, ACC, SFG, PCC and CN both hemispheres, and
right AG and IPL (Fig 6A;Table 2B). For the auditory attention conditions (collapsed across
spa-tial location), there was a significant positive relationship with theta oscillation in right PreG, RO
and STG (Fig 6B;Table 2C). There was a significant negative relationship between theta
oscilla-tion and BOLD activity for auditory trials in mSFG, ACC, Cuneus and PCC of both hemispheres,
and left AG and MOG (Fig 6B;Table 2C). The left MOG and bilateral cuneus are all associated
with visual processing. Other areas, including STG are involved in auditory processing. Together, this indirectly suggests there is also some cross-modal positive influence of theta on cortical areas involved in the relevant sensory modality.
Discussion
In order to assess the role and source of theta oscillations in cross-modal attention we exam-ined the relationship between theta amplitude averaged over Fz and Cz electrodes and BOLD
activity during a cross-modal attention task. Using multiple naturalistic visual and auditory sti-muli presented across three spatial locations, we could identify several key EEG-fMRI corre-lates of endogenous attention. The present results add to the literature by showing that both visual and auditory attention to natural features were significant modulators of theta band activity.
Supramodal mechanisms
Correlation of theta amplitude with BOLD fMRI showed that it related positively to activity in right ventral precentral gyrus. This area is associated with response selection, prediction and general properties of sensorimotor control, suggesting that the source of theta oscillations changes the gain in this area to facilitate sensorimotor processing. In addition, theta power cor-related negatively with activity in precuneus and medial segment of superior frontal gyrus, two
brain areas that consistently included the DMN [36]. Recent studies have shown that
paramet-ric increases in frontal theta coincide with decreases in BOLD activity in the DMN during
visual working memory [19]. We extend this finding to a cross-modal attention task and
estab-lish that this is a supramodal effect. One interpretation of this finding is based on the notion that there is a supramodal cognitive control system, likely localized to medial prefrontal cortex and ACC, whose activity is reflected by theta amplitude. Positive interactions with task relevant sensorimotor circuits lead to improved performance. But just as importantly, this circuit is crit-ical for maintaining task "set". Central to this is staying on task and avoiding mind wandering or stimulus independent thought. In this case, one might expect to see an inverse relationship between theta and activity in DMN, which is exactly what we find. The stronger this negative
interaction, the more time cognition is“on task”.
Modality specific processes
Modality specific effects of theta on BOLD activity were particularly apparent in the visual
attention condition (Fig 6). Prior studies have supported a role for cognitive control during
visual attention that is reflected by frontal theta oscillations with sources in mid frontal regions such as middle cingulate cortex (MCC) and pre-supplemental motor area (Pre-SMA). These
are thought to entrain sensory and motor cortices for communication [11]. Furthermore,
pre-vious EEG and fMRI studies show that the top-down cognitive modulation from prefrontal cortex could facilitate the neural signal processing in sensorimotor cortex and eventually affect
behavioral performance [10,37–39]. Our results show that a positive correlation between theta
oscillation and BOLD activity was found in the sensorimotor cortex (PreG, PostG, IL and RO)
during cross-modal visual attention (seeFig 6A;Table 2B) similar to other studies of
cross-modal visual attention that have been interpreted as the result of top-down cognitive control
processes [10]. That positive correlation could be modulated by top-down cognitive control of
theta oscillation to facilitate the behavioral response to visual stimuli (see the RT results). Previous studies show that a fronto-parietal network is involved when subjects engage in
frequent switches of task rules [40–42]. As well as, the top-down modulation in task
prepara-tory states during selective attentional control was observed in widely distributed brain regions
that form various fronto-parietal networks [43–45]. In addition, the medial prefrontal cortex
was phase-lead relative to left parietal particularly on theta band during task preparatory states
[45]. Similar to this previous work, the positive correlation between theta oscillation and
BOLD activity in our results show that fronto-parietal areas are involved in cross-modal visual attention.
that cross modal effects are direct, i.e. that auditory attention inhibits visual signal input, while facilitating auditory signal input without the need for supramodal control, and vice versa. In that case, the corresponding interaction of theta-BOLD activities in sensory cortices should be found on both visual and auditory attention conditions, but we have not found them both in the current results. Alternatively, the supramodal involvement of the DMN might imply that cross-modal inhibition is actually dependent on the DMN. The negative correlation of BOLD within the default-mode network (DMN) during multisensory competition has been described
previously [10]. Our current results mirror this prior work by also showing a negative
relation-ship between theta amplitude and BOLD activity in DMN that is present for either sensory modality. Others (Huang, et al., 2015) have viewed the involvement of the DMN as causal to the cross-modal inhibition. That is, competition is mediated in part by the DMN. However, since the DMN is not thought to be involved in stimulus dependent task processing or cogni-tive control, we would argue that it seems unlikely that the cognicogni-tive control system is depen-dent on activity in DMN. A third view, that we advocate here, is that theta oscillations have an influence on both representing the status changes of DMN and separately facilitating the com-petitive interaction of sensory cortices during auditory attention. We speculate that these theta oscillations may reflect an inhibitory mechanism over the irrelevant sensory modality to avoid processing irrelevant information while at the same time representing involvement of the
DMN [11,46,47]. Given the limits of temporal resolution in our fMRI data, we cannot
disen-tangle these alternatives.
Cross Modal Contributions
To facilitate comparison of our findings with prior studies of endogenous cross-modal atten-tion between visual and auditory modalities we directly compared BOLD activity in these two states (and ignored theta power). As in previous studies, there was a tendency for endogenous attention to enhance relative BOLD activity in relevant sensory processing areas whilst reduc-ing activity in the irrelevant modality. We also noted that regions associated with the DMN (ACC, AG, PCC and Precuneus) likewise showed a relatively higher activity during the visual attention task. In behavioral results, there were shorter RTs for detecting visual targets com-pared to auditory targets, implying that for the visual attention condition the higher relative activity in DMN might stem from more overall intertrial time spent in stimulus independent
thought. Critically, the loci in these results (Fig 4) do not correspond to either supramodal or
modality specific differences of theta-BOLD interactions. Thus, theta-related influences on BOLD described in previous sections may not simply be driven by underlying main effects of sensory modality on BOLD activity.
Methodological concerns
Acknowledgments
The authors thank M. Mendoza, M. Schubert, P. Beach, M. Verket, D. Barany, J. Elliot, E. Cad-digan, A. Shapiro and C. Mangi for their assistance in conducting the experiment. This work was supported by the Institute for Collaborative Biotechnologies through grant W911NF-09-0001 from the U.S. Army Research Office. The content of the information does not necessarily reflect the position or the policy of the Government, and no official endorsement should be inferred."
Author Contributions
Conceived and designed the experiments: WW SV SG. Performed the experiments: WW SV. Analyzed the data: WW SV TL. Contributed reagents/materials/analysis tools: WW SV TL. Wrote the paper: WW SG TL SV.
References
1. Shomstein S, Yantis S. Control of attention shifts between vision and audition in human cortex. J Neu-rosci. 2004; 24: 10702–10706. doi:10.1523/JNEUROSCI.2939-04.2004PMID:15564587
2. Driver J, Spence C. Crossmodal attention. Current Opinion in Neurobiology. 1998. pp. 245–253. doi: 10.1016/S0959-4388(98)80147-5PMID:9635209
3. Meredith MA, Stein BE. Interactions among converging sensory inputs in the superior colliculus. Sci-ence. 1983; 221: 389–391. doi:10.1126/science.6867718PMID:6867718
4. Stein BE, Stanford TR. Multisensory integration: current issues from the perspective of the single neu-ron. Nat Rev Neurosci. 2008; 9: 255–266. doi:10.1038/nrn2377PMID:18354398
5. Eimer M, van Velzen J, Driver J. Cross-modal interactions between audition, touch, and vision in endogenous spatial attention: ERP evidence on preparatory states and sensory modulations. J Cogn Neurosci. 2002; 14: 254–271. doi:10.1162/089892902317236885PMID:11970790
6. Murray MM, Wallace MT, McDonald JJ, Green JJ, Störmer VS, Hillyard SA. Cross-modal spatial cueing of attention influences visual perception. 2012;
7. Naue N, Rach S, Struber D, Huster RJ, Zaehle T, Korner U, et al. Auditory event-related response in visual cortex modulates subsequent visual responses in humans. J Neurosci. 2011; 31: 7729–7736. doi:10.1523/jneurosci.1076-11.2011PMID:21613485
8. Senkowski D, Schneider TR, Foxe JJ, Engel AK. Crossmodal binding through neural coherence: impli-cations for multisensory processing. Trends in Neurosciences. 2008. pp. 401–409. doi:10.1016/j.tins. 2008.05.002PMID:18602171
9. Uno T, Kawai K, Sakai K, Wakebe T, Ibaraki T, Kunii N, et al. Dissociated Roles of the Inferior Frontal Gyrus and Superior Temporal Sulcus in Audiovisual Processing: Top-Down and Bottom-Up Mismatch Detection. PLoS One. 2015; 10: e0122580. doi:10.1371/journal.pone.0122580PMID:25822912
10. Huang S, Li Y, Zhang W, Zhang B, Liu X, Mo L, et al. Multisensory Competition Is Modulated by Sen-sory Pathway Interactions with Fronto-Sensorimotor and Default-Mode Network Regions. J Neurosci. 2015; 35: 9064–9077. doi:10.1523/JNEUROSCI.3760-14.2015PMID:26085631
11. Cavanagh JF, Frank MJ. Frontal theta as a mechanism for cognitive control. Trends in Cognitive Sci-ences. 2014. pp. 414–421. doi:10.1016/j.tics.2014.04.012PMID:24835663
12. Uhlhaas PJ, Roux F, Rodriguez E, Rotarska-Jagiela A, Singer W. Neural synchrony and the develop-ment of cortical networks. Trends in Cognitive Sciences. 2010. pp. 72–80. doi:10.1016/j.tics.2009.12. 002PMID:20080054
13. Buzsáki G, Draguhn A. Neuronal oscillations in cortical networks. Science. 2004; 304: 1926–1929. doi: 10.1126/science.1099745PMID:15218136
14. Cohen MX, Donner TH. Midfrontal conflict-related theta-band power reflects neural oscillations that pre-dict behavior. J Neurophysiol. 2013; 110: 2752–63. doi:10.1152/jn.00479.2013PMID:24068756
15. Min B-K, Park H-J. Task-related modulation of anterior theta and posterior alpha EEG reflects top-down preparation. BMC Neurosci. 2010; 11: 79. doi:10.1186/1471-2202-11-79PMID:20584297
16. Fries P. A mechanism for cognitive dynamics: Neuronal communication through neuronal coherence. Trends in Cognitive Sciences. 2005. pp. 474–480. doi:10.1016/j.tics.2005.08.011PMID:16150631
18. Ben-Simon E, Podlipsky I, Arieli A, Zhdanov A, Hendler T. Never resting brain: Simultaneous represen-tation of two alpha related processes in humans. PLoS One. 2008; 3. doi:10.1371/journal.pone. 0003984
19. Scheeringa R, Petersson KM, Oostenveld R, Norris DG, Hagoort P, Bastiaansen MCM. Trial-by-trial coupling between EEG and BOLD identifies networks related to alpha and theta EEG power increases during working memory maintenance. Neuroimage. 2009; 44: 1224–1238. doi:10.1016/j.neuroimage. 2008.08.041PMID:18840533
20. Hanslmayr S, Volberg G, Wimber M, Raabe M, Greenlee MW, Bauml K- HT. The Relationship between Brain Oscillations and BOLD Signal during Memory Formation: A Combined EEG-fMRI Study. Journal of Neuroscience. 2011. pp. 15674–15680. doi:10.1523/JNEUROSCI.3140-11.2011PMID:22049410
21. Mo J, Liu Y, Huang H, Ding M. Coupling between visual alpha oscillations and default mode activity. Neuroimage. 2013; 68: 112–118. doi:10.1016/j.neuroimage.2012.11.058PMID:23228510
22. Hipp JF, Siegel M. BOLD fMRI Correlation Reflects Frequency-Specific Neuronal Correlation. Curr Biol. Elsevier Ltd; 2015; 25: 1–7.
23. Mason MF, Norton MI, Van Horn JD, Wegner DM, Grafton ST, Macrae CN. Wandering minds: The default network and stimulus independant thought. Science (80-). 2007; 315: 393–395. doi:10.1126/ science.1131295PMID:17234951
24. Iordanescu L, Grabowecky M, Suzuki S. Object-based auditory facilitation of visual search for pictures and words with frequent and rare targets. Acta Psychol (Amst). 2011; 137: 252–259. doi:10.1016/j. actpsy.2010.07.017
25. Mayhew SD, Dirckx SG, Niazy RK, Iannetti GD, Wise RG. EEG signatures of auditory activity correlate with simultaneously recorded fMRI responses in humans. Neuroimage. 2010; 49: 849–864. doi:10. 1016/j.neuroimage.2009.06.080PMID:19591945
26. Snodgrass JG, Vanderwart M. A standardized set of 260 pictures: norms for name agreement, image agreement, familiarity, and visual complexity. J Exp Psychol Hum Learn. 1980; 6: 174–215. doi:10. 1037/0278-7393.6.2.174PMID:7373248
27. Barany D a, Della-Maggiore V, Viswanathan S, Cieslak M, Grafton ST. Feature interactions enable decoding of sensorimotor transformations for goal-directed movement. J Neurosci. 2014; 34: 6860–73. doi:10.1523/JNEUROSCI.5173-13.2014PMID:24828640
28. Allen P, Josephs O, Turner R. A method for removing imaging artifact from continuous EEG recorded during functional MRI. Neuroimage. 2000; Available:http://www.sciencedirect.com/science/article/pii/ S1053811900905998
29. Niazy RK, Beckmann CF, Iannetti GD, Brady JM, Smith SM. Removal of FMRI environment artifacts from EEG data using optimal basis sets. Neuroimage. 2005; 28: 720–737. doi:10.1016/j.neuroimage. 2005.06.067PMID:16150610
30. Cox RW. AFNI: software for analysis and visualization of functional magnetic resonance neuroimages. Comput Biomed Res. 1996; 29: 162–173. doi:10.1006/cbmr.1996.0014PMID:8812068
31. Molholm S, Ritter W, Javitt DC, Foxe JJ. Multisensory Visual-Auditory Object Recognition in Humans: A High-density Electrical Mapping Study. Cereb Cortex. 2004; 14: 452–465. doi:10.1093/cercor/ bhh007PMID:15028649
32. Wang WY, Hu L, Valentini E, Xie XB, Cui HY, Hu Y. Dynamic characteristics of multisensory facilitation and inhibition. Cogn Neurodyn. 2012; 6: 409–419. doi:10.1007/s11571-012-9197-xPMID:24082962
33. Wang W, Hu L, Cui H, Xie X, Hu Y. Spatio-temporal measures of electrophysiological correlates for behavioral multisensory enhancement during visual, auditory and somatosensory stimulation: A behav-ioral and ERP study. Neurosci Bull. 2013; 29: 715–724. doi:10.1007/s12264-013-1386-zPMID: 24293020
34. Penfield W, Perot P. The brain’s record of auditory and visual experience. Brain. 1963. pp. 595–696.
35. Bressler SL, Menon V. Large-scale brain networks in cognition: emerging methods and principles. Trends in Cognitive Sciences. 2010. pp. 277–290. doi:10.1016/j.tics.2010.04.004PMID:20493761
36. Gusnard DA, Raichle ME, Raichle ME. Searching for a baseline: functional imaging and the resting human brain. Nat Rev Neurosci. 2001; 2: 685–694. doi:10.1038/35094500PMID:11584306
37. Pessoa L, Kastner S, Ungerleider LG. Neuroimaging studies of attention: from modulation of sensory processing to top-down control. J Neurosci. 2003; 23: 3990–3998. 23/10/3990 [pii] PMID:12764083
38. Kastner S, Ungerleider LG. Mechanisms of visual attention in the human cortex. Annu Rev Neurosci. 2000; 23: 315–341. doi:10.1146/annurev.neuro.23.1.315PMID:10845067
40. Hikosaka O, Isoda M. Switching from automatic to controlled behavior: cortico-basal ganglia mecha-nisms. Trends in Cognitive Sciences. 2010. pp. 154–161. doi:10.1016/j.tics.2010.01.006PMID: 20181509
41. Dosenbach NUF, Fair DA, Miezin FM, Cohen AL, Wenger KK, Dosenbach RAT, et al. Distinct brain net-works for adaptive and stable task control in humans. Proc Natl Acad Sci U S A. 2007; 104: 11073– 11078. doi:10.1073/pnas.0704320104PMID:17576922
42. Brass M, von Cramon DY. The role of the frontal cortex in task preparation. Cereb Cortex. 2002; 12: 908–914. doi:10.1093/cercor/12.9.908PMID:12183390
43. Corbetta M, Shulman GL. Spatial neglect and attention networks. Annu Rev Neurosci. 2011; 34: 569– 599. doi:10.1146/annurev-neuro-061010-113731PMID:21692662
44. Petersen SE, Posner MI. The Attention System of the Human Brain: 20 Years After. Annual Review of Neuroscience. 2012. pp. 73–89. doi:10.1146/annurev-neuro-062111-150525PMID:22524787
45. Phillips JM, Vinck M, Everling S, Womelsdorf T. A long-range fronto-parietal 5- to 10-Hz network pre-dicts“top-down”controlled guidance in a task-switch paradigm. Cereb Cortex. 2014; 24: 1996–2008. doi:10.1093/cercor/bht050PMID:23448872
46. Singer W. Cortical dynamics revisited. Trends in Cognitive Sciences. 2013. pp. 616–626. doi:10.1016/ j.tics.2013.09.006PMID:24139950