Rev Bras Med Esporte _ Vol. 13, Nº 2 – Mar / Abr, 2007
71e
1. Laboratório de Pesquisas em Biomecânica Aquática – UDESC.2. Laboratório de Psicologia do Esporte e do Exercício – UDESC. Received in 22/8/04. Final version received in 11/7/06. Approved in 11/ 10/ 06.
Correspondence to: Rua Dr. Nascimento, 261, apart. 301, Centro – 96200-300 – Rio Grande, RS. Tels.: (53) 3236-1262, 9161-9220. E-mail: cesar vaghetti @hotmail.com
Auditory and visual single reaction span in surfers
with different ability levels: comparison of professional,
amateur athletes and surf practitioners
César Augusto Otero Vaghetti1, Helio Roesler1 and Alexandro Andrade2
O
RIGINALA
RTICLEKeywords: Athletes. Surf. Performance.
ENGLISH VERSION
ABSTRACT
The reaction span RS (RTS) represents the level of neuromuscu-lar coordination in which the visual, auditory or touch stimuli are decodified by the body through different physical-chemical and mechanical processes. The aim of this research was to identify the auditory and visual RTS in professional and amateur surfers as well as surf practitioners to verify whether there are statistical dif-ferences among the surfers groups as well as to correlate the re-action span with the athletes’ performance. 103 surfers participat-ed in this study: 42 professional male athletes (Brazilian and foreign); 11 professional female athletes; 25 amateur college student ath-letes, and 25 surf practitioners. Data collection was conducted at the beaches where the following events took place: WQS (World Qualifying Series, world circuit phase); Supersurf (Professional Surfing Brazilian championship phase); CCSU (catarinense college surf circuit phase). The following instruments were used: a switch with a button of 0.8 (N) sensibility; a L.E.D. for visual stimulus; two loudspeakers with 315 (Hz) of frequency and 81 (db) of sound pres-sure for auditory stimulus, as well as an electronic device with the aim to generate the auditory, visual and synchronism signal. The data acquisition was performed with the use of the SAD software version 32. Statistically significant differences were found for the auditory and visual RTS between the professional (male) versus practitioners and professional (female) versus practitioners. Statis-tically significant differences were found between the amateurs versus practitioners only for the visual RTS, with lower RTS for the more experienced ones. A positive correlation was found for the visual RTS between the professional (female) athletes versus the ranking.
INTRODUCTION
Simple reaction time (SRT) is a physical skill closely related to human performance and it is defined as being the time derived
from a stimulus until the beginning of a response(1). Since it is a
velocity data processing indicator, the reaction time represents the
level of neuromuscular coordination(2) in which the body through
different physical-chemical and mechanical processes decodes vi-sual, auditory or tactile stimuli which travel via afferent ways and
reach the brain as sensory stimuli(3-4). After this whole process, the
motor response is transmitted to by efferent neurons that pene-trate the bone marrow through the torso or sensory root
perform-ing synapses via interneurons, which transmit the information to
the many levels of the bone marrow until the desired motor unit(5).
Reaction time can be divided in two distinct phases according
to Christina and Rose(6): the first phase is called motor or
pre-tension, where the stimulus are decoded until the registration of the first electric activities in the muscle occurs, performed by the peripheral nervous system. The second phase called motor or ten-sion, is the one in which the muscle cells begin the muscular con-traction process until the first movements. Other researchers be-lieve that the pre-motor phase is prepared by the central nervous system, since in certain tasks the SRT is more related to mental
factors than to the peripheral nervous system(7). Therefore, besides
being a concentration and attention indicator, the SRT is influenced by factors related to physical fitness, motor coordination as well as genetic and psychological factors.
Surfing is a sports modality in which the environmental factors
closely influence on the physical fitness of athletes(8), especially
over the energy supply systems(9-11). During a competition, the
ath-letes are judged concerning their ability to perform maneuvers,
which according to Lowdon and Patemam(12), involve the
utiliza-tion of fast reflexes as well as sharp physical fitness, reacutiliza-tion time and velocity of movement in order to be able to perform maneu-vers in the most challenging sections, and face changes in the waves’ formation.
This sport’s evolution has always been conditioned to the use of better sportive gear and the increase in the number of national and international events. Important aspects such as sports training in surfing are secondary factors. They are even inexistent many times, since the majority of amateur surfers from the State of Santa Cata-rina does not have specialized follow-up in any of the sport’s prep-aration phases. Even within the professional environment, such
item plays a secondary role and there is not specificity in training
(13-15). Other researchers such as Lowdon, Mourad and Warne(16)
re-port that the majority of the competitors, both amateur and profes-sional, do not have a specific and suitable training routine, since they believe that the sport’s practice itself is sufficient for reaching the physical fitness level demanded in a competition. The lack of parameters for the physical fitness required during surfing harms both the elaboration of training methods and the control of these
variables during competitions. Brasil et al.(17), report about the lack
of specific literature as well as the lack of scientific data in a surf-ing session, since little is known about the factors which affect the athletes’ performance as well as about which variables may con-tribute to the physiological characterization of this sport.
72e
Rev Bras Med Esporte _ Vol. 13, Nº 2 – Mar / Abr, 2007METHOD
After being approved by the Physical Education, Physical Thera-py and Sports Committee of Research Ethics of the Santa Catarina State University, 103 surfers participated in the research. They have been intentionally selected on the beaches where the WQS (World Qualifying Series, world circuit phase), SuperSurf (Brazilian profes-sional championship phase), CCSU (Santa Catarina State universi-ty circuit phase) events took place. The individuals were divided in four groups with the respective age and weight means: 42 male professional athletes (Brazilian and foreign) with 25 ± 4.61 (years) and 68.86 ± 5.97 (kg), 11 female professional athletes with 23.1 ± 4.64 (years) and 57.64 ± 8.07 (kg), 25 male amateur athletes with 21.8 ± 3.10 (years) and 71.16 ± 7.83 (kg) and 25 male surfing prac-titioners with 25.36 ± 4.64 (years) and 75.16 ± 22.72 (kg).
A switch with a key that can be activated by a 0.8 (N) charge; a L.E.D. for visual stimulus; and two acoustic boxes with 315 (Hz-frequency) and 81 (db-resonant pressure) for the auditory stimulus as well as an electronic device especially designed to measure the
reaction time to generate auditory, visual and synchronism signals(18)
were used in order to measure the SRT. A computer equipped
with a Cio-das-16 / JR data acquisition board(19) withA / D 12 Bits
16-channel converter, (Computer Boards Inc.) and the SAD software(20)
(Rio Grande do Sul Federal University) with an acquisition rate of 1000 points / channel / second, were used as complementary tools for the data acquisition and processing performance. The equip-ment was assembled in isolated rooms with assess given only to competitors or competition directors, which enabled that the re-searcher’s subjects concentration and attention would focus on the tests. Only right-handed subjects were chosen, although some
researchers as Gignac and Vernon(21) have not found differences
between dominant and non-dominant hand.
Intervenient variables such as muscular fatigue and pre-compe-tition psychological tension were controlled using the same
proce-dures by Lowdon and Patemam(12). Therefore, only the athletes
who were respectively trained or had already participated in com-petitions at least in an-hour interval prior to the tests, or would compete in a minimum interval of an hour after the tests were chosen. The surfing practitioners only followed the criterion of not having practiced physical exercise one hour prior to the tests, once the reaction time suffers an increase because of the acute effect during exercise of the physical abilities flexibility and strength(22).
The subjects were instructed to be seated on a chair with fore-arm resting on a table and with the right index finger on the switch. They also received instruction to press the switch as fast as possi-ble after receiving the auditory or visual stimulus (acoustic loud-speakers and L.E.D. positioned at 30 (cm) from the subjects). The synchronizer was under the researcher’s control, who when acti-vating it would trigger the auditory, visual and synchronism signal connected to the computer. Each individual performed two tests: the first test for the auditory SRT and the second one for the visual SRT. A pre-test for each variable was also performed for familiar-ization with the measurement instruments.
Descriptive statistics was used for the determination of the mean, standard deviation and the variation coefficient of the phys-ical features of the sample’s subjects as well as the reaction time.
The hypothesis test (Student-t test, using p ≤ 0.05) was used for
the verification of the statistic differences between the means of the auditory and visual SRTs of the surfers’ groups. The linear cor-relation test by Spearman was applied in order to verify the corre-lations among variables, as well as athletes’ position in the ranking and phases.
RESULTS
The SRT was calculated through the difference of the correspond-ing number values in the “X” axis between the last point and the
first point of “C” line (figure 1). The graph in figure 1 represents the variation of the electric tension (mV); electric signal generated by the synchronizer in the “Y” axis in relation to the time (s) in the “X” axis.
The means, standard deviations and coefficients of variation of the auditory and visual SRTs of the sample can be seen in table 1.
TABLE 1
Auditory and visual SRT of the male professional (male), female professional (fem), amateur and surfing practitioner groups
Groups Auditory and visual SRT (seconds)
Male Fem. Amateurs Practitioners
professional professional (n = 25) (n = 25)
(n = 42) (n = 11)
SRT Auditory Visual Auditory Visual Auditory Visual Auditory Visual
Mean 00.204 00.213 00.213 00.188 00.225 00.218 00.282 00.289
SD ± 00.059 00.059 00.052 00.051 00.074 0.06 00.124 00.098
CV % 28.717 27.879 24.231 27.087 32.849 27.565 44.150 34.036
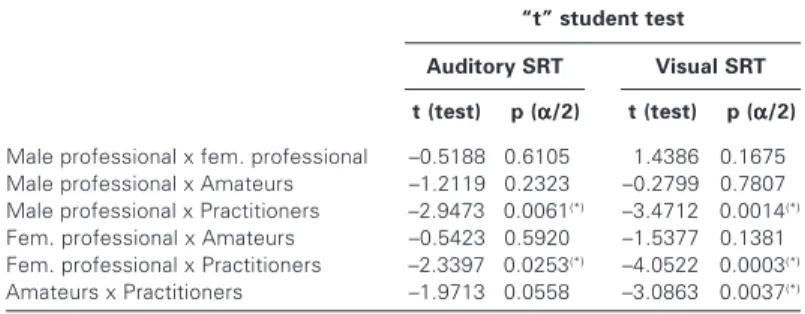
Based on the statistical calculations, statistically significant dif-ferences can be found for the means of the auditory and visual SRTs among groups of the studied sample (table 2). The results
TABLE 2
Test of mean differences between the sample’s groups for the
auditory and visual SRTs using a significance level of p ≤≤≤≤≤ 0.05
“t” student test
Auditory SRT Visual SRT
t (test) p (ααααα/2) t (test) p (ααααα/2)
Male professional x fem. professional –0.5188 0.6105 1.4386 0.1675
Male professional x Amateurs –1.2119 0.2323 –0.2799 0.7807
Male professional x Practitioners –2.9473 0.0061(*) –3.4712 0.0014(*)
Fem. professional x Amateurs –0.5423 0.5920 –1.5377 0.1381
Fem. professional x Practitioners –2.3397 0.0253(*) –4.0522 0.0003(*)
Amateurs x Practitioners –1.9713 0.0558 –3.0863 0.0037(*)
* ”p” values in which differences are significant.
Figure 1 – Representative curves of the measurement of auditory SRTs: A – lack of electric signal of the synchronizer; B – starting instant of the synchronizer (auditory stimulus); C – time interval between an stimulus and a response action; D – instant in which the research’s subject pressed the switch key after perceiving the stimulus; E – time interval in which the switch key is kept pressed by the sample’s subject; F – instant in which the research’s subject releases the switch key; G – synchronizer still on; H – instant in which the synchronizer was turned off; I – time interval after data collection, lack of electric signal of the synchronizer.
electric tension (mV)
Rev Bras Med Esporte _ Vol. 13, Nº 2 – Mar / Abr, 2007
73e
demonstrated that the auditory SRTs between amateurs and
surf-ing practitioners were not significantly different. However, the t
sam-ple = –1.9713 value found was very close to the tset = ± 2.009 value.
Therefore, despite not having presented significant differences, such result should be considered relevant.
In order to verify athletes’ performance, the groups were rear-ranged according to their classification in the competitions (phas-es in which the data collections were conducted) and in the re-spective rankings (obtained with the federations and associations). Therefore, the athletes who participated in the world circuit and are part of the world ranking were the “WQS” group; the male SuperSurf group was consisted of the male Brazilian professional athletes; the female SuperSurf of the female Brazilian professional athletes, and the “CCSU”, of the university amateur athletes. A positive and significant correlation for the auditory SRT between the female SuperSurf and the ranking and a negative and signifi-cant correlation for the visual SRT between the amateurs and phase can be observed in table 3. Nevertheless, the negative correla-tions are not relevant to this study.
cant differences between the auditory and visual SRTs of the ath-letes compared with the former players group. However, when compared with the auditory and visual SRTs of Olympic athletes with university athletes, no significant differences were found. Nevertheless, the SRTs found by the researchers for the Olympic athletes have been lower than the SRTs of university athletes.
Likewise, in this research statistically significant differences were found for the auditory and visual SRTs between professional ath-letes and surfing practitioners and no significant difference between professional and amateur athletes, although the professional ath-letes have had lower auditory and visual SRTs. Other studies also
corroborate this research such as the ones by Ando, Kida and Oda(27),
who found visual and peripheral SRTs lower for a group of athletes comparing with a group of non-athletes; Mori, Ohtani and
Imana-ka(28), who found statistically significant differences among karate
athletes, with lower reaction times for more experienced athletes;
and Kida, Oda and Matsumurab(29), who compared visual SRTs of
university students with high school students and did not find dif-ferences, since individuals with similar skill levels tend to have SRT values within specific time intervals.
One of the limitations of this research was the performance of only one pre-test for the auditory and visual SRTs in each individual due to the data collection being performed during important sport events (international, national and state). Therefore, the athletes could not be available for a long time to the researchers. Conse-quently, in the female professional athletes and amateur athletes the mean of the visual SRT was lower than the auditory SRT. Such result may be related to the data collection procedures. The visual tests were previously conducted, providing thus familiarization with the measurement instruments, although the visual system ways are longer and the light capture and sensory information
transfor-mation process are more complex than the auditory system(3).
Vaghetti, Martins and Roesler(30), when investigating the auditory
and visual SRTs between amateur athletes and surfing practitio-ners, did not conduct any pre-test and found lower and statistically different SRTs from the visual SRTs. They also found lower audito-ry and visual SRTs for the athletes group; although no statistically significant differences have been found from the means of the auditory and visual SRTs between the groups.
Individuals with similar ages and fitness levels tend to have
sim-ilar SRTs(31-32). In table 1 a similarity between the SRTs of the male
and female professional groups and a small difference of these groups with the amateur athletes can be seen. The studies by
Bhanot and Sidhu(26) corroborate this analysis, since no differences
were found in the SRTs between Olympic and amateur athletes
and Lowdon and Patemam(12), who did not find significant
differ-ences either in the SRTs between professional surfers of both sex-es.
In table 3 a positive and significant correlation between the au-ditory SRT of the group of athletes who participated in the female SuperSurf and its performance in the ranking may be observed. Although the coefficient r = 0645 shows a reasonable correlation, the auditory and visual SRTs in surfing are not directly associated with performance, but they serve as parameters, showing that in-dividuals or athletes who have low SRTs may present good
physi-cal fitness. Lowdon(33) reports that professional surfers have SRTs
similar to professionals from other sports and that they have aero-bic capacity similar to swimmers and marathoners. On the other hand, in some sports such as swimming, the SRT is closely related
to performance. Maglischo(34) reports that starts in sprint
competi-tions represent respectively 10% and 5% of the total time of these competitions. In athletics, some authors disagree on the reaction
time importance during the starts. Amadio(35) studied the reaction
time in athletes of this modality where the reaction time mean verified was 0.220 (s), finding a positive and significant correlation between the athletic result and the reaction time. Nevertheless,
Paradisis, Zacharogiannis and Tziortzis(36) also investigated the
re-TABLE 3
Spearman correlation test between the auditory and visual SRTs and athletes’ performance
Samples x performance Spearman correlation test (p ≤≤≤≤≤ 0.05)
Auditory RT Visual RT
r p r p
WQS x Ranking –0.089 0.679 0.269 0.204
WQS x Phase –0.033 0.878 –0.147 0.494
Male SuperSurf x Ranking 0.203 0.390 –0.025 0.915
Male SuperSurf x Phase –0.248 0.291 0.266 0.256
Fem. SuperSurf x Ranking 0.645 0.032(*) 0.264 0.432
Fem.SuperSurf x Phase 0.599 0.051 0.314 0.347
CCSU x Ranking –0.266 0.337 –0.413 0.126
CCSU x Phase –0.405 0.134 –0.600 0.018(*)
* ”p” values in which correlations are significant.
DISCUSSION
The physiological processes of transformation of auditory and visual stimulus in motor response are identical in all sports modal-ities; the differential is in the final product, which is the mechanics of movement, that is, the muscular groups that are recruited in the performance of some tasks. The SRTs are associated to the
au-tomatization of the sports gestures. Hascelik et al.(23), when
study-ing physical trainstudy-ing over the auditory and visual reaction times in volleyball athletes, did not find significant differences, although having identified smaller reaction times after training period than
before training. Chmura, Nazar and Kaciuba-Uscilko(24), reported that
elite athletes are able to keep psychomotor skills, that is, they do not increase the SRTs when submitted to aerobic exertion tests.
In another study, Bhanot and Sidhu(25), investigated hockey
ama-teur athletes and found statistically significant differences between the auditory and visual SRTs of the players who are in different positions on the field. The values found of 0.196 to 0.299 (s) are similar to the ones found in this research and corroborate the rela-tionship between the SRT and specificity in training.
In table 1 analysis, it can be seen that the lowest SRTs were found among the male and female professional athletes, conse-quently the most skilled individuals in surfing practice. Lowdon
and Patemam(12), compared the visual SRTs between male and
fe-male professional surfers with Physical Education students. The researchers found respectively 0.198 (s); 0.197 (s) and 0.225 (s). These values were similar to the ones in this research, also show-ing that individuals who have high level motor skill have lower SRTs.
Bhanot and Sidhu(26), studied hockey players, Olympic athletes,
signifi-74e
Rev Bras Med Esporte _ Vol. 13, Nº 2 – Mar / Abr, 2007action time in athletics’ athletes in which none significant correla-tion was found between the reaccorrela-tion times and athletic perfor-mance.
The most important aspects in this research were the SRTs val-ues identified in the professional athletes who won the competi-tions. It was verified that in the world male professional champion-ship (WQS), the lowest auditory SRT was exactly the one from the winner of the phase. In the Brazilian male professional champion-ship (SuperSurf), the lowest visual SRT was also from the winner of the event, and in the female professional championship, the three first positions were taken by the three lowest auditory sim-ple reaction times. Thus, although statistical evidence from only one positive correlation has been found (table 3), these results call attention to a possible relationship with performance, either
psy-chologically or physiologically. White et al.(37) found a correlation
between reaction time and the index of falls in older individuals. Researchers concluded that some physical tests might determine risk groups for these fractures. Likewise, the SRT may be used in order to evaluate the concentration level of the athletes in a com-petition, since in high-performance sport the athlete is many times
overwhelmed by the psychophysical load(38) that directly affects
his / her physical skills and consequently performance.
Although athletes who won the competitions have had the low-est SRTs, the statistical calculation shows only a significant
corre-lation, with a reasonable coefficient. Yakut(39) reports that the
reac-tion time and some physical capacities such as the movement time, are independent variables. Therefore, it is not possible to predict movement performance through the reaction time interpretation.
CONCLUSION
Statistically significant differences were found for the auditory and visual SRTs between male professional and surfing practitio-ners and female professional versus practitiopractitio-ners. Concerning amateurs versus practitioners, significant differences were only found for the visual SRT. A positive and statistically significant cor-relation was found for the auditory SRT between female profes-sional athletes and their respective positions in the ranking. A neg-ative correlation was also found for the visual SRTs between university amateur athletes and their respective classifications in the phase. However, only the positive correlation is relevant, since it shows there is a functional relationship between the SRTs and performance.
All the authors declared there is not any potential conflict of inter-ests regarding this article.
REFERENCES
1. Magill RA. Aprendizagem motora conceitos e aplicações. São Paulo: Edgard Blücher, 2000.
2. Schmidt RA, Wrisberg CA. Aprendizagem e performance motora. 2a ed. Porto
Alegre: Artmed, 2001.
3. Guyton AC. Tratado de fisiologia médica. 8a ed. Rio de Janeiro: Koogan, 1992.
4. Bear MF, Connors BW, Paradiso MA. Neuroscience: exploring the brain. Balti-more: Williams & Wilkins, 1996.
5. McArdle WD, Katch FI, Katch VL. Fisiologia do exercício, energia, nutrição e desempenho humano. Rio de Janeiro: Afiliada, 1998.
6. Christina RW, Rose DJ. Premotor and motor reaction time as a function of re-sponse complexity. Res Q Exerc Sport. 1985;56:306-15.
7. Kimura K, Imanaka K, Kita I. The effects of different instructions for preparatory muscle tension on simple reaction time. Hum Mov Sci. 2002;21:947-60. 8. Vaghetti CAO, Biehl Jr FP, Roesler H. Análise comparativa da flexibilidade nas
articulações do tornozelo da frente e de trás em praticantes de surfe através de coordenadas espaciais. In: Duarte MFS, editor. Congresso Brasileiro de Ativida-de Física e SaúAtivida-de 2001: Anais do 3º Congresso Brasileiro Ativida-de AtividaAtivida-de Física e Saúde; 2001 nov 15-7; Florianópolis, Brasil: UFSC, 2001; 110.
9. Lowdon BJ, Bedi JF, Horvath SM. Specificity of aerobic fitness testing of surf-ers. Aust J Sci Med Sport. 1989;21:7-10.
10. Lowdon BJ, Lowdon M. Competitive surfing a dedicated approach. Victoria: Mou-vement Publications, 1988.
11. Meir RA, Lowdon BJ, Davie AJ. Heart rates and estimated energy expenditure during recreational surfing. Aust J Sci Med Sport. 1991;23:70-4.
12. Lowdon BJ, Pateman NA. Physiological parameters of international surfers. Aus-tralian Journal of Sports Medicine. 1980;12:34-9.
13. Bez FM. Análise crítica do treinamento dos surfistas amadores de Santa Catari-na [Monografia]. Florianópolis (SC): Universidade do Estado de Santa CatariCatari-na, 1998.
14. Andrade MC. Um estudo da prática da preparação física dos surfistas [Monogra-fia]. Florianópolis (SC): Universidade do Estado de Santa Catarina, 1994.
15. Rosa FA. Rotina de treinamento utilizada pelos surfistas de Santa Catarina. In: Schild JFG, Gonçalves AK, editores. Simpósio Nacional de Educação Física 2000: Anais do 19º Simpósio Nacional de Educação Física; 2000 nov 7-10; Pelotas, Brasil: UFpel, 2000; 228.
16. Lowdon BJ, Mourad A, Warne P. Sports message for competitive surfers. Sports Health. 1990;9:25-8.
17. Brasil FK, Andrade DR, Oliveira LC, Ribeiro MA, Matsudo VKR. Freqüência car-díaca e tempo de movimento durante o surfe recreacional – Estudo-piloto. Re-vista Brasileira de Ciência e Movimento. 2001;9:65-75.
18. Vaghetti CAO, Aranha EE, Borges Jr NG, Roesler H. Desenvolvimento de equi-pamento para estudo do tempo de reação de atletas em provas de natação. In: Guimarães ACS, Lima CS, Loss JF, Souza JL, Kruel LFM, Vaz MA, et al. editores. Congresso Brasileiro de Biomecânica 2001: Anais do 9º Congresso Brasileiro de Biomecânica, 2001 maio 29-31; Gramado, Brasil: UFRGS, 2001(1); p. 183-5.
19. Cio-das-16 /JR. User’s manual: Manual técnico da placa de aquisição de dados. Computer Boards Inc. Revision 5; 1994.
20. Silva LM, Zaro MA. Sad 2 Versão (3.0) Sistema de aquisição de dados: manual de operação. Caderno Técnico de Engenharia Mecânica CT 07, DEMEC: Porto Alegre, 1997.
21. Gignac GE, Vernon PA. Reaction time and the dominant and non-dominant hands: an extension of Hick’s law. Personality and individual Differences. 2004;36:733-9.
22. Behm DG, Bambury A, Cahill F, Power K. Effect of acute static stretching on force, balance, reaction time, and movement time. Med Sci Sports Exerc. 2004; 36:1397-402.
23. Hascelik Z, Basgoze O, Turker K, Narman S, Ozker R. The effects of physical training on physical fitness tests and auditory and visual reaction times of volley-ball players. J Sports Med Phys Fitness. 1989;29:234-9.
24. Chumura K, Nazar K, Kaciuba-Uscilko H. Choice reaction time during graded exercise in relation to blood lactate and plasma catecholamine thresholds. Int J Sports Med. 1994;15:172-6.
25. Bhanot JL, Sidhu LS. Reaction time of hockey players with reference to their field positions. J Sports Med. 1980;20:423-30.
26. Bhanot JL, Sidhu LS. Reaction time of Indian hockey players with reference to three levels of participation. J Sports Med. 1979;19:199-204.
27. Ando S, Kida N, Oda S. Central and peripheral visual reaction time of soccer players and nonathletes. Percept Mot Skills. 2001;92:786-94.
28. Mori S, Ohtani Y, Imanaka K. Reaction times and antecipatory skills of karate athletes. Hum Mov Sci. 2002;21:213-30.
29. Kida N, Oda S, Matsumurab M. Intensive baseball practice improves the go/ nogo reaction time, but not the simple reaction time. Cognitive Brain Research. 2005;22:257-64.
30. Vaghetti CAO, Martins ACV, Roesler H. Estudo do tempo de reação auditivo e visual em praticantes e atletas amadores de surfe. In: Krebs RJ, Machado Z, Zacaron D, Tremea VS, Soares KN, Tkac CM, et al., editores. Congresso Cientí-fico do Meeting UDESC 2002: Anais do 1º Congresso CientíCientí-fico do 6º Meeting UDESC; 2002 setembro 4-8; Florianópolis, Brasil: UDESC, 2002; 199-203. 31. Grouios G. Ageing effects on reaction time. International Journal of Physical
Education. 1991;28:18-22.
32. Gottsdanker R. Age and simple reaction time. J Gerontol. 1982;37:342-8.
33. Lowdon BJ. Fitness requirements for surfing. Sports Coach. 1983;6:35-8. 34. Maglischo EW. Nadando ainda mais rápido. São Paulo: Manole, 1999.
35. Amadio AC. Estudo do tempo de reação e sua relação com o rendimento em provas de corrida de velocidade no atletismo. In: Amadio AC, editor. Congresso Brasileiro de Biomecânica 1992: 4º Congresso Brasileiro de Biomecânica; 1992 dez 2-4; São Paulo, Brasil: USP, 1992; 275-9.
36. Paradisis G, Zacharogiannis E, Tziortzis S. Correlation of reaction time and per-formance in 60 and 200m sprint running. Med Sci Sports Exerc. 2004;36:S310.
37. White KN, Gunter KB, Snow CM, Hayes WC. Impaired standing balance, reac-tion time, and hip strength are risk factors for hip-impact falls among older adults. Med Sci Sports Exerc. 2003;35:S334.
38. Weineck J. Treinamento ideal. 9a ed. São Paulo: Manole, 1999.