ISSN 0104-6632 Printed in Brazil
www.abeq.org.br/bjche
Vol. 29, No. 04, pp. 821 - 833, October - December, 2012
Brazilian Journal
of Chemical
Engineering
INVESTIGATION OF HYDRODYNAMICS AND
TRANSITION REGIME IN AN INTERNAL LOOP
AIRLIFT REACTOR USING CFD
H. Ghasemi
1and S. H. Hosseini
2*1Department of Chemical Engineering, University of Sistan and Baluchestan, Zahedan 98164–161, Iran. 2
Department of Chemical Engineering, Faculty of Engineering, University of Ilam, Ilam 69315–516, Iran. E-mail: [email protected]
(Submitted: September 29, 2011 ; Revised: February 15, 2012 ; Accepted: February 21, 2012)
Abstract - CFD modeling for an internal loop airlift reactor is developed for different superficial gas velocities, ranging from 0.015 to 0.073 m/s. Based on the presence of gas bubbles in the downcomer, three regimes can be generally classified as: no gas bubbles (I), stagnation of gas bubbles (II), and recirculation of gas bubbles into the riser (III). The aim of the study is to carefully investigate the regime transition from II to III by considering the gas distribution. In regime II, the CFD simulation results show that the gas holdup difference between the riser and the downcomer remains constant. Due to the transition from regime II to III, the gas holdup difference sharply increases and the ratio of gas holdup in the downcomer and riser changes between the two regimes. At a superficial gas velocity slightly lower than that of the transitional regime, a small amount of gas is dragged to the riser, while the behavior of the regime is similar to regime II. The computational results show that CFD can be used as an effective tool to provide information on the details of the transition regime in internal loop airlift reactors.
Keywords:Internal loop airlift reactor; Hydrodynamic; Circulating regime; CFD.
INTRODUCTION
Airlift reactors (ALRs) are one of the important classes of modified bubble columns. They have advantages over bubble columns due to the higher liquid circulation and higher intensity of turbulence (Chisti, 1989; Cao et al., 2007). The ALRs are widely used in chemical industries, biotechnological processes and wastewater treatment (Jianping et al., 2005; Gouveia et al., 2003; Vial et al., 2001; Couvert
et al., 2001). Simple construction, low power con-sumption for agitation and aeration, high efficiency of homogenization and relatively constant as well as mild shear stress throughout the reactor are the advantages of airlift reactors compared to other gas– liquid contacting devices (Vial et al., 2001; Couvert
et al., 2001; Jin et al., 2006).
ALRs are classified as internal and external loop reactors. In the present study, the hydrodynamics of an internal loop airlift reactor are numerically investigated. An internal loop airlift reactor (ILALR) includes a vertically central tube installed along the bubble column axis. The gas–liquid mixture moves upwards in the riser and the liquid moves downwards through the downcomer, although a part of the gas can be entrained into the downcomer.
Some experimental studies (Couvert et al., 1999; Lu et al., 2000; Contreras et al., 1998) on ILALRs have been conducted to investigate the gas holdup and liquid circulation behavior and many empirical correlations have been proposed to estimate them. These correlations are typically suitable for specific reactor geometries, special operating conditions, and quasi–water fluids. Chisti (1989) and Jin et al. (2006) give comprehensive reviews of these concepts.
Computational fluid dynamics (CFD) has emerged as an effective tool to investigate gas–liquid ILALRs hydrodynamics (Mudde and van den Akker, 2001; Oey et al., 2001; van Baten et al., 2003; Blazej
et al., 2004a; Talvy et al., 2007; Huang et al., 2007). Mudde and van den Akker (2001) simulated an ILALR under steady state conditions at low superficial gas velocities using a two–fluid model (TFM). They investigated the effects of 2D (two– dimensional) and 3D models on the numerical results. They found that, for a given gas velocity, the average gas holdups in the riser for the 2D and 3D simulations are alike, while the liquid circulation rate in the 2D case is higher than that of the 3D case. They also showed that, for the lowest superficial gas velocities the LDA data coincide with the results of 2D simulations. However, for higher gas flow rates the LDA results switch towards the 3D results. Their results were proved by van Baten et al. (2003) and Talvy et al. (2007).
Sokolichin and Eigenberger (1999) simulated a bubble column in two and three dimensions for laminar and turbulent models in unsteady state conditions. Their experimental results confirmed the turbulent character of flow structure. They indicated that simulation results for the 2D laminar model strongly depended on grid resolution. They showed that, when the two–dimensional k–ε turbulent model is used, the value of the effective viscosity is overestimated by one order of magnitude. They also used the 3D k–ε model and their simulation results showed a good agreement with experimental data. Consequently, 3D simulation is necessary for solution of the k–ε turbulence model.
Van Baten et al. (2003) investigated two con-figurations of IALRs with the same riser diameter of 0.1 m and different downcomer diameters in unsteady state conditions. They observed that the frictional losses, which result in a higher volume of liquid phase recirculation, decrease with the increase of the downcomer diameter. A higher liquid recirculation leads to a smaller gas holdup. Investigating scale up effects, they found a significant increase in the liquid recirculation and a considerable reduction in the gas holdup.
Huang et al. (2007) developed a two–fluid model by considering a revised k–ε turbulence model. Their model was applied for simulation of two–phase bubbly flow inside an internal airlift loop reactor at full 3D framework in the steady–state. Their numerical results were compared to the experimental
data obtained by van Baten et al. (2003) by
considering conditions such as average gas holdup and liquid velocity in both the riser and downcomer. The results showed a good agreement between the computational and experimental data. The turbulent dispersion in the model had a strong effect on the gas holdup distribution. Their model also predicted wall– peaking behavior.
In the previous studies, most of the simulations have been done at low superficial gas velocity. Gas holdup in the downcomer is zero for low superficial gas velocity and the ILALR operates in regime I. However, Oey et al. (2001) and Blazej et al. (2004a) investigated circulating regimes in the ILALR using CFD tools. Oey et al. (2001) investigated a three-phase mixture in an ILALR based on the two– dimensional Euler–Euler approach. They observed three circulating regimes based on the presence of gas bubbles in the downcomer for a wide range of superficial gas velocity. However, their simulation suffers from a lack of experimental data in order to validate the theoretical results of the model.
Blazej et al. (2004a) simulated an ILALR using a two–dimensional Euler–Euler approach under unsteady state conditions for six inlet superficial gas velocities. They observed that, at the superficial gas velocity of 0.02 m/s, the variation of the liquid velocity in the riser and downcomer is high and low, respectively. The simulation results demonstrated that there is a sharp increase in the liquid velocity at Ug=0.02 m/s and a decrease in the liquid velocity at
superficial gas velocities higher than 0.02 m/s. Their results showed that the circulating regime in the reactor changes at superficial gas velocities higher than Ug=0.02 m/s and gas bubbles entrain into
the downcomer. Therefore, the accuracy of the simulation results decreased with the increase of the superficial gas velocity. Hence, their model predicted inaccurate results for gas holdup in the downcomer region.
Investigation of Hydrodynamics and Transition Regime in an Internal Loop Airlift Reactor Using CFD 823
and continuous phases, respectively. The turbulence
model of the mixture is determined by the k–ε
equation. Gas holdup in the downcomer is a major parameter for identification of circulation in the ILALR. In the current paper, we focus on the distribution of gas bubbles in the downcomer to identify the transition regime from II to III. Finally, the simulation results are compared with the experimental data obtained by Vorapongsathorn
et al. (2001) to validate the CFD model presented. The results showed that the accuracy of the gas holdup in the downcomer is higher than that of the results of Blazej et al. (2004a).
Circulating Regime in the ILALRs
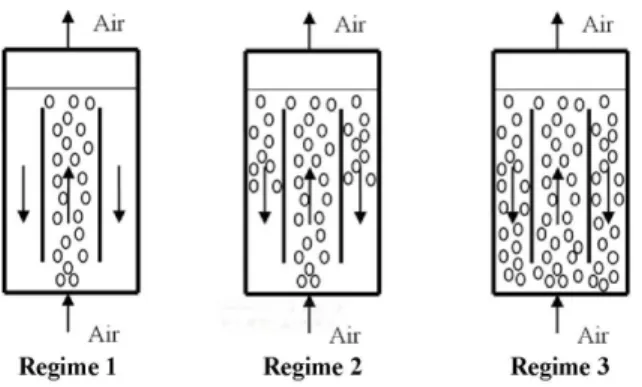
Heijnen et al. (1997) recognized three regimes based on the liquid circulation velocity in ILALR and observed the presence of gas bubbles, i.e., holdup, in the downcomer (Figure 1).
Figure 1: Circulation regimes in an ILALR versus the presence of gas bubbles in the downcomer.
Regime I: at low superficial gas velocities, no gas bubbles enter the downcomer. In this case, the liquid velocity in the downcomer is not high enough to drag the gas bubbles into the downcomer. In this regime, when the superficial gas velocity increases, the liquid circulation velocity increases rapidly.
Regime II: The gas bubbles are carried into the downcomer by the liquid phase. Because the liquid and gas bubbles slip velocities are almost the same, the bubbles will remain still in place. In this state, the gas velocity may increase while the liquid velocity remains in the changeless state because the driving force for liquid velocity (αgR–αgD) is relatively constant. By a slight increase in the superficial gas velocity, the gas holdup in the downcomer increases due to the downward movement of the gas bubbles. The gas bubbles may move down to the lower edge of the riser, but do not enter it.
Regime III: The liquid velocity in this regime is higher than the slip velocity of the gas bubbles; this leads to entraining the gas bubbles in the downcomer and they move to the riser with the liquid phase. The liquid velocity increases upon increasing the superficial gas velocity due to the increase in the driving force for liquid circulation (αgR–αgD). Therefore, gas holdup in the riser is higher than that of the downcomer.
Van Benthum et al. (1999) investigated regimes II and III based on the difference between the gas holdups in the riser and downcomer. The gas holdup difference between the riser and downcomer (αgR–αgD), as well as the ratio of them (αgR/αgD) in those regions, are the useful and simple parameters frequently used by researchers to identify the circulating regime (van Benthum et al., 1999; Blazej
et al., 2004b).
Van Benthum et al. (1999) plotted a graph of the gas holdup difference between the riser and downcomer versus the superficial gas velocity. They observed a variation in the slope of the gas holdup difference between the riser and downcomer for a specific superficial gas velocity. Furthermore, the circulating regime also changes from regime II to regime III. They stated that at this point the bubble flow shifts to churn turbulent flow (CTF). In CTF, the large bubbles appear in the riser and a size distribution of the bubbles diameters is established.
TWO FLUID MODEL
The most important characteristics of a multiphase flow are the existence of an interface separating the phases and the associated discontinuities of properties across the phase interface (Joshi, 2001). Modeling of the two phases flow includes the set of momentum and mass equations and interaction between them by considering the empirical exchange momentum. The Euler–Euler approach is used for numerical solution of the governing equations. Furthermore, mass transfer between the two phases and bubble coalescence and breakage are not considered. Each phase is mathematically treated as an interpenetrating con-tinuum that is characterized by volume fractions (α). The sum of the volume fractions for the two phases is equal to one.
The continuity equation for phase q is given by:
q=l, g (1)
The momentum equation for phase q is given by:
q q q
q q q q q q q
n
q q pq p q lift,q vm,q
p l
( u )
.( u u ) P .
t
g M (u u ) F F
=
∂ α ρ
+ ∇ α ρ = −α ∇ + α ∇ τ ∂
+α ρ +
∑
− + +(2)
q
τ is the stress tensor of phase q. In the current study, the gas and liquid (water) are assumed to be an ideal state and to undergo incompressible flow, respectively. Therefore τq can be written as follows (Bird et al., 1976):
T q q ,eff( uq u )q
τ = μ ∇ + ∇ (3)
q u
∇ and ∇uTq are the velocity gradient tensor and the transpose of the velocity gradient tensor, respectively.
The inter–phase momentum exchange coefficient between phase g and l can be expressed by:
q p p pq
p f M =α α ρ
τ (4)
pq qp
M = −M (5)
where f C ReD 24
= is the drag function and τp is the
particulate relaxation time that is defined as:
2 p p p q d 18 ρ τ =
μ (6)
where dp is the diameter of the bubbles of phase p.
Therefore, the momentum exchange due to drag force is defined as follows:
D
drag q p p p q p q
p
3 C
F ( ) (u u ) u u
4 d
= α α ρ − − (7)
For determining the drag force, it is necessary to calculate the drag coefficient (CD). In this study, the
drag coefficient is calculated by the Schiller and Naumann model (Schiller and Naumann, 1935).
0.687 D
24
(1 0.15 Re ) Re 1000
C Re
0.44 Re 1000
⎧ + ≤ ⎫
⎪ ⎪
= ⎨ ⎬
⎪ > ⎪
⎩ ⎭
(8)
The relative Reynolds number is given by:
q p q p
q
u u d
Re=ρ −
μ (9)
In this model, air bubbles are considered to be uniform in size and spherical in shape. The bubble should be small enough to be treated as a spherical shape. In addition, the mean bubble diameter considered is equal to 2 mm.
Talvey et al. (2007) showed that added mass has a negligible role in simulation of the ALRs; therefore, this factor is neglected in this study. Besides, the drift force may influence the local hydrodynamic gas holdup in the CFD simulation (Talvey et al., 2007). This investigation was motivated by the need for the prediction of flow regimes in ILALRs using CFD. Therefore, the effect of drift velocity is neglected in the current CFD model.
TURBULENCE MODEL
The velocity, u, in the turbulent flow is decomposed into a mean value, u , and a fluctuating component, u′. The fluctuating velocity is due to the fluctuating transfer of quantities such as momentum and energy. The velocity in the turbulent flow is defined as follows:
u= +u u′ (10)
where u is determined by:
t 0 1 u u(t)d(t) t Δ =
Δ
∫
(11)In the present study, the k− ε turbulent model for the mixture of phases is utilized. The k− ε model is a two–equation model that is able to determine the turbulent velocity scale, ν, and length scale, ℓ. The velocity and length scale are obtained as follows:
v= k (12)
3 2 k
= ε
A (13)
Investigation of Hydrodynamics and Transition Regime in an Internal Loop Airlift Reactor Using CFD 825
2
m,t m m
k
C vμ Cμ
μ = ρ = ρ ε
A (14)
2
q,t q
k Cμ
μ = ρ
ε (15)
q,eff q,lam q,t
μ = μ + μ (16)
The velocity and density parameters of the mixture of two phases are calculated from the following equations:
l l l g g g
m
m
u u
u =α ρ +α ρ
ρ (17)
m l l g g
ρ = α ρ + α ρ (18)
where k and ε are the turbulence kinetic energy and its rate of dissipation, respectively, which are determined by Eqs. (19) and (20):
m,t k
m m m,i
i i i
k,m b,m m
( ) k
( k) ( u k)
t x x x
G G ( )
μ
⎡ ∂ ⎤
⎢ ⎥
∂ ρ + ∂ ρ = ∂ ⎢ σ ⎥
∂ ∂ ∂ ⎢ ∂ ⎥
⎢ ⎥
⎣ ⎦
+ + − ρ ε (19)
m,t
m m i
i i i
2
1 k,m 3 b,m 2 m
( )
( ) ( u )
t x x x
C (G C G ) C ( )
k k
ε
ε ε ε
μ ⎡ ∂ε⎤
⎢ ⎥
∂ ρ ε + ∂ ρ ε = ∂ ⎢ σ ⎥
∂ ∂ ∂ ⎢ ∂ ⎥
⎢ ⎥
⎣ ⎦
ε ε
+ + − ρ
(20)
k,m
G is the generation turbulent kinetic energy due
to the mean velocity gradient and it is determined by:
i
k,m m m,i m, j
j ( u )
G u u
x
∂ ′ ′ = −ρ
∂ (21)
where −ρum,i m, j′ u′ represents the Reynolds stresses. Boussineq stated that the stress Reynolds can be related to the mean rate of deformation (Versteeg and Malalasekera, 1995).
m, j m,i
m,i m, j m,t
j i
u u
u u ( )
x x
∂ ∂ ′ ′
−ρ = μ +
∂ ∂ (22)
where G is the turbulent kinetic energy generated b by buoyancy in the presence of gravity force and a temperature gradient. In this work, G is neglected b in Equation (19) by considering an isothermal system. The values of the constant parameters in the turbulence equations are Cμ=0.09,σ = σ =k 1, ε 1.3,
1 2
Cε=1.44,C ε=1.92.
MODEL SOLUTION PROCEDURE
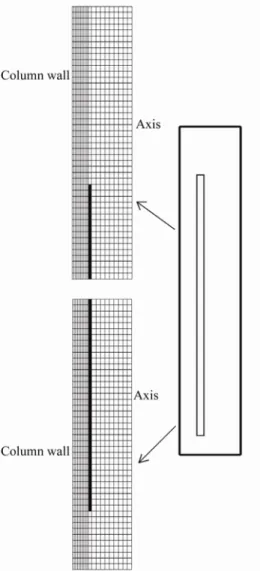
The ILALR operated by Vorapongsathorn et al. (2001) was selected for studying the hydrodynamic behavior of the column in this study. The schematic view of the reactor is shown in Figure 2. The simulations were developed in a 3D framework and,
to decrease the computational time, 1
4 of the ILALR geometry was chosen. Thus, a symmetrical boundary condition on both sides of the selected volume of the column was also considered. The axis is assumed to be axially symmetric. Since the mesh resolution affects the downcomer gas holdup (Blazej et al., 2004), the grid independency was verified. To get a mesh size–independent solution, it was found that mesh sizes of 5 mm for radial, azimuthal and axial directions showed relatively mesh-independent and satisfying results. The total number of CFD cells is 57240. Grid distribution in the computational domain of the ILALR is illustrated in Figure 2. In addition, the details of reactor geometry are provided in Table 1.
Figure 2: Configuration of the reactor and grid distribution.
Table1: ILALR details for the ILALR presented by Vorapongsathorn et al. (2001).
DC (m)
DRi (m)
DRo (m)
HDT (m)
HB (m)
HL (m)
ILALR 0.137 0.093 0.1 1 0.05 1.045
The pressure–velocity coupling was realized by the SIMPLE algorithm. The first order upwind discretization scheme was used for the momentum, turbulence, and volume fraction. After the initial instability of the solution, the second order upwind for the momentum and turbulence terms, as well as the Quick scheme for the volume fraction, were utilized to increase the accuracy of the solution. For the time discretization, the first order implicit scheme was used because of the sufficient accuracy of its results in the ALRs (Sokolichin and Eigenberger, 2004).
RESULTS AND DISCUSSION
In this section, the experimental results obtained
by Vorapongsathorn et al. (2001) in an ILALR
configuration without the baffle and the geometry described in Table 1 are adopted to validate the CFD model and to predict the flow regimes. The simulations were carried out for superficial gas velocities ranging from 0.015 to 0.073 m/s.
Figure 3 shows the time–averaged gas holdup in the riser versus the superficial gas velocity. As shown in the figure, the predicted results are lower than the corresponding experimental data for the time-averaged gas holdup. The accuracy of the numerical results at low superficial gas velocities is better than that for high superficial gas velocities. The gas holdup in the riser increases linearly upon increasing the superficial gas velocity.
Figure 3: Average of the riser gas holdup vs. superficial gas velocity: Experimental data of Vorapongsathorn et al. (2001) (□) and CFD result (▲).
Investigation of Hydrodynamics and Transition Regime in an Internal Loop Airlift Reactor Using CFD 827
gas bubbles remain stagnant in the downcomer, the reactor will operate in regime II. Regime III occurres when the gas bubbles move down in the downcomer and then enter the riser.
Figure 4: Average of the downcomer gas holdup vs. the superficial gas velocity: Experimental data of Vorapongsathorn et al. (2001) (□) and CFD result (▲).
In regime II, the gas holdups for both the riser and the downcomer increase at the same rate whereas in regime III the increase in the rate of gas holdup in the riser is much more than that of the downcomer. This causes a change in the slope of increase of the gas holdup in the riser and downcomer for superficial gas velocities higher than 0.042 m/s (Figs. 3 and 4). Therefore, the regime change from II to III can be seen in Figs. 3 and 4. In addition, the results of Figs. 3 and 4 show that the gas holdup in the riser and downcomer in regime II developed faster than that of regime III in both the experimental and computational results.
The driving force for liquid circulation in the ILALR is the difference between the gas holdups in the riser and downcomer. In addition, investigation of this parameter is important for regime identifica-tion (van Benthum et al., 1999; Blazej et al., 2004b). The gas holdup differences between the riser and downcomer at the superficial gas velocities used is shown in Figure 5. The gas holdup difference is relatively constant for superficial gas velocities lower than 0.042 m/s, which indicates that the ILALR operated in regime II. For higher superficial gas velocities, the gas holdup difference increases since the gas bubbles entrain from the downcomer to the riser. This accentuates the growth of the gas holdup in the riser compared to the downcomer for regime III.
Figure 6 shows a comparison between the computational and experimental data for the gas
holdup ratio in the downcomer and riser for various superficial gas velocities. From Figure 6, a sudden change in the slope of the gas holdup ratio in the downcomer and riser is observed at the superficial gas velocity of 0.042 m/s. The slope of the ratio
αgD/αgR increases in regime II and decreases after reaching the maximum value. In regime III, the gas bubbles move downward into the downcomer and then return to the riser in a continuous cycle. This causes a faster increase of the gas holdup in the riser than in the downcomer. Finally, the ratio of gas holdup decreases in regime III. The maximum value of the ratio is identified in Figure 6 as the regime transition.
Figure 5: The gas holdup difference between the riser and downcomer vs. the superficial gas velocity: Obtained from experimental data of Vorapongsathorn
et al. (2001) (□) and CFD result (▲).
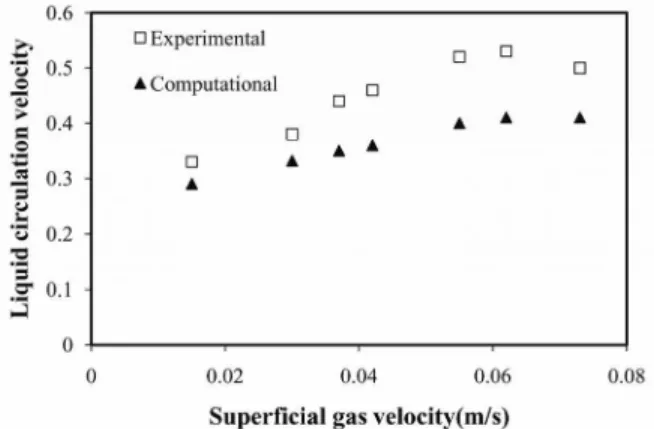
Figure 7 shows a comparison between the CFD results and experimental data for the liquid circulation velocity. As can be seen, the liquid circulation velocity increases upon increasing the superficial gas velocity. Enhancement in the gas holdup difference between the riser and the downcomer by increasing the superficial gas velocity leads to a bulk density difference in these two regions, which is a driving force for the liquid circulation in the reactor. Although the augmentation of the superficial gas velocity increases the gas holdups difference, the liquid circulation velocity for a superficial gas velocity higher than 0.055 m/s is relatively constant (regime III). This shows that the liquid circulation velocity is affected by changing the circulating regime. As a conclusion from Figs. 3, 4, 5, 6 and 7, unlike both terms (αgR–αgD) and (αgR/αgD), the liquid circulation velocity is not an accurate parameter for prediction of the regime transition from II to III. The liquid circulation velocity is affected by reactor geometry (Chisti, 1989), which is left for future CFD studies. The maximum error between the experimental data and the CFD simulation is 22%. In addition, Talvy et al. (2007) showed that the liquid velocity is directly related to the bubble velocity and drag modeling.
Figure 7: Overall liquid circulation velocity vs. the superficial gas velocity: Experimental data of Vorapongsathorn et al. (2001) (□) and CFD result (▲).
Distribution of Gas Holdup
Figure 8 presents the gas holdup distributions for the superficial gas velocities of 0.015, 0.03 and 0.062 m/s. To enhance the clarity, the calculated gas distribution (the gas volume fraction) is shown in Figs. 8(a), (b) for two sections of the column, i.e., the lower and upper part of the reactor, respectively. The
calculated gas volume fraction, in the range of 0–0.05, is shown in Figure 8(c) for the bottom section of the reactor.
The gas phase enters the bottom of the reactor with its highest volume fraction (α =g 1). Thus, the maximum value of the gas distribution at the bottom of the reactor is attained at the entrance of the riser (Figs. 8(a), (c)). Because of the entrance of the gas bubbles into the riser and the intensity of the gas phase flow, gas holdup in the riser is higher than that in the downcomer (see Figures 8(a), (b)). In the upper part of the reactor, the momentum difference leads to separation of the gas and liquid phases. The reactor has a small space for separating the gas bubbles from the bulk liquid. Therefore, the bulk liquid in the downcomer has enough momentum to drag the gas bubbles into the downcomer. Consequently, the reactor does not operate in regime I under the operating conditions used. It is obvious in Figure 8(b) that the bed level increases with the increase of the superficial gas velocities. A wave is produced on the free surface where the two phases are separated. The intensity of the wave produced on the free surface is greater for higher superficial gas velocities. Motionless aggregation of the bubble swarms is produced for the three considered superficial gas velocities at the upper draft tube edge. From Figure 8(b) it can be seen that the bubble swarm observed in the upper part of the draft tube grows upon increasing the superficial gas velocity. When the superficial gas velocity increases slowly, the aggregation of gas bubbles moves downward in the downcomer, which increases the gas holdup in the downcomer.
Investigation of Hydrodynamics and Transition Regime in an Internal Loop Airlift Reactor Using CFD 829
Figure 8: Gas distribution in the airlift reactor for various gas velocities (a): From the bottom to a height of 0.6 m).
Figure 8: (b): From a height of 0.6 m to 1.2 m).
Figure 8: (c): From the bottom to a height of 0.1 m for gas holdup in the range of 0–0.05).
The gas volume fraction in the low range of 0–0.05 in the column is illustrated in Figure 8(d) for the height of 0.2 to 0.6 m from the bottom of the reactor for three different superficial gas velocities. The gas distribution in the downcomer is more uniform for higher superficial gas velocity than for lower ones. The gas holdup is high in the part of the riser close to the internal draft tube partition, but decreases upon moving toward the center. The gas holdup reaches to
Figure 8: (d): From a height of 0.1 m to 0.6 m for gas holdup in the range of 0–0.05).
Furthermore, the gas bubbles flow from the downcomer to the riser by moving up the bulk liquid near the wall. Chisti (1989) stated that, as the gas distributes from the bottom of the column, a portion of the gas bubbles will move and canalize toward the
riser partition because the liquid passes over the gas distribution point.
Gas and Liquid Velocity Field
The liquid and gas velocity vectors at the superficial gas velocity of 0.03 m/s are shown in Figure 9 and Figure 10 for the bottom, middle and top sections of the reactor. In the riser, the gas velocity is higher than the liquid velocity, which causes entertaining of the liquid phase in the riser, moving both phases upward in this region. The gas and liquid are separated at the top of the column. The main part of the gas bubbles is taken out from the top of the column, while the liquid phase moves toward the downcomer, with creation of a big eddy. The liquid phase drags the gas bubbles into the downcomer and both phases move downward. Moreover, both phases change direction and create a big eddy in the bottom section of the reactor.
Figure 10 shows that the gas bubbles are slightly entrained from the downcomer into the riser. With respect to Figure 6, the regime behavior at a superficial gas velocity smaller than 0.042 m/s, is similar to regime II. Therefore, determination of the superficial gas velocity, giving us the regime transition point (a transition point between regimes II and III), is a difficult and complicated issue.
Figure 9: Liquid velocity vector for an inlet superficial gas velocity of 0.03m/s in two sections (a): The bottom of the reactor; (b): The top of the reactor).
Investigation of Hydrodynamics and Transition Regime in an Internal Loop Airlift Reactor Using CFD 831
CONCLUSIONS
In this paper, a 3D simulation of an internal loop airlift reactor (ILALR) was carried out under unsteady state conditions. The circulating regimes in the ILALR were investigated, and the following results were obtained:
In regime I, the gas bubbles did not entrain in the downcomer. The gas bubbles were only present in the column at the lowest superficial gas velocity. At the applied superficial gas velocity, gas bubbles are present in the downcomer; therefore, the reactor operated only in regimes II and III. In regime II, the gas bubbles were entrained into the downcomer and swarmed in the form of a large wake of bubbles at the upper edge of the draft tube. Furthermore, an aggregated bubble was observed at the bottom edge of the draft tube in flow regime II. The gas holdup difference between the riser and downcomer remained constant. More gas bubbles were entrained into the downcomer and the gas holdup in this region increased upon increasing the superficial gas velocity.
In regime III, the gas bubbles move downward with the liquid phase and entrain from the downcomer to the riser. A larger superficial gas velocity may lead to an increase in the gas holdup in the riser compared to the gas holdup in the downcomer.
In regime II, the gas distribution at the superficial gas velocity of 0.03 m/s shows the existence of gas bubbles at the lower edge of the draft tube that tend to be dragged from the downcomer into the riser. It was found that the amount of entrained gas bubbles is not enough to characterize regime III at this superficial gas velocity. In addition, the gas holdup difference does not vary at this superficial gas velocity. In addition, the circulating regime turns from II to III when the superficial gas velocity ranges from 0.042 to 0.55 m/s.
The CFD results show that the best parameters for identification of the regime transition from II to III are the gas holdup ratio in the downcomer and riser, as well as the gas holdup difference between the riser and the downcomer.
NOMENCLATURE
A Cross-sectional area m2
CD Drag coefficient (–)
C1 Constant in the k–ε
turbulence model
(–)
C2 Constant in the k–ε
turbulence model
(–)
Cµ Constant in the k–ε
turbulence model
(–)
d Bubble diameter m
D Diameter m
f Drag force N
Flift Lift force N m-3
Fvm Virtual mass N m
-3
g Gravitational acceleration m s-2
k
G Generation turbulent kinetic
energy
kg m-1 s-3
b
G Turbulent kinetic energy
generated by buoyancy
kg m-1 s-3
H Height m
k Turbulence kinetic energy m2 s-2
M Interphase momentum
exchange term
N m-3
P System pressure Pa
Re Reynolds number (–)
U Superficial velocity m s-1
u Quantity of velocity m s-1
u Mean velocity m s-1
u′ Fluctuating velocity m s-1
Greek Symbols
Holdup (–)
ρ Density of phase kg m-3
τ
Stress tensor N m-1µ Viscosity of the fluid phase Pa s
τp Particulate relaxation time s
v Velocity scale m s-1
A Length scale m
ε Dissipation rate m2 s-3
Subscripts
B Bottom section from the gas
sparger to the beginning of the riser tube
C Column D Downcomer
DT Draft tube
eff Effective
g Gas phase
q Phase q
l Liquid phase
L Unaerated liquid
lam Laminar
m Mixture phase
REFERENCE
Bird, R. B., Stewart, W. E. and Lightfoot, E. N., Transport Phenomena. John Wiley and Sons, New York, (1976).
Blazej, M., Glover, G. M. C., Generalis, S. C. and Markos, J., Gas–liquid simulation of an airlift bubble column reactor. Chemical Engineering and Processing, 43, 137 (2004a).
Blazej, M., Kisa, M. and Markos, J., Scale influence on the hydrodynamics of an internal loop airlift reactor. Chemical Engineering and Processing, 43, 1519 (2004b).
Cao, C., Dong, S. and Guo, Q., Experimental and numerical simulation for gas-liquid phases flow structure in an external-loop airlift reactor. Industrial and Engineering Chemistry Research, 46, 7317 (2007).
Chisti, M. Y., Airlift Bioreactors. Elsevier Applied Science, London/New York (1989).
Contreras, A., Chisti, Y. and Molina, E., A reassess-ment of relationship between riser and downcomer gas holdups in airlift reactors. Chemical Engineering Science, 53, 4151 (1998).
Couvert, A., Roustan, M. and Chatellier, P., Two-phase hydrodynamic study of a rectangular air-lift loop reactor with an internal baffle. Chemical Engineering Science, 54, 5245 (1999).
Couvert, A., Bastoul, D., Roustan, M. and Line, A., Chatellier, P., Prediction of liquid velocity and gas hold-up in rectangular air-lift reactors of different scales. Chemical Engineering and Processing, 40, 113 (2001).
Gouveia, E. R., Hokka, C. O. and Badino-Jr, A. C., The effects of geometry and operational conditions on gas holdup, liquid circulation and mass transfer in an airlift reactor. Brazilian Journal of Chemical Engineering, 20, 363 (2003). Heijnen, J. J., Hols, J., van der Lans, R. G. J. M., van
Leeuwen, H. L. J. M. and Mulder, A., Weltevrede, R., A simple hydrodynamic model for the liquid circulation velocity in a full-scale two and three-phase internal airlift reactor operating in the gas recirculation regime. Chemical Engineering Science, 52, 2527 (1997).
Huang, Q., Yang, C., Yu, G. and Mao, Z. S., 3-D simulations of an internal airlift loop reactor using a steady two-fluid model. Chemical Engineering and Technology, 7, 870 (2007). Jianping, W., Yu, C., Dongyan, C. and Xiaoqiang, J.,
Removal of ethyl acetate in air streams using a gas–liquid–solid three-phase flow airlift loop bioreactor. Biochemical Engineering Journal, 24, 135 (2005).
Jin, B., Yin, P. and Lant, P., Hydrodynamics and mass transfer coefficient in three-phase air-lift reactors containing activated sludge. Chemical Engineering and Processing, 45, 608 (2006). Joshi, J. B., Computational flow modeling and design
of bubble column reactors. Chemical Engineering Science, 56, 5893 (2001).
Jurascik, M., Blazej, M., Annus, J. and Markos, J., Experimental measurements of volumetric mass transfer coefficient by the dynamic pressure-step method in internal loop airlift reactors of different scale. Chemical Engineering Journal, 125, 81 (2006).
Lu, X., Ding, J., Wang, Y., Shi, J., Comparison of the hydrodynamics and mass transfer characteris-tics of a modified square airlift reactor with common airlift reactors. Chemical Engineering Science, 55, 2257 (2000).
Mudde, R. F. and van den Akker, H. E. A., 2D and 3D simulations of an internal airlift loop reactor on the basis of a two-fluid model. Chemical Engineering Science, 56, 6351 (2001).
Oey, R. S., Mudde, R. F., Portela, L. M. and van den Akker, H. E. A., Simulation of a slurry airlift using a two-fluid model. Chemical Engineering Science, 56, 673 (2001).
Schiller, L. and Naumann, Z., A Drag Coefficient Correlation. Z. Ver. Deutsch. Ing., 77, 318 (1935).
Sokolichin, A. and Eigenberger, G., Applicability of the standard k-ε turbulence model to the dynamic simulation of bubble columns: Part 1. Detailed numerical simulations. Chemical Engineering Science, 54, 2273 (1999).
Sokolichin, A. and Eigenberger, G., Simulation of buoyancy driven bubbly flow: Established simplifications and open questions. AIChE J., 50, 24 (2004).
Talvy, S., Cockx, A. and Line, A., Modeling hydrodynamics of gas–liquid airlift reactor. AIChE J., 53, 335 (2007).
van Baten, J. M. and Krishna, R., Comparison of hydrodynamics and mass transfer in airlift and bubble column reactors using CFD. Chemical Engineering and Technology, 1074 (2003). van Baten, J. M., Ellenberger, J. and Krishna, R.,
Hydrodynamics of internal air-lift reactors: Experiments versus CFD simulations. Chemical Engineering and Processing, 42, 733 (2003). van Benthum, W. A. J., van der Lans, R. G. J. M.,
Investigation of Hydrodynamics and Transition Regime in an Internal Loop Airlift Reactor Using CFD 833
Versteeg, H. K. and Malalasekera, W., An introduction to computational fluid dynamics: The finite volume method. Longman Scientific and Technical. (1995).
Vial, C., Poncin, S., Wild, G. and Midoux, N., A simple method for regime identification and flow
characterization in bubble columns and airlift reactors. Chemical Engineering and Processing, 40, 135 (2001).