ISSN 0104-6632 Printed in Brazil
www.abeq.org.br/bjche
Vol. 33, No. 03, pp. 469 - 478, July - September, 2016 dx.doi.org/10.1590/0104-6632.20160333s20150114
Brazilian Journal
of Chemical
Engineering
MODELING PARTICLE SIZE DISTRIBUTION IN
HETEROGENEOUS POLYMERIZATION SYSTEMS
USING MULTIMODAL LOGNORMAL FUNCTION
J. C. Ferrari
1,3, F. Castilhos
2, P. H. H. Araújo
3and C. Sayer
3*1Universidade do Estado de Santa Catarina, Department of Sanitary Engineering, Florianópolis - SC, Brazil. 2Universidade Federal de Santa Maria, Department of Chemical Engineering, Santa Maria - RS, Brazil.
3Universidade Federal de Santa Catarina, Department of Chemical Engineering and Food Engineering, Campus Trindade, CEP: 88010-970, Cx. P. 476, Florianópolis - SC, Brazil.
E-mail: [email protected]
(Submitted: February 25, 2015 ; Revised: May 19, 2015 ; Accepted: May 27, 2015)
Abstract - This work evaluates the usage of the multimodal lognormal function to describe Particle Size Distributions (PSD) of emulsion and suspension polymerization processes, including continuous reactions with particle re-nucleation leading to complex multimodal PSDs. A global optimization algorithm, namely Particle Swarm Optimization (PSO), was used for parameter estimation of the proposed model, minimizing the objective function defined by the mean squared errors. Statistical evaluation of the results indicated that the multimodal lognormal function could describe distinctive features of different types of PSDs with accuracy and consistency.
Keywords: Particle Size Distribution; Lognormal function; Parameter estimation; Particle Swarm Optimization; Heterogeneous polymerization.
INTRODUCTION
The particle size distribution (PSD) is one of the most important characteristics of polymer latexes/res-ins, since properties such as viscosity, maximum solids content, adhesion and drying time depend on the profile of this distribution (Vale and McKenna, 2005). Furthermore, the understanding of the dynam-ics of PSD is very important for process monitoring and final quality control of heterogeneous polymeri-zation processes (Hosseini et al., 2013). Therefore, PSD modeling has received great attention with the proposal of models such as Population Balance Equations (PBE) (Machado et al., 2000; Araújo et al., 2001; Kiparissides et al., 2002; Immanuel et al., 2002; Coen et al., 2004). However, according to Vale and McKenna (2005), even when these difficulties in
coagulation modeling are overcome, the PBEs are difficult to solve if they include kinetic and/or hydro-dynamic complete models. Despite recent advances in techniques for experimental determination, diffi-culties in determining important variables related to the quality and productivity of polymers still remain (Machado et al., 2007). In the case of PSD, these limitations are associated with the existence of poly-disperse distributions and the long times often re-quired for sample preparation and analysis.
polymerize-tion reacpolymerize-tions using CFD tools (Elgebrandt et al., 2006; Pohn et al., 2013). These alternatives require a model describing the PSD.
According to Limbert et al. (2001) the multi-modal lognormal function has proved to be efficient and flexible in describing wide or narrow, unimodal and multimodal distributions in many particulate systems applications.
This diversity of applications can be observed in works such as Zhao et al. (2003) who investigated the dynamics of soot particle size distributions. The numerical simulation using a kinetic model proposed previously and a stochastic approach to solve aerosol dynamics equations showed a bimodal soot particle size distribution function, the consequence of the interplay between particle-particle coagulation and particle nucleation. In this same respect, Johnsson et al. (2010) claimed that soot particle distributions generally consist of a range of different particle sizes, and the lognormal size distribution has been shown to be a good approximation for various flame conditions; Hwang and Choi (2006) investigated the predictive potential of the unimodal lognormal dis-tribution model for estimating the water retention curves, and this model was evaluated for a broader range of soil; Yuan et al. (2011) described the char-acteristics of atmospheric aerosols using a multi-lognormal distribution model with parameters esti-mated by Particle Swarm Optimization. The model was validated and analyzed by comparing with the measured optical properties of several bands; Pujol and Pinto (2011) approached fatigue life prediction under step-stress conditions by comparing a standard approach based on the lognormal distribution func-tion implemented and fit to experimental data, with an approach for fatigue life prediction from neural networks. Both models were optimized by differen-tial evolution associated to the Newton-Raphson-Method, using a maximum likelihood estimator.
Given the above, this paper aims to evaluate the use of a multimodal lognormal function to describe the behavior of particle size distributions in heteroge-neous polymerization systems, using a Particle Swarm
Optimization algorithm for parameter estimation.
MATERIALS AND METHODS
Experimental Particle Size Distributions
In order to evaluate whether the proposed multi-modal lognormal function was able to describe real PSDs, experimental PSDs of emulsion and suspen-sion polymerization reactions were used for the pa-rameter estimation of the multimodal lognormal function. The choice of the distributions used in this work was based on their different characteristics and on the existence of multimodalities.
The reaction techniques, monomer system, reac-tor type and operation mode of the experimental PSD used in this work are summarized in Table 1. Four PSDs (PSD01 to PSD04), among which there were unimodal and multimodal distributions, were ob-tained from the work of Araújo (1999). In short, this author investigated the effects of operational condi-tions (temperature, initiator and surfactant concentra-tions) on the PSD in an emulsion copolymerization of vinyl acetate/Veova10 in a continuous loop reactor with high solids content. The reactor pre-feeding with an aqueous (surfactant, protective colloid and Na2S2O5) and an organic phase (monomer mixture with vinyl acetate to Veova 10 weight ratio of 75/25) caused a fast increase of the particle number at the reaction beginning. As a consequence, the distribu-tions usually show a right skewness. The higher sol-ubility of the oligomeric radical in the aqueous phase, due to the vinyl acetate, affects the main “locus” of the polymerization, promoting re-nucleations.
Another PSD (PSD05) was obtained from the work of Zubitur and Asua (2001) which investigated the factors affecting kinetics and coagulation during the emulsion polymerization of styrene and butyl acrylate, in a semi-batch stirred tank reactor. The PSD showed some bimodality, a peak of small particles, probably resulting from secondary nucleation in the presence of seed particles (shoulder of bigger particles).
Table 1: Heterogeneous polymerization systems data.
Distribution Reactor type Reaction mode Polymerization technique
Monomer(s) Authors
PSD01, PSD02, PSD03, PSD04
Tubular loop Continuous Emulsion Vinyl acetate and Veova 10
Araújo (1999)
PSD05 Stirred tank Semi-batch Emulsion Styrene and butyl acrylate
Zubutar and Asua (2001)
PSD06 Stirred tank Semi-batch Emulsion Vinyl acetate and butyl acrylate
Mallikarjunan et al. (2010)
PSD07, PSD08 Stirred tank Batch Suspension Methyl Methacrylate
Mallikarjunan et al. (2010) studied the emulsion copolymerization of vinyl acetate and butyl acrylate, conducted in a semi-batch stirred tank reactor, and another PSD (PSD06) was utilized from the work of these authors. They report a bimodal PSD deter-mined with CHDF, since the system was fed with surfactant in excess.
In addition to the PSDs of emulsion polymeriza-tion reacpolymeriza-tions, PSDs of suspension polymerizapolymeriza-tion reactions of methyl methacrylate were also evalu-ated. These PSDs are available in the work of Ja-hanzad et al. (2004), and they were included in this work with the objective of investigating the adapta-bility of the multimodal lognormal function to other heterogeneous polymerization techniques. In this pa-per, the authors carried out extensive research on the influence of process variables (temperature, inhibi-tion, stabilizer and initiator concentrations, agitation) on the PSD in a batch stirred tank reactor. The distri-butions obtained by Jahanzad et al. (2004) are basi-cally unimodal. In general, some factors promoted the growth of the mean particle size and the broaden-ing of the distributions, such as the increase of the reaction temperature, decrease of the stirring rate, decrease of the stabilizer concentration and absence of inhibitor.
In order to normalize the distributions range, a numerical integration (trapezoid method) was used to calculate the area under each PSD. The different types of distributions (number/weight/volume den-sity distributions) of these reference works were nor-malized by the division of the PSD by the calculated area. In this way, the sum of the relative frequencies was equal to one for each PSD.
Multimodal Lognormal Function
The lognormal distribution is a model with two parameters, whose density function is expressed by Equation (1) (Crow and Shimizu, 1988):
2 1 ( , , ) .ln 2 ln ln 1exp , for 0
2 ln g g g g g f x x x x (1)
where x is the independent variable, g and g re-present the geometric mean and geometric standard deviation of the distribution, respectively.
For frequency distributions, xk values are weighted by their relative frequencies fk with k = 1, 2 ..., n. In this case, the geometric mean and geometric standard deviation can be defined by Equations (2) and (3), respectively (Crow and Shimizu, 1988):
1 1
1
ln ln( ) ln k
n n
f N
g k k k
k k
f x x
N
(2)
21
. ln( ) ln
ln
1 n
k k g
k g f x N
(3)where 1 n k k N f
is the absolute frequency.However, in real situations, these distributions can be composed of more than one mode, being bimodal, trimodal or even n-modal. In such cases, the function can be described by a weighted sum of lognormal functions (Zender, 2010). Equation (4) describes the multimodal lognormal function:
1
MLF( , , , ) . ( , , )
n
i i i i i i
g g g g
i
x w w f x (4)
where MLF x( , gi, ig,wi)is the Multimodal Lognor-mal Function; f x( , gi, ig) is the lognormal func-tion mode i; n number of modes and wi is the fraction
in mode i assuming 1 1 n i i w
.Taking into account the number of modes of the experimental distributions used in this work, the Bimodal Lognormal Function (BLF) and Trimodal Lognormal Function (TLF) were chosen for modeling experimental PSDs. Equation (5) provides a representation of the function used, with the particle diameter d as independent variable:
2 1ln( ) ln 1
( , , , ) .exp , for d 0
2
.ln 2 ln
n ig
i i i i
g g i i
g g
i
d w
MLF d w
d
Therefore, there were always five or eight pa-rameters to be estimated for BLF and TLF respec-tively, since there were three parameters to be esti-mated for each mode (lnig, lnigand wi).
Parameter Estimation
The parameter estimation procedure of the MLFs was supported by Particle Swarm Optimization (Kenn-nedy and Eberhart, 1995). This algorithm uses its in-telligent strategy to randomly minimize the objective function defined by the sum squared errors [SSE], according to Equation (6):
2exp 1
( )
n k
k k
SSE f MLF d
(6)where fexpk is the experimental frequency value in k; ( k)
MLF d is the frequency calculated by the multi-modal lognormal function in k and n is the number of experimental points.
In short, according to Yang (2014), the PSO strat-egy considers that a particle i in an interaction k, moves through the search space with two attributes: position (X) and velocity (V) vectors, represented by equations (7) and (8), respectively:
= X + V
Xik +1 ik ik (7)
1 1 2 2
Vik+1= wV + c r (P - X ) + c r (P - X ) ik ik ki gk ki (8)
where, Pik is the best previous position along the dth dimension of particle i in iteration kth, while Pgk is the best previous position among all the particles along the dth dimension in iteration kth.
According to Blum and Merkle (2008) the veloc-ity vector is determined by three terms: the “momen-tum”, the “cognitive”, and the “social” term. The “mo-mentum” term w.vi represents the previous velocity which is used to carry the particle in the direction it has travelled so far; the “cognitive” term c1r1(Plk – Xik), represents the tendency of the particle to return to the best position it has visited so far; the “social” term c2r2(Pgk –Xik), represents the tendency of the particle to be attracted towards the position of the best position found by the entire swarm. Parameters c1 and c2 are acceleration coefficients, while r1 and r2 are two independent random numbers uniformly dis-tributed in [0,1].
The procedure proposed by Jiao et al. (2008), which considers the implementation of the dynamic inertial weight (Equation (9)) as a way to control the particle momentum, weighing the contribution of the previous velocity and thus, basically controlling how much memory of the previous flight direction will influence the new velocity, was used in this work. In this way, algorithm parameters follow the references of Jiao et al. (2008) and Van den Bergh (2002) who investigated the convergence criteria of the algorithm.
0. k
ww u (9)
As this is a strategy that performs a random search, it is necessary to set upper and lower limits of the parameters to be adjusted. So, the limits of the parameters lng were defined from the limits of the diameter variable on a logarithm scale; in turn the limits of parameters lng were defined based on previous works on modeling of particle size distribution using the lognormal function (Limpert et al., 2001). Table 2 shows the employed search ranges, and the initial parameter estimates generated randomly from a uniform distribution, on the PSO.
Table 2: Search range for the MLFs parameters.
Parameter Search range
lng
3.2, 6.6
lng
0.01,0.6
w
0,1Two stopping criteria of the algorithm were used: the maximum number of iterations (8000) or evalua-tion of Equaevalua-tion (10):
4
8 1
<
10g z
z
E Y Y
(10)where Yg and Yzare, respectively, the best result found and the best z last results.
deviation values have no relationship with the confi-dence interval of the optimal parameter.
Statistical interpretation of the results was per-formed through the correlation coefficient [r] be-tween experimental and calculated frequency distri-butions. In addition, the Kolmogorov-Smirnov test was used to compare experimental frequency distri-butions with estimated frequency distridistri-butions. The Kolmogorov-Smirnov test and Chi-square test are widely used in the scientific literature and the first one is more efficient for continuous frequency distri-butions (Evren and Tuna, 2012).
RESULTS AND DISCUSSION
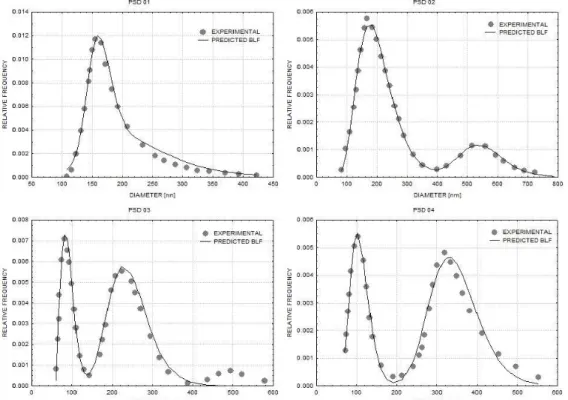
The first set of PSDs, PSD01 to PSD04, corre-sponds to the evolution during a continuous vinyl acetate/Veova 10 emulsion copolymerization reaction conducted in a tubular loop reactor. Due to succes-sive nucleations this reaction presents broad and often multimodal PSDs (Rawlings and Ray, 1988). This feature generates consequences for the determi-nation of the search interval of the parameter geo-metric mean. Besides, the positively skewed modes affect strongly the geometric standard deviation, mini-mizing it in this case.
Figure 1 compares the experimental PSDs with and PSDs predicted using a BLF. It may be observed that the BLF could fit nicely the broad monomodal and positively skewed distribution PSD01, as well as dif-ferent bimodal distributions with difdif-ferent mode lo-cations and relative fractions (PSD02 and PSD04). As expected, since the proposed model provides the generation of two modes, it was not able to represent all the three modes of PSD03. Nevertheless, even in this case the BLF was able to predict correctly the lo-cation, width and relative intensity of the two bigger particle populations, while the less significant mode of the distribution was ignored.
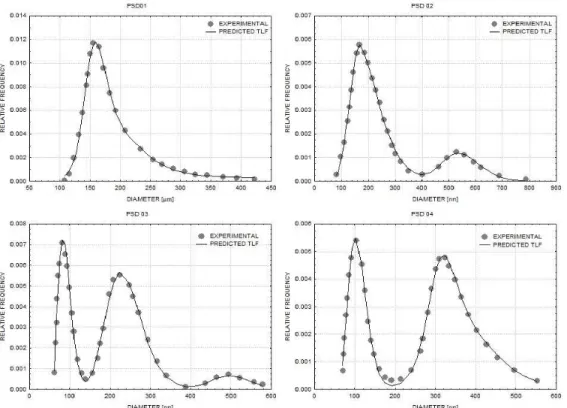
When a trimodal lognormal function (TLF) is used to represent the evolution of the PSD during this continuous emulsion polymerization reaction, Figure 2, the TLF fits perfectly the experimental dis-tributions, no matter if mono-, bi- or trimodal, show-ing better agreement than with BLF for all PSDs. This result is due to the higher number of parameters that ensures the representation of trimodal distri-butions and favors data fitting when the distribution is simpler and, thus, with overlapping modes, with very close parameters, favoring the parameter esti-mation procedure. The higher number of parame-ters, though, can lead to a high correlation among the TLF parameters.
Figure 1: Experimental (Araújo, 1999) and predicted PSDs of a continuous vinyl acetate Veova 10
Figure 2: Experimental (Araújo, 1999) and predicted PSDs of a continuous vinyl acetate Veova 10 emulsion copolymerization reaction in a loop reactor using a trimodal lognormal function (TLF).
Figure 3 compares the predictions of a TLF with the final experimental PSDs of semi-batch styrene/bu-tyl acrylate (PSD05, Zubitur and Asua, 2001) and vinyl acetate/butyl acrylate (PSD06, Mallikarjunan et al., 2010) emulsion copolymerization reactions and the TLF was able to predict correctly both bimodal PSDs, shoulder of bigger particles and two separate populations.
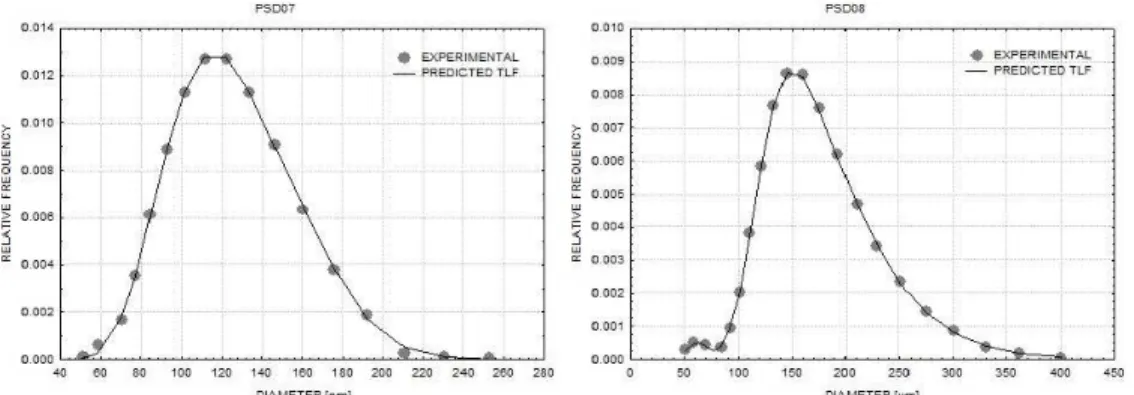
In order to verify the adaptability of the TLF to other heterogeneous polymerization techniques, this function was used to predict the PSDs of methyl methacrylate of suspension polymerization reactions
(PSD07 and PSD08, Jahanzad et al.,2004). Again the TLF predicted correctly both mono- as well as multi-modal PSDs, despite the different order of magnitude of the particle diameters and forms of the PSDs, when compared to those of the previously evaluated emulsion polymerization reactions.
Table 3 and 4 show the average and standard de-viation values for the parameters set for BLF and TLF, respectively. These tables also show the results of the objective function value (SSE) for each case. The error in the parameter estimation was quantified from the results obtained in minimization triplicates.
Figure 3: Experimental (Zubitur and Asua, 2001 and Mallikarjunan et al., 2010) and predicted
Table 3: Estimated parameters for BLF model.
Reaction Parameters ± standard deviation
1
ln ln2 ln1 ln2 w1 w2 SSE
PSD01 5.0830 ± 3.5E-08 5.3823 ± 2.7E-07 0.1178 ± 5.2E-08 0.3204 ± 9.4E-08 0.4354 ± 3.3E-07 0.5646± 3.3E-07 6.51E-06 ± 4.82E-11 PSD02 4.4658 ±
3.8E-08 5.4700 ± 1.7E-07 0.1861 ± 1.2E-07 0.2069 ± 6.1E-07 0.2963 ± 1.6E-07 0.7036 ± 1.6E-07 3.34E-06 ± 1.85E-11 PSD03 4.6718 ±
1.5E-07 5.8315 ± 3.4E-07 0.2160 ± 1.4E-07 0.1756 ± 1.5E-07 0.3127 ± 3.8E-07 0.6873 ± 3.8E-07 6.36E-06 ± 4.16E-11 PSD04 5.2643 ±
8.1E-09 6.3033 ± 1.2E-08 0.3038 ± 1.5E-08 0.1354 ± 4.1E-08 0.7851 ± 2.5E-08 0.2149 ± 2.5E-08 7.01E-07 ± 4.21E-12
Table 4: Estimated parameters for TLF model.
Reaction Parameters ± standard deviation
1
ln ln2 ln3 ln1 ln2 ln3 w1 w2 w3 SSE
PSD01 5.0673 ± 0.0004 5.2588 ± 0.0031 6.1347 ± 0.0226 0.1061 ± 0.0006 0.2378 ± 0.0015 0.5051 ± 0.0088 0.3346 ± 0.0042 0.4939 ± 0.0007 0.1716 ± 0.0046 1.46E-06 ± 3.42E-09 PSD02 5.1009 ±
0.0008 5.2782 ± 0.0004 6.3031 ± 0.0003 0.0899 ± 0.0007 0.3158 ± 0.0004 0.1296 ± 0.0004 0.0258 ± 0.0005 0.7679 ± 0.0001 0.2063 ± 0.0005 2.93E-07 ± 1.95E-10 PSD03 4.4635 ±
0.0013 5.4603 ± 0.0025 6.2168 ± 0.0008 0.1837 ± 0.0001 0.1904 ± 0.0005 0.0963 ± 0.0002 0.2896 ± 0.0005 0.6288 ± 0.0002 0.0815 ± 0.0001 3.53E-06 ± 1.95E-09 PSD04 4.6687 ±
0.0002 5.7616 ± 0.0034 5.9035 ± 0.0030 0.2131 ± 0.0002 0.0985 ± 0.0002 0.2196 ± 0.0033 0.3054 ± 0.0001 0.2011 ± 0.0118 0.4935 ± 0.0119 6.61E-07 ± 2.52E-10 PSD05 4.5558 ±
0.0082 4.6348 ± 0.0122 4.7799 ± 0.0075 0.0524 ± 0.0037 0.0471 ± 0.0030 0.1076 ± 0.0061 0.3663 ± 0.0774 0.2355 ± 0.0533 0.3982 ± 0.0246 1.25E-05 ± 1.59E-06 PSD06 3.3972 ±
0.0006 3.5831 ± 0.0044 4.7403 ± 0.0014 0.1627 ± 0.0008 0.3205 ± 0.0027 0.3215 ± 0.0019 0.2854 ± 0.0049 0.3507 ± 0.0035 0.3639 ± 0.0014 7.30E-06 ± 5.05E-09 PSD07 4.7391 ±
0.0117 4.9121 ± 0.0399 5.1154 ± 0.0272 0.2278 ± 0.0024 0.1563 ± 0.0087 0.1254 ± 0.0147 0.6805 ± 0.0157 0.1831 ± 0.0118 0.1230 ± 0.0279 2.76E-07 ± 1.40E-08 PSD08 4.1491 ±
0.0091 4.9883 ± 0.0089 5.2559 ± 0.0372 0.1216 ± 0.0092 0.2068 ± 0.0066 0.2784 ± 0.0124 0.0110 ± 0.0004 0.3397 ± 0.0273 0.6492 ± 0.0275 5.45E-08 ± 3.38E-08
It can be verified that all standard deviation and SSE values are low, confirming the ability of the algo-rithm to reproduce consistently the PSDs, thus, cor-roborating PSO robustness. Finally, a comparison between standard deviations presented in Table 3 and 4 shows that they are higher when using TLF, sug-gesting a greater correlation between the parameters of TLF, since in this function there exists a greater number of possible parameter combinations that
result from the minimization of the function.
It can be pointed out that scale differences in the particle diameters between emulsion polymeriza-tion [nm] and suspension polymerizapolymeriza-tion [µm] did not affect the proposed model for PSDs, and also that the TFL model was very sensitive to small vari-ations in the distribution like the presence of a very small population of small particles in PSD08 in Figure 4.
Figure 4: Experimental (Jahanzad, 2004) and predicted PSDs of batch suspension methyl
Evaluation of the correlation coefficient (r) was consistent with the results shown in Figures 1 to Figure 4, with r≥ 0.98 in all cases using BLF and r ≥ 0.99 in all cases using TLF, evidencing a strong cor-relation between experimental and predicted fre-quency distributions. The Kolmogorov-Smirnov test and the established critical values resulted in a dcritical value equal to 0.210 for a significance level (α) of 5% and for a number of observed points (n) equal to 40, used in this work. As the largest value dmáx evaluation for PSDs predicted is equal to 0.0147, the hypothesis that the data refer to the same distribution should be accepted, increasing the confidence in the performed parameter estimation.
Finally, it can be pointed out that all variability in the evaluated PSDs could be perfectly assimilated by TLF, and, except for the smaller third population of large particles of PSD03, also by the BLF. The pro-posal did not present inconsistencies even for the different particle diameter ranges commonly pro-vided by different polymerizations techniques. This difficulty was overcome by using normalized relative frequencies.
CONCLUSIONS
A multimodal lognormal function was proposed to describe the particle size distributions in hetero-geneous polymerization systems, with parameters estimated by the global optimization algorithm Parti-cle Swarm Optimization. Distributions with different characteristics, unimodal or multimodal, wide or nar-row, but all originating from polymerization reac-tions in emulsion or suspension were modeled.
High correlations between experimental and pre-dicted frequency distributions using bimodal and trimodal lognormal functions and the Kolmogorov-Smirnov test were obtained for all particle size dis-tributions, confirming that the proposed function can describe successfully particle size distributions with different characteristics.
Even when different particle diameter ranges were used, the proposed model could perfectly repre-sent the distribution profile. Furthermore, the accu-racy of the parameter estimation was evidenced by low standard deviation values, attesting to the ability of Particle Swarm Optimization to reproduce con-sistent results.
Comparing the trimodal lognormal function with the bimodal lognormal function, the use of the for-mer is justified only when the investigated particle size distributions are very polydisperse with three rele-vant modes.
ACKNOWLEDGMENTS
The authors thank the financial support from CNPq – Conselho Nacional de Desenvolvimento Ci-entífico e Tecnológico.
NOMENCLATURE
BLF Bimodal Lognormal Function CFD Computational Fluid Dynamics CHDF Capillary Hydrodynamic Fractionation d Particle diameter
exp experimental f relative frequencies i number of mode
MLF Multimodal Lognormal Function N absolute frequency
n number of experimental points.
Pg previous position among all the particles Pl previous position along the dth
dimension of particle PSD Particle Size Distributions PSO Particle Swarm Optimization r correlation coefficient SSE sum squared errors TLF Trimodal Lognormal Function u control parameter
V velocity vector
w Inertial weight
wi fraction of mode i wo Initial inertial weight x independent variable X position vector Yg best result found Yz best z last results
Greek Symbols
g
geometric mean
g
geometric standard deviation
REFERENCES
Araújo, P. H. H., Particle size distribution in hetero-geneous polymerization systems. D.Sc. Thesis, COPPE/Universidade Federal do Rio de Janeiro. Rio de Janeiro, Brazil (1999).
769-79 (2001). DOI: 10.1002/1521-3919(200110 01)10:8<769::AID-MATS769>3.0.CO;2-Z Blum, C., Merkle, D., Swarm Intelligence –
Introduc-tion and ApplicaIntroduc-tions. Springer-Verlag Berlin Hei-delberg (2008). http://www.springer.com/ computer/ ai/book/978-3-540-74088-9
Clementi, L. A., Vega, J. R., Gugliotta, L. M., Soft sensor for on-line monitoring of particle sizes in miniemulsion polymerization. Mecánica Com-putacional, 32 (2013). http://www.cimec.org.ar/ojs/ index.php/mc/article/viewFile/4494/4424
Coen, E. M., Peach, S., Morrison B. R., Gilbert R. G., First principles calculation of particle for-mation in emulsion polymerization: pseudo-bulk systems. Polymer, 45, 595-608 (2004). http://dx. doi.org/10.1016/j.polymer.2004.03.084
Crow, E. L., Shimizu, K., Log-normal Distributions: Theory and Application. New York, Dekker (1988).
Elgebrandt, R. C., Fletcher, D. F., Gomes, V. G., Ro-magnoli, J. A., A framework for modeling particle size effects in emulsion polymerization systems using computational fluid dynamics linked to a detailed population balance model. Computer Aided Chemical Engineering, 21 (2006). DOI: 10. 1016/S1570-7946(06)80103-3
Evren, A., Tuna, E., On some properties of goodness of fit measures based on statistical entropy. Inter-national Journal of Research and Reviews in Applied Sciences, 13 (2012). http://www. arpapress. com/Volumes/Vol13Issue1/IJRRAS_13_1_22.pdf Hosseini, A., Milad, O., Engell, S., Mid-course con-trol of particle size distribution in emulsion poly-merization using a hybrid model. IEEE Interna-tional Conference on Control Applications, Hy-derabad, India (2013). DOI:10.1109/CCA.2013. 6662836
Hwang, S., Choi, S., Use of a lognormal distribution model for estimating soil water retention curves from particle-size distribution data. Journal of Hydrology, 323, 325-334 (2006). DOI:10.1016/j. jhydrol.2005.09.005
Immanuel, C. D., Cordeiro, C. F., Sundaram, S. S., Meadows, E. S., Crowley, T. J., Doyle III, F. J., Modeling of particle size distribution in emulsion co-polymerization: Comparison with experimental data and parametric sensitivity studies. Comput. Chem. Eng., 26, 1133-1152 (2002). http://dx.doi. org/10.1016/S0098-1354(02)00031-5
Jahanzad. F., Evolution of particle size distribution in suspension polymerization reactions. Submitted in partial fulfillment of the requirements for the award of the Doctor of Philosophy of the Lough-borough University, Leicestershire, UK (2004).
https://dspace.lboro.ac.uk/dspace-jspui/handle/ 2134/ 10300
Jiao, B., Lian, Z., Gu, X., A dynamic inertia weight particle swarm optimization algorithm. Chaos Solitons & Fractals, 37, 698-705 (2008). http://dx.doi.org/10.1016/j.chaos.2006.09.063 Johnsson, J., Bladh, H., Bengtsson, P. E., On the
influence of bimodal size distributions in particle sizing using laser-induced incandescence. Ap-plied Physics, B, Lasers e Optics, 99, 817-823 (2010). DOI: 10.1007/s00340-010-3986-x
Kennedy, J., Eberhart, R. C., Particle swarm opti-mization. IEEE International Conference on Neu-ral Networks - Conference Proceedings, 4, 1942-1948 (1995). DOI: 10.1109/ICNN.1995.488968 Kiparissides, C., Achilias, D. S., Frantzikinakis, C.
E., The effect of oxygen on the kinetics and parti-cle size distribution in vinylchloride emulsion polymerization. Ind. Eng. Chem. Res., 41, 3097-3109 (2002). DOI: 10.1021/ie010928f
Limpert, E., Stahel, W., Abbt, M., Lognormal distri-bution across the sciences: Keys and clues. BioSci-ence, 51, 341-352 (2001). DOI: 10.1641/0006-3568(2001)051[0341:LNDATS]2.0.CO;2
Machado, R. A. F., Pinto, J. C., Araújo, P. H. H., Bolzan, A., Mathematical modeling of polystyrene particle size distribution produced by suspension polymerization. Brazilian Journal of Chemical En-gineering, 17, 395-407 (2000). http://dx.doi.org/ 10.1590/S0104-66322000000400004
Machado, F., Lima, E. L., Pinto, J. C., Uma Revisão Sobre os Processos de Polimerização em Suspen-são. Polímeros: Ciência e Tecnologia, 17, 166-179 (2007). (In Portuguese). http://dx.doi.org/10.1590/ S0104-14282007000200016.
Mallikarjunan, V., Pushpavanam, S., Immanuel, C. D., Parameter estimation strategies in batch emul-sion polymerization. Chemical Engineering Sci-ence, 65, 4967-4982 (2010). http://dx.doi.org/10. 1016/j.ces.2010.05.027
Pohn, J., Cunningham, M., McKenna, T. F. L., Scale-up of emulsion polymerization reactors Part I – development of a model framework. Macromo-lecular Reaction Engineering, 7, (2013). DOI: 10. 1002/mren.201300010
Pujol, J. C. F., Pinto, J. M. A., A neural network ap-proach to fatigue life prediction. International Jour-nal of Fatigue, 33, 313-322 (2011). http://dx.doi. org/10.1016/j.ijfatigue.2010.09.003
pen.760280502/abstract
Vale, H. M., McKenna, T. F., Modeling particle size distribution in emulsion polymerization reactors. Progress in Polymer Science, 30, 1019-1048 (2005). http://dx.doi.org/10.1016/j.progpolymsci.2005.06. 006
van den Berg, F., An Analysis of Particle Swarm Op-timizers. PhD Thesis, Department of Computer Science, University of Pretoria, Pretoria, South Africa (2002).
Yang, X. S., Nature-Inspired Optimization Algo-rithms. Chapter 7, Particle Swarm Optimization, Elsevier Inc. (2014). DOI:10.1016/B978-0-12-416743-8.00007-5
Yuan, Y., Yi, H., Shuai, Y., Liu, B., Tan, H., Inverse problem for aerosol particle size distribution using
SPSO associated with multi-lognormal distribu-tion model. Atmospheric Environment, 45, 4892-4897 (2011). http://dx.doi.org/10.1016/j.atmosenv. 2011.06.010
Zhao, B., Yang, Z., Johnston, M. V., Wang, H., Wexler, A. S., Balthasar, M., Kraft, M., Measurement and numerical simulation of soot particle size distri-bution functions in a laminar premixed ethylene-oxygen-argon flame. Combustion and Flame, 133, 173-188 (2003). http://dx.doi.org/ 10.1016/ S0010-2180(02)00574-6