*e-mail: [email protected]
1. Introduction
Since the past two decades, a marked increase is taking place in research works and engineering applications of lignocellulosic ibers obtained from both naturally occurring and cultivated plants. In less than 20 years, more than one thousand scientiic papers have been published on the characteristics and properties of hundreds of different ibers and distinct sub-species. These igures are certainly increasing owing not only to the potential of plants with promising ibers but also to the possibility of replacing synthetic ibers in terms of environmental, economical, societal and technical advantages1. One should not be surprised by this remarkable potential if it is accepted that only wood encompasses around 10,000 distinct species. In principle, for each lignocellulosic species of plant, ibers with distinct properties from different parts, such as leaves, stem, fruits, and even roots could be extracted for engineering purposes1.
Today, one of the motivations for investigating lignocellulosic ibers is the possible substitution for synthetic iber in polymer composites. Indeed, since the beginning in World War II, synthetic iber composites have successfully been applied in many areas of our modern civilization from medical devices to aerospace components. Today, in particular, the energy, pollution, cost and health problems of the glass iber
are motivating its replacement by lignocellulosic ibers2-4. Several review articles have discussed the advantages and drawbacks of the most important lignocellulosic ibers and related polymer composites5-17. Furthermore, speciic publications were dedicated to already existing applications of lignocellulosic iber composites in industrial sectors, from construction panels and doors18 to automobile parts manufacturing19-21.
Among the less known lignocellulosic ibers that were not included in the aforementioned review articles, the ique iber, Figure 1, deserves special attention for its relevant properties. The ique plant (Furcraea andina), illustrated in Figure 1a, is native of Colombia and its production has expanded to Ecuador, Costa Rica, Antilles and Brazil22. Fibers extracted from the stiff leaves of the ique bush, Figure 1b, are also known in some regions of Colombia as cabuya. The extraction is performed by mechanical technique and, for polymer composite reinforcement, the ique iber may be used untreated or chemically treated according to the type of matrix employed23. As indicated by Gañan and Mondragon22, the ique ibers are relatively lighter, 0.87 g/cm3, and can withstand temperatures up to 220°C. They reported tensile strength of 237 ± 51 MPa, elastic modulus of 8.01 ± 1.47 GPa and total elongation of 6.02 ± 0.69%. A diameter dispersion of the untreated ique iber was shown by Gañan and Mondragon22 to extend from 0.06 to 0.26 mm.
Fique Fiber Tensile Elastic Modulus Dependence with Diameter
Using the Weibull Statistical Analysis
Maria Carolina AndradeTelesa, Giulio RodriguesAltoéa, PedroAmoyNettoa, HenryColoradob,
Frederico MuylaertMargema, Sergio NevesMonteiroc*
aLaboratório de Materiais Avançados – LAMAV, Universidade Estadual do Norte Fluminense Darcy
Ribeiro – UENF, Av. Alberto Lamego, 2000, CEP 28013-602, Campos dos Goytacazes, RJ, Brazil bCements, Ceramics, & Composites Laboratory, Universidad de Antioquia – UdeA,
Calle 70, no. 52-21, Medellin, Colombia
cDepartamento de Ciência dos Materiais, Instituto Militar de Engenharia – IME,
Praça General Tibúrcio, 80, Praia Vermelha, CEP 22290-270, Urca, Rio de Janeiro, RJ, Brazil
Received: December 10, 2014; Revised: May 1, 2015
Fique is a plant native of Colombia with ibers extracted from its leaves presenting relevant physical characteristics and mechanical properties for possible engineering applications, such as reinforcement of polymer composites. The main physico-mechanical properties of the ique iber have already been investigated for both untreated and mechanically treated ibers. The statistical distribution of the ique iber diameter was analyzed and the effect of microibrillar angle on the tensile strength and elongation was determined. However, the correlation of mechanical properties with the iber diameter is yet to be determined. Thus, the present work evaluated the tensile elastic modulus dependence of the ique iber as a function of its diameter. By means of the Weibull statistical analysis, it was found that an inverse correlation adjusted the elastic modulus with the equivalent diameter through a hyperbolic type of mathematical relationship. Similar correlation have been found for several lignocellulosic ibers not only by the research group of the present work but also other international groups The results are compared and discussed.
However, no correlation was indicated by the authors to exist between the mechanical properties and the diameter.
Investigation on changes in mechanical properties as a function of lignocellulosic iber diameter has been reported since more than four decades24-30. Earlier international research groups investigated coir24, banana25, sisal26, pineapple27, palmyrah and talipot28 ibers. In these earlier works no correlation was proposed for the variation of mechanical properties with iber diameter. More recently29-36 it was found for several lignocellulosic ibers that both tensile strength and elastic modulus decrease as the iber diameter increases. In particular, Biagiotti et al.31 were the irst to indicate a mathematical expression using the Grifith model:
τ or E = A + B/d (1)
where d is the iber diameter, τ is the tensile strength, E the elastic modulus, A and B distinct constants for the different properties and ibers.
In a previous overview1 by the research group of the present work, it was also reported an inverse correlation between the diameter (d) and the tensile strength of several well known lignocellulosic ibers. Additionally, inverse diameter correlations were also recently found for the density37-42 and the elastic modulus37,40,43-45. Using the Weibull analysis in all these properties – strength (σ), density (ρ) and elastic modulus (E) – a simple hyperbolic type of mathematical adjustment was always obtained, similar to Equation 1.
In the particular case of the ique iber, a more recent publication46 indicated that an inverse hyperbolic correlation also exists between the tensile strength and the diameter. From this inverse correlation, mathematical hyperbolic equations for both the Weibull characteristic strength, θ, and the average strength, σ, were found as:
θ = 19.5/d + 13.8 (2)
17.1 / d 15.2
σ = + (3)
In order to complement the data associated with the mechanical properties, the objective of the present work
was to evaluate the ique iber tensile elastic modulus dependence with corresponding diameter using the Weibull statistical analysis.
2. Experimental Procedure
The basic material used in this work was the iber extracted from the leaf of ique plant (Furcraea andina). A bundle of ique ibers was supplied by one of the co-authors, Henry Colorado, who obtained it from a producer in Colombia. The ibers were extracted by retting followed by scrapping from leaves collected in 2014. The as-supplied ique ibers were cleaned and dried in a stove at 60°C for 24 hours. From 100 ibers randomly selected from the bundle, each corresponding equivalent diameter was directly measured in a model 6C Nikon proile projector. The equivalent diameter was obtained, following procedures indicated in several works1,24-28, as an average between the larger and smaller (90° rotation) cross section dimensions at ive locations along the iber’s length. By considering the iber with irregular cross-section (distinct dimensions in 90° rotation), the average measurements were associated with the iber equivalent diameter. Taking into account the distribution of diameters, from the smallest to the largest, seven conventional intervals divided the range.
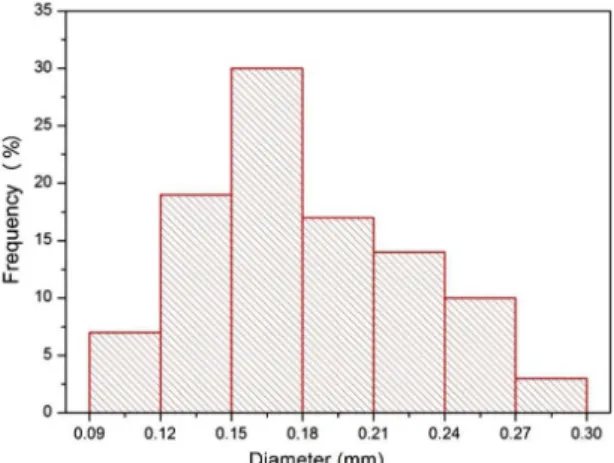
The histogram in Figure 2 displays the frequency of equivalent diameter distribution for the seven conventional intervals established in the present work. The ique iber diameters varied from 0.09 to 0.30 mm with a mean proportional value of 18.12 mm. For each interval of equivalent diameter in Figure 2, 20 ibers were selected. All ibers with 10 cm of length were individually tensile tested at a temperature of 25 ± 2°C in a model 5582 universal Instron machine operating under a strain rate of 2 x 10⁻⁴ s–1. Especial tensile grips were used to avoid both slippage and damage of the iber. The values obtained for the elastic modulus, associated with the slope of the initial part of the stress-strain curve, were interpreted by means of the Weibull statistics using the computer program Weibull Analysis.
The Weibull statistical analysis is based on a cumulative distribution function:
F(x) = 1– exp [–(x/θ)β] (4)
where θ and β are mathematically known as the shape and scale parameters. Equation 4 can be conveniently modiied into a linear expression by double application of logarithm:
(
)
1
ln ln ln x ln 1 F(x)
=β − β θ
−
(5)
In the present case of ique iber elastic modulus dependence with diameter, β is the slope, Equation 5, and indicated as the Weibull modulus, while θ is the characteristic elastic modulus. Using the 20 experimental strength data for each interval in Figure 2, associated with an average equivalent diameter, the computer program constructed the linear graph of Equation 5 and calculated the Weibull parameters.
The microstructural aspects of the ique iber with different diameters and the corresponding rupture characteristics were examined by scanning electron microscopy (SEM) in a model SSX-550 Shimadzu microscope. The SEM iber samples were gold sputtered and observed with secondary electrons at 15 kV.
3. Results and Discussion
Figure 3 depicts typical load versus elongation curves of ique ibers for each of the seven equivalent diameter intervals in Figure 2. Based on the maximum load (L), the tensile strength (σm) was determined for each iber as
σm = 4L/πd
2 (6)
where d is the equivalent diameter in Figure 2.
Using the stress-strain slope in the initial elastic regimen, the elastic modulus (E) was calculated for each tensile tested ique iber. The average value of Ē was statistically determined by means of the Weibull method for the 20 ibers associated with each of the seven diameter intervals shown in the histogram of Figure 2. The Weibull Analysis program provided the probability graphs of Equation 5 for the values of Ē that are shown in Figure 4 for all diameter intervals. Here it should be noted that all plots in Figure 4 are unimodal, i.e. with just
one single straight line itting the points at each interval. This indicates similar stiffness behavior of ibers within the same diameter interval.
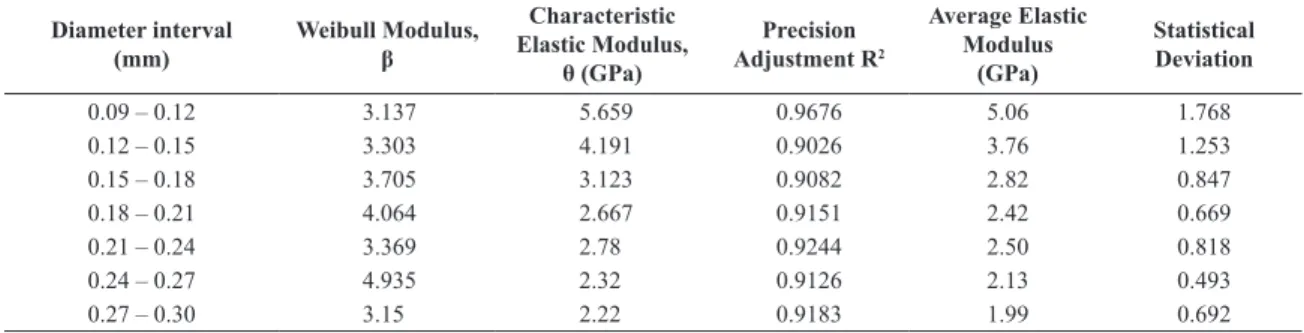
In addition, the Weibull program also provided the corresponding characteristic elastic modulus (θ), the Weibull modulus (β) and the precision adjustment (R2) parameters. The values of these parameters as well as the mean elastic modulus (Em) and associated statistical deviations, based on the Weibull distribution, are presented in Table 1.
The variation of the characteristic elastic modulus with the average iber diameter for each one of its intervals is shown in Figure 5. In this igure, there is a clear tendency for the θ parameter to vary inversely with the average ique iber diameter. This indicates that the thinner the iber the higher tends to be the characteristic elastic modulus. Furthermore, the corresponding values of β and R2, shown in Table 1, statistically support the inverse correlation between θ and the equivalent diameter d (mm). By means of a mathematic
correlation, a hyperbolic type of equation is proposed to it the data in Figure 5.
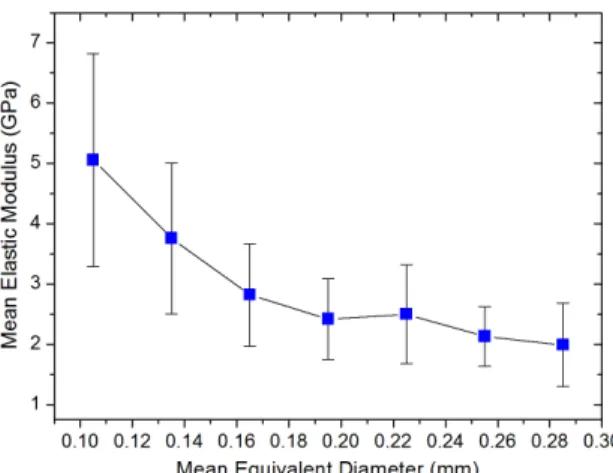
θ (GPa)= 19.5∕d + 13.8 (7) In order to analyze the physical meaning of Equation 7, the Weibull mean elastic modulus, Em, evaluated in this work for the ique ibers was plotted as a function of the
Figure 2. Histogram of the frequency of equivalent ique iber diameter
Figure 4. Weibull graphs of the elastic modulus reliability function for each equivalent diameter interval. Source: authors.
Table 1. Weibull parameters for the average elastic modulus of ique ibers associated with different diameter intervals.
Diameter interval (mm)
Weibull Modulus,
β
Characteristic Elastic Modulus,
θ (GPa)
Precision Adjustment R2
Average Elastic Modulus
(GPa)
Statistical Deviation
0.09 – 0.12 3.137 5.659 0.9676 5.06 1.768
0.12 – 0.15 3.303 4.191 0.9026 3.76 1.253
0.15 – 0.18 3.705 3.123 0.9082 2.82 0.847
0.18 – 0.21 4.064 2.667 0.9151 2.42 0.669
0.21 – 0.24 3.369 2.78 0.9244 2.50 0.818
0.24 – 0.27 4.935 2.32 0.9126 2.13 0.493
0.27 – 0.30 3.15 2.22 0.9183 1.99 0.692
diameter in Figure 6. In this igure, an apparent hyperbolic inverse correlation also exists between Em and d within the error bars (statistical deviations) and investigated limits. In spite of a higher dispersion in the error bars, a tendency for hyperbolic inverse correlation also exists between Em and d.
Em (GPa) = 17.1/d + 15.2 (8)
and the diameter of ique ibers. In practice, this indicates that thinner ique ibers are stiffer than thicker ones. A reason for the stiffness inverse correlation with diameter may be attributes to both microstructural aspects and random rupture of microibrils.
Figure 7 reveals by SEM micrographs the aspects of ique ibers, both thinner and thicker. As shown in Figure 7a, the thinner ique iber with d= 0.10 mm possesses a more homogenous microstructure, in which microibrils rupture occurs simultaneously, arrow in Figure 7b. On the other hand, the thicker iber, with d= 0.20 mm in Figure 7c has more laws and voids (arrows) associated with a non-uniform rupture of microibrils, as indicated by arrow in Figure 7d. Apparently, the more homogenous thinner iber has fewer points for crack nucleation with more close packed microibrils. This contributes to iber cross-section and surface with less defects and voids and, consequently, a more resisting area associated with higher elastic modulus. Another reason for the inverse correlation could be the random distribution of greater number of microibrils in the thicker ique iber, Figure 7c and d. The statistical chance is that, with more ibers, one microibril in the thicker iber will be weaker than those in the thinner iber. Rupture will then start earlier in the thicker iber, resulting in lower stiffness.
Figure 7. SEM micrographs for: (a) and (b) thinner iber as well as (c) and (d) thicker iber. Source: authors.
Figure 5. Variation of the Weibull characteristic elastic modulus with the mean equivalent diameter for each interval in Figure 3. Source: authors.
4. Conclusions
• A Weibull statistical analysis of the elastic modulus of ique ibers found an inverse correlation with the iber corresponding equivalent diameter. This correlation of the type E=A + B/d, also obtained for many other ibers, indicates a very close hyperbolic mathematical it for both the Weibull characteristic elastic modulus (θ) and the mean elastic modulus (Em), as found by several international research groups since 2004. • SEM micrographs revealed evidences that thicker
ique ibers possess more laws and voids than the thinner ones. This heterogeneous behavior associated
with defects results in comparatively lower stiffness for the thicker ibers.
• Statistically, the greater number of microibrils of the thicker iber might also be expected to cause earlier rupture of the weaker microibril, due to its random chance of belonging to the thicker iber. This contributed to a higher stiffness of the thinner iber as well.
Acknowledgements
The authors thank the support to this investigation by the Brazilian agencies: CNPq, CAPES and FAPERJ.
References
1. Monteiro SN, Lopes FPD, Barbosa AP, Bevitori AB, Silva ILA and Costa LL. Natural lignocellulosic fibers as engineering
materials — an overview. Metallurgical and Materials Transactions. A, Physical Metallurgy and Materials Science. 2011; 42(10):2963-2974. http://dx.doi.org/10.1007/s11661-011-0789-6.
2. Corbière-Nicollier T, Gfeller Laban B, Lundquist L, Leterrier Y, Månson J-A and Jolliet O. Life cycle assessment of biofibres replacing glass fibres as reinforcement in plastics. Resources, Conservation and Recycling. 2001; 33(4):267-287. http://dx.doi. org/10.1016/S0921-3449(01)00089-1.
3. Wambua P, Ivens I and Verpoest I. Natural fibers: can they replace glass and fibre reinforced plastics? Composites Science and Technology. 2003; 63(9):1259-1264. http://dx.doi.org/10.1016/ S0266-3538(03)00096-4.
4. Joshi SV, Drzal LT, Mohanty AK and Arora S. Are natural fiber composites environmentally superior to glass fiber reinforced composites? Composites Part A: Applied Science and Manufacturing. 2004; 35(3):371-376. http://dx.doi.org/10.1016/j. compositesa.2003.09.016.
5. Satyanarayana KG, Sukunaran K, Mukherjee PS, Pavithran C and Pillai SGK. Natural fibre-polymer composites. Cement and Concrete Composites. 1990; 12(2):117-136. http://dx.doi. org/10.1016/0958-9465(90)90049-4.
6. Bledzki AK and Gassan J. Composites reinforced with cellulose-based fibers. Progress in Polymer Science. 1999; 24(2):221-274. http://dx.doi.org/10.1016/S0079-6700(98)00018-5.
7. Nabi Saheb D and Jog JP. Natural fiber polymer composites: a
review. Advances in Polymer Technology. 1999; 18(4):351-363.
http://dx.doi.org/10.1002/(SICI)1098-2329(199924)18:4<351::AID-ADV6>3.0.CO;2-X.
8. Mohanty AK, Misra M and Hinrichsen G. Biofibers, biodegradable polymers and biocomposites: an overview. Macromolecular Materials and Engineering. 2000; 276-277(1):1-24. http://
dx.doi.org/10.1002/(SICI)1439-2054(20000301)276:1<1::AID-MAME1>3.0.CO;2-W.
9. Eichhorn SJ, Baillie CA, Zafeiropoulos N, Mwakambo LY,
Ansell MP, Dufresne A, et al. Review: current international
research into cellulosic fibres and composites. Journal of Materials Science. 2001; 36(9):2107-2131. http://dx.doi. org/10.1023/A:1017512029696.
10. Mohanty AK, Misra M and Drzal LT. Sustainable bio-composites from renewable resources: opportunities and challenges in the
green materials world. Journal of Polymers and the Environment. 2002; 10(1-2):19-26. http://dx.doi.org/10.1023/A:1021013921916.
11. Netravali AN and Chabba S. Composites get greener. Materials Today. 2003; 6(4):22-29. http://dx.doi.org/10.1016/S1369-7021(03)00427-9.
12. Crocker J. Natural materials. Materials Technology. 2008; 23(3):174-178. http://dx.doi.org/10.1179/175355508X373378.
13. John MJ and Thomas S. Biofibers and biocomposites. Carbohydrate Polymers. 2008; 71(3):343-364. http://dx.doi.
org/10.1016/j.carbpol.2007.05.040.
14. Satyanarayana KG, Arizaga GGC and Wypych F. Biodegradable composites based on lignocellulosic fibers – an overview. Progress in Polymer Science. 2009; 34(9):982-1021. http://
dx.doi.org/10.1016/j.progpolymsci.2008.12.002.
15. Monteiro SN, Lopes FPD, Ferreira AS and Nascimento DCO.
Natural fiber polymer matrix composites: cheaper, tougher and environmentally friendly. JOM. 2009; 61(1):17-22. http://
dx.doi.org/10.1007/s11837-009-0004-z.
16. Faruk O, Bledzki AK, Fink HP and Sain M. Biocomposites reinforced with natural fibers. Progress in Polymer Science. 2012; 37(11):1552-1596. http://dx.doi.org/10.1016/j.
progpolymsci.2012.04.003.
17. Thakur VK, Thakur MK and Gupta RK. Review: raw natural fibers based polymer composites. International Journal of Polymer Analysis and Characterization. 2014; 19(3):256-271. http://dx.doi.org/10.1080/1023666X.2014.880016.
18. Thomas S, Paul SA, Pothan LA and Deepa B. Natural fibers: structure, properties and applications. In: Kalia S, Kaith BS and Kaurs I, editors. Bio-and nano-polymer composites. Berlin:
Springer-Verlag; 2011. p 3-42.
19. Marsh G. Next step for automotive materials. Materials Today. 2003; 6(4):36-43. http://dx.doi.org/10.1016/S1369-7021(03)00429-2.
20. Holbery J and Houston D. Natural fiber reinforced polymer
composites in automotive applications. JOM. 2006; 58(11):80-86. http://dx.doi.org/10.1007/s11837-006-0234-2.
21. Zah R, Hischier R, Leão AL and Brown I. Curaua fibers in automobile industry – a sustainability assessment. Journal of Cleaner Production. 2007; 15(11-12):1032-1040. http://dx.doi. org/10.1016/j.jclepro.2006.05.036.
22. Gañán P and Mondragon I. Surface modification of fique fibers. Effects of their phisico-mechanical properties. Polymer Composites. 2002; 23(3):383-394. http://dx.doi.org/10.1002/ pc.10440.
24. Kulkarni AG, Satyanarayana KG, Sukumaran K and Rohatgi PK. Mechanical behavior of coir fibers under tensile load. Journal of Materials Science. 1981; 16(4):905-914. http:// dx.doi.org/10.1007/BF00542734.
25. Kulkarni AG, Satyanarayana KG, Rohatgi PK and Vijayan K. Mechanical properties of banana fibers (Musa sapientum).
Journal of Materials Science. 1983; 18(8):2290-2296. http:// dx.doi.org/10.1007/BF00541832.
26. Mukherjee PS and Satyanarayana KG. Structure and properties of some vegetables fibers. Part 1 - sisal fibers. Journal of Materials Science. 1984; 19(12):3925-3934. http://dx.doi. org/10.1007/BF00980755.
27. Mukherjee PS and Satyanarayana KG. Structure and properties of some vegetables fibers. Part 2 - pineapple fibers. Journal of Materials Science. 1986; 21(1):51-56. http://dx.doi.org/10.1007/ BF01144698.
28. Mukherjee PS and Satyanarayana KG. Structure and properties of some vegetables fibers. Part 3 - talipot and palmyrah fibers. Journal of Materials Science. 1986; 21(1)51-56. http://dx.doi. org/10.1007/BF01144698.
29. Baley C. Analysis of the flax fibres tensile behaviour and analysis of the tensile stiffness increase. Composites. Part A, Applied Science and Manufacturing. 2002; 33(7):939-948. http://dx.doi.org/10.1016/S1359-835X(02)00040-4.
30. Shibata M, Takachiyo K-I, Ozawa K, Yosomiya R and Takeishi H. Biodegradable polyester composites reinforced with short abaca fiber. Journal of Applied Polymer Science. 2002; 85(1):129-138. http://dx.doi.org/10.1002/app.10665.
31. Biagiotti J, Fiori S, Torre L, López-Manchado MA and Kenny JM. Mechanical properties of polypropylene matrix composites reinforced with natural fibers: a statistical approach. Polymer Composites. 2004; 25(1):26-36. http://dx.doi.org/10.1002/ pc.20002.
32. Andersons J, Sparninš E, Joffe R and Wallström L. Strength distribution of elementary flax fibres. Composites Science and Technology. 2005; 65(3-4):693-702. http://dx.doi.org/10.1016/j. compscitech.2004.10.001.
33. Park J-M, Quang ST, Hwang B-S and DeVries KL. Interfacial evaluation of modified Jute and Hemp fibers/polypropylene (PP)–maleic anhydride polypropylene copolymers (PP– MAPP) composites using micromechanical technique and
nondestructive acoustic emission. Composites Science and Technology. 2006; 66(15):2686-2699. http://dx.doi.org/10.1016/j. compscitech.2006.03.014.
34. Peponi L, Biagiotti J, Torre L, Kenny JM and Mondragón I. Statistical analysis of the mechanical properties of natural fibers and their composite materials I. Natural fibers. Polymer Composites. 2008; 29(3):313-320. http://dx.doi.org/10.1002/ pc.20408.
35. De Rosa IM, Kenny JM, Puglia D, Santulli C and Sarasini F. Morphological, thermal and mechanical characterization of okra
(Abelmoschus esculentus) fibers as potential reinforcement in polymer composites. Composites Science and Technology. 2010; 70(1):116-122. http://dx.doi.org/10.1016/j.compscitech.2009.09.013.
36. Fiore V, Valenza A and Di Bella G. Artichoke (Cynara cardunculus L.) fibres as potential reinforcement composite structures. Composites Science and Technology. 2011; 71(8):1138-1144. http://dx.doi.org/10.1016/j.compscitech.2011.04.003.
37. Simonassi NT, Loiola RL, Carreiro RS, Margem FM and Monteiro SN. Weibull analysis of the density and elastic modulus of curaua fiber with different diameters. In: Proceedings of the 67th Annual Congress of the Brazilian Association of Metallurgy and Materials; 2012; Rio de Janeiro, Brazil. Rio de Janeiro;
2012.
38. Margem JI, Simonassi NT, Margem FM and Monteiro SN. Weibull analysis of the density of malva fibers with different
diameters. In: Proceedings of the 67th Annual Congress of the Brazilian Association of Metallurgy and Materials; 2012; Rio
de Janeiro, Brazil. Rio de Janeiro; 2012.
39. Barbosa AP, Oliveira MP, Crespo AS, Santos NSS, Margem FM and Monteiro SN. Correlation between the density and the diameter of buriti fibers. In: Hwang J-Y, Monteiro SN, Bai C, Carpenter JS, Cai M, Firrao D, et al. editors. Characterization of Minerals, Metals & Materials 2012. Hoboken: John Wiley
& Sons; 2012. p. 365-371.
40. Pereira AC, Inacio WP, Margem FM and Monteiro SN. Effect of the fiber equivalent diameter on the elastic modulus and density of sisal fibers. In: Hwang J-Y, Monteiro SN, Bai C, Carpenter JS, Cai M, Firrao D, et al., editors. Characterization of Minerals, Metals & Materials 2012. Hoboken: John Wiley
& Sons; 2012. p. 357-364.
41. Bevitori AB, Silva ILA, Oliveira CG, Margem FM and Monteiro
SN. Weibull analysis of the density of ramie fibers with different diameters. In: Carpenter JS, Bai C, Hwang J-Y, Ikhmayies S, Li
B, Monteiro SN, et al., editors. Characterization of Minerals, Metals & Materials 2014. Hoboken: John Wiley & Sons; 2014.
p. 515-522.
42. Monteiro SN, Margem FM, Santafé HPG Jr, Martins LBS and Oliveira MP. Correlation between the diameter and the density of coir fiber using the Weibull statistical methodology. Materials Science Forum. 2014; 775-776:266-271. http://dx.doi. org/10.4028/www.scientific.net/MSF.775-776.266.
43. Oliveira MP, Barbosa AP, Silva VB, Margem FM and Monteiro SN. Weibull analysis of the elastic modulus of buriti fibers with
different diameters. In: Proceedings of the 67th Annual Congress of the Brazilian Association of Metallurgy and Materials; 2012;
Rio de Janeiro, Brazil. Rio de Janeiro; 2012.
44. Bevitori AB, Silva ILA, Carreiro RS, Margem FM and Monteiro
SN. Elastic modulus variation with diameter for ramie fibers. In: Hwang J-Y, Monteiro SN, Bai C, Carpenter JS, Cai M,
Firrao D, et al., editors. Characterization of Minerals, Metals & Materials 2012. Hoboken: John Wiley & Sons; 2012. p.
395-402.
45. Martins LBS, Monteiro SN, Margem FM, Loiola RL, Pereira
AC and Margem JI. Weibull analysis of the elastic modulus of bamboo fiber of the species Dendrocalmus giganteous. In: Hwang J-Y, Bai C, Carpenter JS, Ikhmayies S, Li B, Monteiro
SN, et al., editors. Characterization of Minerals, Metals & Materials 2013, Hoboken: John Wiley & Sons; 2013. p.
441-448.
46. Altoé GR, Puglia AL, Margem FM and Monteiro SN. Weibull analysis of the tensile strength of fique fibers. In: Pan American Materials Conference; 2014; São Paulo, Brazil. São Paulo;