Synthesis and Microstructural Characterization of SnO
2:F Thin Films Deposited by AACVD
Karen Alejandra Chavarría-Castilloa, Patricia Amézaga-Madrida*, Oswaldo Esquivel-Pereyraa,
Wilber Antúnez-Floresa, Pedro Pizá Ruiza, Mario Miki-Yoshidaa
Received: May 4, 2016; Revised: August 22, 2016; Accepted: October 2, 2016
In this work, we report the synthesis and microstructural characterization of Tin oxide thin ilms doped with luorine for applications such as transparent conductive oxides. Tin oxide doped with luorine thin ilms were deposited by aerosol assisted chemical vapor deposition technique onto a
borosilicate glass substrate, using a precursor solution of stannic chloride in ethanol and ammonium
luoride as the dopant. Deposition temperature was varied between 623-773 K. Also, other deposition parameters such as concentration of the precursor solution and gas carrier lux were ixed at 0.1 mol·dm-3 and 5 L min-1 respectively. Results indicate the presence of only the cassiterite phase of Tin oxide
in all samples. Thin ilms obtained were characterized by X-Ray Difraction. Surface morphology and microstructure were studied by ield emission scanning electron microscopy, optical properties of samples were analyzed by total transmittance and relectance spectra. The resistivity value of the ilms was measured by the sheet resistance.
Keywords: Tin oxide ilms, SnO2:F (FTO), Solar Cells, AACVD
* e-mail: [email protected]
1. Introduction
Thin-ilm solar cells ofer the opportunity to lower the
price of solar energy by using small amount of nanomaterials
and low-cost manufacturing technologies. A critical part of a thin-ilm solar cell however is the transparent electrode, which
is commonly made of transparent conductive oxides (TCO),
such as ITO (SnO2-In), FTO (Fluor tin oxide, SnO2-F) and
ATO (SnO2-Sb)
1-3. Transparent conductive oxides (TCOs)
have become increasingly important in a large variety of applications due to their wide variety of technological applications such as transparent electrodes in photovoltaic
cells, gas sensors and many other opto-electronic devices
4. However, the increasing demand and sophistication of
active and passive devices based TCOs, results in the need
to ind new precursors and improve electrical and optical properties of synthesized materials. For practical use as transparent electrodes in devices such as solar cells, lat
panel displays, and light emitting diodes, a TCO must have a resistivity of less than 10-3 Ω cm and over 80% transmittance in the visible range5-7. Indium tin oxide (ITO) is the current industrial standard material for transparent electrodes as
thin ilms can be produced with resistivity in of the order
of 10-5 Ω cm. However, due to the expense and scarcity of
indium, alternatives need to be found. Among the available TCOs, SnO2 seems to be more appropriate because they are
quite stable toward atmospheric conditions, chemically inert,
mechanically hard and can resist high temperature but its conductivity does not yet approach to that of the ITO8. Tin
oxide (SnO2) is a good candidate and a promising material
to improve its electrical and optical properties9. Its high
relectivity in infrared band makes it suitable for coatings on energy-saving windows. In order to use it as a conducting layer, the resistivity of SnO2 has to be reduced. Therefore, luorine
(F) has been used as a dopant for SnO2 where F substitutes
the O−2 and acts as an electron donor, resulting in an n-type degenerate semiconductor10. Fluorine is an ideal substitution
for oxygen because the anionic sizes are rather similar RO-2
=1.32Å and RF =1.33Å and the energy of dissociation (Do) of the Sn−F bond is similar to that of the Sn−O bond (~26.75 and ~31.05 Do/kJ mol−1 respectively)11. The use of luorine
doped tin dioxide for photovoltaics applications has risen
from an almost zero market share in the year 2000 to a 50%
share in 2009, with an impetus towards replacing sputtering
deposition techniques with Chemical vapour deposition (CVD)
12. Aerosol-assisted CVD (AACVD) is a variant of CVD.
The main diference of this variant assisted by aerosol, is that
transport of precursors to the synthesis zone is done in our case by using an ultrasonic nebulizer that has a piezoelectric
vibrating at a frequency of 2.4 MHz which is responsible for
the formation of a cloud of drops of micrometric average of
2.2 microns (aerosol) of the solution containing the element or elements of interest. For thin ilms, the substrate surface is irst prepared by depositing therein a bufer layer of a metal oxide, and subsequently contacted with one or more
precursors in vapor form that react or decompose to deposit
the second nanostructured material desired. This aerosol
was directed towards the substrate by a nozzle, which has a periodic movement at constant velocity to scan the whole
surface of the substrate. This cloud of droplets is transported
by a carrier gas, to a chamber temperature controlled, which
is adhered on the substrate surface that forms the coating.
The temperature of the chamber or substrate is one of the
key parameters that control the production of the material.
The precursor solution is also prepared easily and it is not
necessary to control the pH, or use agents or additives to
generate a particular morphology, it is only the precursor salt
and solvent. Also, there is no necessity to apply heat treatments or subsequent washings to acquire a pure nanomaterial. The AACVD technique used in this work is simple, an attribute that makes it practical and versatile. A novelty of this
method is that it is possible to obtain these pure materials in a single process, in the form of layers or multilayers of
diferent materials without causing contamination of each
other13-15. This process occurs at a lower cost, because in a
continuous process, it does not require the use of special
templates or additives agents to obtain a desired morphology in particular, allowing a uniform nanostructured materials deposit and allows to control of the dimensions of the thin
ilms, depending of what is needed. This AACVD system
is used to synthesize a convenient and relatively easy
diferent nanomaterials with diferent morphologies as thin ilms in single layer or multilayers14,17, nanorods and
nanowires16-19 nanorods coated19 and hollow and mesoporous
nanoparticles20,21. This technique, by its relative simplicity,
can be easily manipulated and scalable industrially since
it requires no high infrastructure or high vacuum systems,
because it works at atmospheric pressure and therefore the above mentioned we can say that this process can occur at
a lower investment.
This paper presents the synthesis by AACVD technique and characterization of thin ilms of pure tin oxide and tin oxide doped with luorine at 5 at. % concentration in the precursor solution and synthesis temperatures (since 723-773 K), also, the inluence of luorine dopant in the structural,
optical and electrical properties of the synthesized materials
was analyzed.
2. Materials and methods
2.1 Synthesis
Undoped and F doped SnO2 ilms were prepared onto
TiO2 thin ilm covered borosilicate glass substrates (2.5 ×
7.5 cm2) by the AACVD method details of the methodology
were reported previously16,22. For TiO
2 layer deposition, the
concentration of the starting solution was 0.05 mol·dm−3 of
titanium (IV) oxyacetylacetonate (98%) in methanol (99.8%). For the SnO2 thin ilms the precursor solution was of stannic
chloride (SnCl45H2O) of 0.095 mol·dm
−3 dissolved into
ethanol (99.8%). For doped samples ammonium luoride at 0.005 mol·dm−3 of concentration was utilized. The ilms
were prepared at several temperatures: 623, 723, 748 and 773 K, and diferent deposition times. An ultrasonic nebulizer
(PG-241) working at 2.4 MHz generated the aerosol that
was conveyed by the carrier gas and directed towards the substrate by a nozzle, which had a periodic movement at
constant velocity (~1 cm.min-1) to scan the whole surface
of the substrate. Optimum parameters were determined and kept constant in all the samples reported in this work. The most important conditions were: temperature of 773 K, carrier gas (air) low of 5 L min-1, and distance from
the nozzle to the substrate of 1 mm for all samples. The concentration of the precursor solution adjusted to 0.1 mol.
L-1. Table 1 summarizes the principal deposition parameters
used in this work.
2.2. Characterization
Surface morphology and ilm’s thickness were studied by ield emission scanning electron microscopy (SEM) using a JEOL JSM-7401F operated at 5 kV. To determine the thickness, cross sectional samples of the ilms were observed. Elemental microanalysis of the ilms was achieved by energy dispersive X-ray spectroscopy (EDS), using an Inca microanalysis system attached to the electron microscope. Grazing incidence X-ray difraction (GIXRD) patterns were acquired to determine the crystalline phases present in the ilms. The GIXRD patterns were obtained in a Pan-analytical X-Pert system, using Cu Kα radiation (λ = 0.1542 nm) at 40 keV and 35 mA. Grazing incidence angle was ixed at 0.5° and scanning angle 2 θ was varied between 25° and 90°, at 0.02° step. The optical properties of the materials were determined from total relectance and transmittance measurements in the UV-VIS-NIR interval in a CARY 5000 spectrophotometer.
Resistivity was determined by the method of sheet
resistance, for this measurement it was required: coating
length (l) in m is the same in both directions and the sample thickness (e). Considering constant temperature, the resistance is given by the following expression (1):
( ) R s l l e l
R e 1
&
$ $
t t t
= = =
Where ρ is the resistivity measured in Ω.m, R is the
electrical resistance measured in Ω and s is the cross sectional area measured in m2.
3. Results and Discussion
3.1. Structural properties
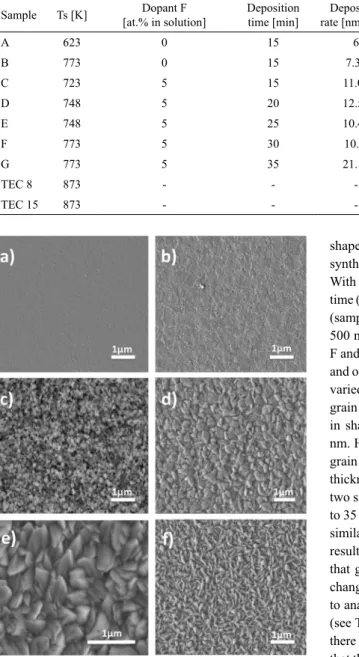
Films were polycrystalline, uniform, transparent and non-light scattering. Figure 1 (a-f) show SEM micrographs of surface morphology of samples. Figure 1 (a) shows the surface morphology of undoped sample A (SnO2) prepared
Table 1: Temperature and time deposition, concentration of dopant luorine in precursor solution, thickness of the samples, and also is presented commercial materials (TEC 8 and TEC 15) (produced by Pilkington NSG)12,26. Also is presented the resistivity value and percentage of transmittance obtained for each sample.
Sample Ts [K] [at.% in solution]Dopant F Deposition time [min] rate [nm minDeposition -1] Thickness [nm] Resistivity [Ω • cm] Transmittance [%]
A 623 0 15 6 90 1.17 84
B 773 0 15 7.33 110 9.88×10⁻¹ 80
C 723 5 15 11.06 166 6.41×10⁻³ 70
D 748 5 20 12.55 251 6.05×10⁻³ 79
E 748 5 25 10.44 261 3.47×10⁻³ 76
F 773 5 30 10.56 317 3.17×10⁻³ 69
G 773 5 35 21.14 740 2.6×10⁻³ 70
TEC 8 873 - - - 650 5.2×10⁻⁴
-TEC 15 873 - - - 350 5.3×10⁻⁴
-Figure 1: (a-f). SEM images of the surface morphology of the all
samples. a and b) Samples A and B, c-f) Doped samples (SnO2:F) synthetized at diferent temperature and deposition time
as a reference, to be compared with doped samples. In both samples a lattened morphology is observed. A ine
and uniform growth is appreciated in both samples (A and
B) with a similar thickness of 90 and 110 nm respectively. Figure 1 (c-f) shows the morphology of doped samples (SnO2:F) (Samples C, D, F and G). It can be seen in Figure
1 (c-f) that doped samples show a signiicant change in
morphology and also the formation of grains can be seen,
these grains are uniformly distributed. In sample C (Figure
1c) we can see a morphology consisting of small grains
with size of approximately 80-100 nm and with irregular
shape; this sample has a thickness of 166 nm, and was
synthetized at 723 K for a deposition time of 15 minutes. With increasing temperature (at 748 K), and the deposition
time (20 minutes) another change is seen in the morphology,
(sample D, Figure 1 d), resulting grains with a size of 250-500 nm and a thickness of 251 nm. Furthermore, samples F and G were synthesized at the same temperature (773 K) and only deposition time 30 to 35 minutes respectively was varied. We can see that in Figure 1e (sample F) reoccurring grain growth having a grain size of 200-500 nm, similar in shape to sample D, and obtaining a thickness of 317 nm. However, Sample G shows the opposite behavior, the
grain size decreases but retains its irregular shape, and the
thickness increases to 740 nm. The diference between these two samples is the deposition time to be increased from 30 to 35 minutes. The morphologies obtained in this study are
similar to those reported in27. In short, we can say with these
results that the presence of dopant luorine and the amount that goes into each sample has an important inluence in
changing the microstructure of the samples and grain sizes, to analyze the values in the rate deposition in the samples (see Table 1), it is observed that the values are very close,
there is no signiicant diference between them, which means
that the deposition temperature and the deposition time, do
not exert signiicant inluence in changing the morphology of the samples. Similar results of SnO2:F were reported in 1. In the case of EDS analysis, in the samples A and B the
presence of the next elements is noted: Sn % at. of 0.56 and 1.82; O % at. of 68.13 and 68.56; Si % at. 27.07 and 25.71 (substrate element); Na % at. of 1.88 and 1.35 (substrate element); Al % at. of 1.12 and 0.88 (substrate element); Ti % at. of 1.25 and 1.68 (substrate element and the barrier layer) respectively, all elements measured at the level K. In the case of doped samples exhibit similar % at. of the elements present that in the sample B (reported above), however the element F was not detected, this can be explained because
there was possibly a minor amount of dopant that could not
The crystal structure of the deposited doped and undoped
thin ilms was determined by X-ray difraction technique. According to GIXRD patterns in Figure 2 (pure SnO2
samples A and B) and Figure 3 (SnO2:F samples F and G),
it was concluded that all samples were polycrystalline. A
representative peak of TiO2 as anatase (barrier layer) was
observed at 25.23º (PDF 01-075-2553)23. And the igures 2
and 3 show clearly that it only contains crystal lattice planes of (110), (101), (200), (211), (220), (310), (301) matched with difracting lines of SnO2 as tetragonal cassiterite (PDF
01-072-1147)24.
Figure 2: GIXRD patterns of SnO2 samples (A and B).
Figure 3: GIXRD patterns of doped samples with luorine. (Samples
F and G). These samples presented only single-phase cassiterite structure.
3.2. Optical and electrical properties
All samples had a similar behavior in the visible region. Figure 4 shows the transmittance (T) spectra of sample A (pure SnO2) and samples F and G (SnO2:F). High transparency in
the visible range (60-80%) is observed, in the wavelength range 450-850 nm, in accordance with the requirements for transparent conducting oxide applications (80%),9,25
indicating that doping does not afect the properties of the material. Doped SnO2 ilms showed n-type conductivity.
Figure 4: Transmittance spectra obtained of the A, G and F samples
Table 1 displays the resistivity values; as it can be seen, the
doped ilms are all conductive, this is because the doping with luorine. All doped samples, showed a good resistivity
values in the order of 10-3 Ω · cm, since smaller thicknesses
(166 nm) (sample C) using low temperatures (723-773 K) and short times of deposition (15-30 minutes) is achieved,
resistivity decrease two orders of magnitude (comparing
with sample B) managing to obtain resistivity of the order
of magnitude of 10-3 Ω · cm. There are already commercial products with resistivity on the order 10-4 Ω · cm, In Table
1, two commercial materials (TEC 8 and TEC 15) produced by the company Pilkington NSG12,26 are presented, these
commercial materials are glass with a coating of FTO that are deposited by means of physical-chemical processes (using chemical vapor) and / or physical (high vacuum) at temperatures of 873 K 26 these results give us the opportunity
to continue working to improve the conductive property of
our materials using techniques such as AACVD.
4. Conclusions
Undoped and luorine doped tin oxide ilms with high quality were successfully deposited using a simpliied and inexpensive AACVD technique for electrical applications.
The structural, morphological, optical and electrical properties were investigated as a function of deposition
temperature (723-773 K), diferent deposition times and 5 % at of dopant F in solution. All doped samples, showed
a good resistivity values in the order of 10-3 Ω · cm since
723 K and 166 nm of thickness. SnO2:F with 740 nm of
thickness exhibited the lowest resistivity around 2.6×10⁻³
the development of the industry of solar power generation,
so it is necessary to opt for synthesis techniques with lower cost and infrastructure.
5. Acknowledgement
Authors thanks to Oswaldo Esquivel-Pereyra, E. Guerrero-Lestarguette, L. Jáuregui-Martínez for technical assistance provided for the realization of this work. This work is partially supported from the Project CB 2013-2014 No. 242612 CONACYT.
6. References
1. Supriyono, Surahman H, Krisnandi YK, Gunlazuardi J. Preparation and characterization of transparent conductive SnO2-F thin ilm deposited by spray pyrolysis: relationship between loading level and some physical properties. Procedia Environmental Sciences.2015;28:242-251.
2. Moholkar AV, Pawar SM, Rajpure KY, Bhosale CH, Kim JH. Efect of luorine doping on highly transparent conductive spray deposited nanocrystalline tin oxide thin ilms. Applied Surface Science. 2009;255(23):9358-9364.
3. Olopade MA, Awe OE, Awobode AM, Alu N. Characterization of SnO2:F ilms deposited by atmospheric pressure chemical vapor deposition for optimum performance solar cells. The African Review of Physics. 2012;7:177-181.
4. Fukano T, Motohiro T. Low-temperature growth of highly crystallized transparent conductive luorine-doped tin oxide ilms by intermittent spray pyrolysis deposition. Solar Energy Materials and Solar Cells. 2004;82(4):567-575.
5. Brabec CJ, Cravino A, Meissner D, Sariciftci NS, Fromherz T, Rispens MT, et al. Origin of the Open Circuit Voltage of Plastic Solar Cells. Advanced Functional Materials.2011;11(5):374-380. 6. Too CO, Wallace GG, Burrell AK, Collis GE, Oicer DL, Boge
EW, et al. Photovoltaic devices based on polythiophenes and substituted polythiophenes. Synthetic Metals. 2001;123(1):53-60. 7. Goetzberger A, Hebling C, Schock HW. Photovoltaic materials,
history, status and outlook. Materials Science and Engineering:
R: Reports.2003;40(1):1-46.
8. Gupta S, Yadav BC, Dwivedi P, Das B. Microestructural, optical and electrical investigation of Sb-SnO2 thin ilms deposited by spray pyrolysis. Materials Research Bulletin. 2013;48(9):3315-3322. 9. Abhijit AA, Pawar SC, Patil DH, Ghogare MD. Properties of
(200) oriented, highly conductive SnO2 thin ilms by chemical spray pyrolysis from non-aqueous medium: Efect of antimony doping. Journal of Alloys and Compounds. 2015;652:145-152.
10. Miki-Yoshida M, Andrade E. Growth and structure of tin dioxide thin ilms obtained by an improved spray pyrolisis technique.
Thin Solid Films. 1993;224(1):87-96.
11. Ngamsinlapasathiana S, Sreethawongb T, Suzuki Y, Yoshikawa S. Doubled layered ITO/SnO2 conducting glass for substrate of dye-sensitized solar cells. Solar Energy Materials and Solar Cells. 2006;90(14):2129-2140.
12. Bachu DS, Waugh MR, Zeissler K, Branford WR, Parkin IP. Textured Fluorine-Doped Tin Dioxide Films formed by Chemical Vapour Deposition. Chemistry - A European Journal. 2011;17(41):11613-11621.
13. Sáenz-Trevizo A, Amézaga-Madrid P, Pizá-Ruiz P, Solís-Canto O, Ornelas-Gutiérrez C, Pérez-García A, et al. Microstructural characterization, optical and photocatalytic properties of bilayered CuO and ZnO based thin ilms. Journal of Alloys and Compounds. 2014;615(Suppl 1):S375-S381.
14. Sáenz-Trevizo A, Amézaga-Madrid P, Fuentes-Cobas L, Pizá-Ruiz P, Ornelas-Gutiérrez C, Pérez-García A, et al. Microstructural, chemical and textural characterization of ZnO nanorods synthesized by aerosol assisted chemical vapor deposition
Materials Characterization. 2014;98:215-221.
15. Sáenz-Trevizo A, Amézaga-Madrid P, Pizá-Ruiz P, Antúnez-Flores W, Ornelas-Gutiérrez C, Miki-Yoshida M. Eicient and durable ZnO core-shell structures for photocatalytic applications in aqueous media. Materials Science in Semiconductor Processing. 2016;45:57-68.
16. Miki-Yoshida M, Patricia Amézaga-Madrid P, Pizá-Ruiz P, Antúnez-Flores W, Lugo-Ruelas M, Esquivel-Pereyra O, inventors.
Application for patent registered with the Mexican Institute of Industrial Property. Document number MX/a/2013/015380; folio MX/E/2013/095195.
17. Lugo-Ruelas M, Amézaga-Madrid P, Esquivel-Pereyra O, Antúnez-Flores W, Pizá-Ruiz P, Ornelas-Gutiérrez C, et al. Synthesis, microstructural characterization and optical properties of CuO nanorods and nanowires obtained by aerosol assisted CVD.
Journal of Alloys and Compounds. 2015;643(Suppl 1):S46-S50.
18. Amézaga-Madrid P, Antúnez-Flores W, González-Hernández J, Sáenz-Hernández J, Campos-Venegas K, Solís-Canto O, et al. Microstructural properties of multi-nano-layered YSZ thin ilms. Journal of Alloys and Compounds.2010;495(2):629-633.
19. Miki-Yoshida M, Amézaga-Madrid P, Sáenz-Trevizo A, Pizá-Ruiz P, Antúnez- Flores W, Lugo-Ruelas M, inventors. Centro de Investigación en Materiales Avanzados, S.C. México. Patent register MX/a/2014/007867.
20. Monárrez-Cordero B, Amézaga-Madrid P, Antúnez-Flores W, Leyva-Porras C, Pizá-Ruiz P, Miki-Yoshida M. Highly eicient removal of arsenic metal ions with high supericial area hollow magnetite nanoparticles synthetized by AACVD Method. Journal of Alloys and Compounds. 2014;586(Suppl 1):S520-S525.
21. Miki-Yoshida M, Amézaga-Madrid P, Monárrez-Cordero BE, Barrientos-Juárez E, inventors. Centro de Investigación en Materiales Avanzados, S.C. México. Title of Patent No. MX/a/2012/004874.
22. Amézaga-Madrid P, Antúnez-Flores W, Monárrez-García I, González-Hernández J, Martínez-Sánchez R, Miki-Yoshida M. Synthesis, structural characterization and optical properties of multilayered Yttria-stabilized ZrO2 thin ilms obtained by aerosol assisted chemical vapour deposition. Thin Solid Films. 2008;516(23):8282-8288.
24. International Center for Difraction Data. ICDD XRD database PDF number 01-072-1147. Newtown Square: International Center for Difraction Data; 1990.
25. Guillén C, Herrero J. TCO/metal/TCO structures for energy and lexible electronics. Thin Solid Films. 2011;520(1):1-17.
26. Pilkington NSG Group Flat Glass Business. NSG TEC™. Available from: <https://www.pilkington.com/en-gb/uk/products/ product-categories/solar-energy/nsg-tec>. Access in: 10/10/2016. 27. Noor N, Parkin IP. Enhanced transparent-conducting luorine-doped