ISSN 0104-6632 Printed in Brazil
www.abeq.org.br/bjche
Vol. 26, No. 01, pp. 199 - 206, January - March, 2009
Brazilian Journal
of Chemical
Engineering
A NEW APPROACH FOR ESTIMATION OF PVT
PROPERTIES OF PURE GASES BASED ON
ARTIFICIAL NEURAL NETWORK MODEL
A. R. Moghadassi, F. Parvizian
*, S. M. Hosseini and A. R. Fazlali
Department of Chemical Engineering, Faculty of Engineering, Arak University, Phone/Fax: + (98) 861-2225946, Shariati St., Farmandari Sq., Arak - Markazi, Iran.
E-mail: [email protected]
(Submitted: April 25, 2008 ; Revised: July 07, 2008 ; Accepted: August 06, 2008)
Abstract - Equations of state are useful for description of fluid properties such as pressure-volume-temperature (PVT). However, the success estimation of such correlations depends mainly on the range of data which have originated. Therefore new models are highly required. In this work a new method is proposed based on Artificial Neural Network (ANN) for estimation of PVT properties of compounds. The data sets were collected from Perry’s Chemical Engineers’ Handbook. Different training schemes for the back-propagation learning algorithm, such as; Scaled Conjugate Gradient (SCG), Levenberg-Marquardt (LM) and Resilient back Propagation (RP) methods were used. The accuracy and trend stability of the trained networks were tested against unseen data. The LM algorithm with sixty neurons in the hidden layer has proved to be the best suitable algorithm with the minimum Mean Square Error (MSE) of 0.000606. The ANN’s capability to estimate the PVT properties is one of the best estimating method with high performance.
Keywords: Artificial Neural Network; Model; Thermodynamic; PVT; Equation of state.
INTRODUCTION
Thermodynamic properties, such as internal energy and enthalpy, which have been used for calculation of the heat and work requirements in industrial processes, are often evaluated from volumetric data. Moreover, pressure-volume-temperature (PVT) relations are important for such purposes as the metering of fluids and sizing of vessels and pipelines (Smith et al., 2001). Equations of state are useful in describing the properties of fluids, mixtures of fluids, solids, and even the interior of stars (Pierre, 1998). In physics and thermodynamics, an equation of state is a relation between state variables (temperature, pressure, volume, or internal energy). The most prominent use of an equation of state is to estimate the state of gases and liquids. One of the simplest equations of state for this purpose is the ideal gas law, which is roughly accurate for gases at low pressures and high temperatures. However, this equation becomes
200 A. R. Moghadassi, F. Parvizian, S. M. Hosseini and A. R. Fazlali
(Valles, 2006). Speed, simplicity, and capacity to learn are the advantages of ANN compared to classical methods. This model has been widely applied to estimate the physical and thermodynamic properties of chemical compounds. ANN has recently been used to predict some pure substances and petroleum fraction’s properties (Bozorgmehry et al., 2005), activity coefficients of isobaric binary systems (Biglin, 2004), dew point pressure (Zambrano, 2002), thermodynamic properties of refrigerants (Ganguly, 2003; Sozen et al., 2005), and activity coefficient ratio of electrolytes in amino acid's solutions (Dehghani et al., 2006), etc. However, few publications are available in literature for ANN applications in predicting PVT properties.
Defining the ANN and selecting the best ANN predictor to predict the compressibility factor (z) in desired temperature and pressure ranges instead of empirically derived correlations are the main focus of this work. Finally results of the ANN model is evaluated against with the unseen data and then compared with the empirical models.
ARTIFICIAL NEURAL NETWORKS
In order to find relationship between the input and output data derived from experimental work, a more powerful method than the traditional ones are necessary. ANN is an especially efficient algorithm to approximate any function with finite number of discontinuities by learning the relationships between input and output vectors (Bozorgmehry et al., 2005; Hagan et al., 1996). These algorithms can learn from the experiments, and also are fault tolerant in the sense that they are able to handle noisy and incomplete data. The ANNs are able to deal with non-linear problems, and once trained can perform estimation and generalization rapidly (Sozen et al.,
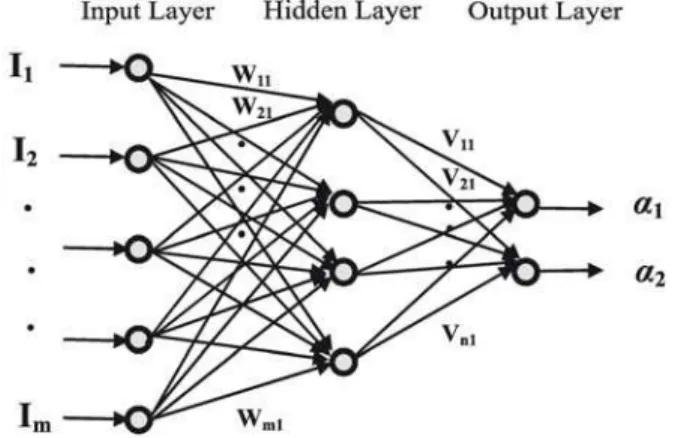
2004). They have been used to solve complex problems that are difficult to be solved if not impossible by the conventional approaches, such as control, optimization, pattern recognition, classification, and so on, Specially it is desired to have the minimum difference between the predicted and observed (actual) outputs (Richon and Laugier, 2003). Artificial neural networks are biological inspirations based on the various brain functionality characteristics. They are composed of many simple elements called neurons that are interconnected by links and act like axons to determine an empirical relationship between the inputs and outputs of a given system. Multiple layers arrangement of a typical interconnected neural network is shown in Figure (1). It consists of an input layer, an output layer, and one hidden layer with different roles. Each connecting line has an associated weight. Artificial neural networks are trained by adjusting these input weights (connection weights), so that the calculated outputs may be approximated by the desired values. The output from a given neuron is calculated by applying a transfer function to a weighted summation of its input to give an output, which can serve as input to other neurons, as follows (Gharbi, 1997).
k 1 N
jk k ijk i(k 1) jk
i 1
F ( w )
−
− =
α =
∑
α + β (1)Where αjk is neuronj ’s output from k ’s layer βjk
is the bias weight for neuronj in layer k . The model fitting parameters wijk are the connection weights.
The nonlinear activation transfer functions Fk may
have many different forms. The classical ones are threshold, sigmoid, Gaussian and linear function, etc… (Lang, 2001), for more details of various activation functions see Bulsari (1995).
The training process requires a proper set of data i.e. input (Ii) and target output (ti). During training
the weights and biases of the network are iteratively adjusted to minimize the network performance function (Demuth and Beale, 2002). The typical performance function that is used for training feed forward neural networks is the network Mean Squares Errors (MSE) Eq. (2).
N N
2 2
i i i
i 1 i 1
1 1
MSE (e ) (t )
N = N =
=
∑
=∑
− α (2)There are many different types of neural networks, differing by their network topology and/or learning algorithm. In this paper the back propagation learning algorithm, which is one of the most commonly used algorithms is designed to predict the PVT properties. Back propagation is a multilayer feed-forward network with hidden layers
between the input and output (Osman and Al-MArhoun, 2002). The simplest implementation of back propagation learning is the network weights and biases updates in the direction of the negative gradient that the performance function decreases most rapidly. An iteration of this algorithm can be written as follows (Gharbi, 1997).
k 1 k k k
x + =x −l g (3)
The process details flowchart to find the optimal model is shown in Figure (2). There are various back propagation algorithms such as Scaled Conjugate Gradient (SCG), Levenberg-Marquardt (LM) and Resilient back Propagation (RP). LM is the fastest training algorithm for networks of moderate size and it has the memory reduction feature to be used when the training set is large. One of the most important general purpose back propagation training algorithms is SCG (Lang , 2001; Demuth and Beale, 2002).
202 A. R. Moghadassi, F. Parvizian, S. M. Hosseini and A. R. Fazlali
The neural nets learn to recognize the patterns of the data sets during the training process. Neural nets teach themselves the patterns of the data set letting the analyst to perform more interesting flexible work in a changing environment. Although neural network may take some time to learn a sudden drastic change, but it is excellent to adapt constantly changing information. (Parvizian, 2008). However the programmed systems are constrained by the designed situation and they are not valid otherwise. Neural networks build informative models whereas the more conventional models fail to do so. Because of handling very complex interactions, the neural networks can easily model data, which are too difficult to model traditionally (inferential statistics or programming logic). Performance of neural networks is at least as good as classical statistical modeling, and even better in most cases (Osman and Al-MArhoun, 2002). The neural networks built models are more reflective of the data structure and are significantly faster.
Neural networks now operate well with modest computer hardware. Although neural networks are computationally intensive, the routines have been optimized to the point that they can now run in reasonable time on personal computers. They do not require supercomputers as they did in the early days of neural network research.
THEORY AND EXPERIMENTAL DATA
Knowledge of the pressure/volume/temperature (PVT) behavior of natural gases is necessary to solve many petroleum engineering problems. Gas reserves, gas metering, gas pressure gradients, pipeline flow and compression of gases are some of the problems requiring precise calculation of gas density (Parvizian, 2008).
The equation of state relating the pressure, volume, temperature, is adequate to provide all the required volumetric information, such as the gas information volume factor, density and isothermal compressibility coefficient (Danesh, 1998). All gases behave ideally when the pressure approaches zero, the pressure volume relation for an ideal gas is written as
Pυ = RT (3)
Due to intermolecular forces real gases do not behave ideally, particularly at elevated pressures. Eq. (3) is extended to real systems by including a compressibility factor, Z, as
Pυ=ZRT (4)
Compressibility factor, Z, is a key parameter, which can be determined from various
theoretical-empirical equation of state or a generalized chart for gases. These charts are created by plotting Z as a function of pressure at constant temperature.
The compressibility factor depends only on the reduced temperature, Tr, and the reduced pressure, Pr.
A set of data containing reduced pressure, reduced temperature and compressibility factor was collected from Chemical engineers’ Handbook (Perry, 1999). Table (1) lists samples of these data which were used for training and testing the neural network.
NEURAL NETWORK MODEL DEVELOPMENT
Developing the neural network model to
accurately predict the PVT properties of different gases requires its exposure to a large data set during the training phase.
The back propagation method with SCG, LM and RP learning algorithm has been used in feed forward, single hidden layer network. Input layer neurons have no transfer functions. Similarly, inputs are the reduced temperature and reduced pressure while output is the compressibility factor. The neurons in the hidden layer perform two tasks: summing the weighted inputs connected to them and passing the result through a non linear activation function to the output or adjacent neurons of the corresponding hidden layer. The computer program has been developed under MATLAB (Parvizian, 2008). Two thirds of data set is used to train each ANN and the rest have been used to evaluate their accuracy and trend stability. The number of hidden neurons has been systematically varied to obtain a good estimate of the trained data (Padmavathi et al., 2005). The selection criterion is the net output MSE. The MSE of various hidden layer neurons are shown in Figure (3). As it can be seen the optimum number of hidden layer neurons is determined to be 60 for minimum MSE.
Similarly the MSE of various training algorithms was calculated and listed in table (2) for the obtained nineteen hidden layer neurons. As Table (2) shows the Levenberg-Marquardt (LM) and Scaled Conjugate Gradient (SCG) algorithms have the minimum MSE.
Now the trained ANN models are ready to be tested and evaluated against the new data. Table (3) lists the various MSE of the network testing. According to these tables the Levenberg-Marquardt (LM) algorithm is the most suitable algorithm with the minimum MSE.
Table 1: Minimum and Maximum Data which Used to Train the Neural Network
Properties min max
Reduced Pressure 0.001245 18.07773
Reduced Temperature 0.662866 24.10356
Compressibility factor 0.0002 6.019
Figure 3: Determining the optimum number of neurons for some algorithms
Table 2: MSE Comparison between different algorithms to train ANN
Algorithm MSE of network Training
Trainlm 0.000606 Trainscg 0.001428 Trainrp 0.001799
Table 3: MSE Comparison between different algorithms to test ANN
Algorithm MSE of network Training
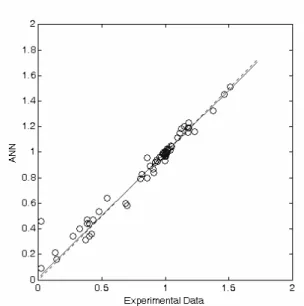
Trainlm 0.00172 Trainscg 0.000257 Trainrp 0.00318
204 A. R. Moghadassi, F. Parvizian, S. M. Hosseini and A. R. Fazlali
RESULTS AND DISCUSSION
The results show that the ANN can predict PVT properties very close to the experimentally measured ones. Figures (5) and (6) show the scatter diagrams that compare the experimental data versus the computed
neural network data for both training and testing the ANN. As it may be seen, a tight cloud of points about the 45o line is obtained for the new data points. This indicates an excellent agreement between the experimental and the calculated data. Figures (7 and 8) compare the ANN simulation and experimental data.
Figure 5: A Comparison between ANN and experimental data for training the network
Figure 6: A Comparison between ANN and experimental data for testing the network
Figure 7: A comparison between predicted data by ANN and Experimental data
ACKNOWLEDGEMENTS
The authors are grateful to Dr. A. Sooratgar and Dr. E. Joudaki members of the Faculty of Engineering of the Arak University for their constructive and frequent discussion.
NOMENCLATURE
e Difference between target
data and simulation
(-)
F Transfer function (-)
g Gradient (-)
I Input data (-)
l Learning rate
N Number of data (-)
P Pressure bar
R Universal gas constant 8.314 J mol-1
K-1
T Temperature K
t Target data (-)
x Vector of weights (-)
w Connection weights (-)
Z Compressibility factor (-)
α Output of neuron (-)
β Bias weight (-)
υ Molar volume m3/mol
REFERENCES
Biglin, M., Isobaric vapor-liquid equilibrium calculations of binary systems using a neural network, J. Serb. Chem. Soc., 69, p. 669 (2004). Bozorgmehry, R. B., Abdolahi, F., Moosavian, M.
A., Characterization of basic properties for pure properties for pure substances and petroleum fractions by neural network, Fluid phase equilibria, 231, p. 188 (2005).
Bulsari, A. B., Neural Networks for Chemical Engineers, Elsevier, Amsterdam (1995).
Chouai, A., Laugier, S., Richon, D., Modeling of thermodynamic properties using neural networks application to refrigerants, Fluid Phase Equilibr. 199, p. 53 (2002).
Danesh, A., PVT and phase behavior of petroleum reservoir fluids, Elsevier (1998).
Dehghani, M.R., Modarress, H., Bakhshi, A., Modeling and prediction of activity coefficient
ratio of electrolytes in aqueous electrolyte solution containing amino acids using artificial neural network, Fluid phase equilibria, 244, p.153 (2006).
Demuth, H., Beale M., Neural Network Toolbox User’s Guide (2002).
Ganguly, S., Prediction of VLE data using radial basis function network, Computers and chemical engineering, 27, p. 1445 (2003).
Gharbi, R., Estimating the isothermal compressibility coefficient of under saturated Middle East crudes using neural networks, Energy & Fuels, 11, p. 372 (1997).
Hagan, M. T., Demuth, H. B., Beal, M., Neural Network Design, PWS Publishing Company, Boston (1996).
Lang, R.I.W., A Future for Dynamic Neural Networks, Dept. Cybernetics, University of Reading, UK (2001).
Osman, E. A., Al-MArhoun, M. A., Using artificial neural networks to develop new PVT correlations
for Saudi crude oils, In: 10th Abu Dhabi
International Petroleum exhibition and conference, (2002).
Parvizian, F., Formulation a software package based on artificial neural network for prediction of P-V-T thermodynamic properties, M.S. P-V-Thesis, Arak University, Iran (2008).
Padmavathi, G., Mandan, M. G., Mitra, S. P., Chaudhuri, K. K., Neural modelling of Mooney viscosity of polybutadiene rubber, Computers and Chemical Engineering, 29, 1677-1685 (2005).
Perry, R. H., Perry’s chemical engineer’s Handbook, 7th ed., McGrow-Hill Companies (1999).
Pierre, P., A to Z of Thermodynamics, Oxford University Press (1998).
Richon, D., Laugier, S., Use of artificial neural networks for calculating derived thermodynamic quantities from volumetric property data, Fluid phase equilibria, 210, p. 247 (2003).
Sozen, A., Arcakilioglu, E., Ozalp, M., Formulation based on artificial neural network of thermodynamic properties of ozone friendly refrigerant/absorbent couples, Applied thermal engineering, 25, p. 1808 (2005).
206 A. R. Moghadassi, F. Parvizian, S. M. Hosseini and A. R. Fazlali
Smith, J. M., Van ness, H. C., Abbott, M. M.,
Chemical engineering thermodynamics, 6th,
McGraw Hill, New York (2001).
Valles, H. R., A neural network method to predict activity coefficients for binary systems based on molecular functional group contribution, M. S.
Thesis, University of Puerto Rico (2006).
Zambrano, G., Development of Neural Network Models for the Prediction of Dew point Pressure of Retrograde Gases and Saturated Oil Viscosity of Black Oil Systems, M. S. Thesis, Texas A&M University, Texas (2002).