DOI: 10.7508/ceij.2016.02.001
* Corresponding author E-mail: [email protected]
173
Distribution of Building Nonstructural Components in Height Subjected
to
Cost of Damage for Low-Rise Office Buildings
Haj Najafi, L.1* and Tehranizadeh, M.2
1
Ph.D., Department of Civil and Environmental Engineering, Amirkabir University of Technology, Tehran, Iran.
2
Professor, Department of Civil and Environmental Engineering, Amirkabir University of Technology, Tehran, Iran.
Received: 13 May 2015; Revised: 23 Sep. 2016; Accepted: 04 Oct. 2016 ABSTRACT: Exceeded losses of nonstructural components from structural ones in most demolished buildings in previous earthquakes and its limitation on functionality of critical facilities and building serviceability after earthquakes should be got the point of view for accounting loss of building as a merit for building performance. This paper attempts to demonstrate the significant role of distribution pattern of building nonstructural components in height accounting for economic losses due to seismic excitation. To achieve this purpose a new modified distribution of nonstructural components in height is proposed for three typical steel moment frame models by office occupancy and comparative assessments between two competing distribution of nonstructural components are conducted. Dealing with discussions, it could be concluded that the economic losses could be reduced by more astutely situating building nonstructural components in height considering type of dominated demands in a specific story without requirement to any alternation in component's type or quantity.
Keywords: Damage Cost, Height of Building, Incorporation of Stories, Low-Rise Buildings, Nonstructural Components, Office Occupancy.
INTRODUCTION
Despite significant improvements in seismic design codes (e.g. better detailing requirements) translating in more predictable performance of modern buildings subjected to earthquakes compared to former ones, they still suffer from shortcomings. One of the inherent and underlying deficiencies with current structural design practice is that seismic performance could not explicitly quantified according to merits explicable to stakeholders (Haselton and Deierlein, 2007).
174 structural and nonstructural components in former earthquakes such as Nisqually, Seattle earthquake occurred on February 28, 2001 (Filiatrault et al., 2001) and the Kona, Hawaii earthquake at 2006 (Chock et al., 2006; Gupta and McDonald, 2008), economic losses from damage to nonstructural components constitute far exceeded losses from structural damage in most affected buildings presenting an average factor ranging in magnitude from 5.7 to 8.4 for the nonstructural to structural damage costs. Moreover, nonstructural damage can severely limit the functionality of critical facilities such as hospitals' facilities, as demonstrated in the Northridge earthquake 1994 (McGavin and Patrucco, 1994), El Salvador earthquake 2001 (Boroschek and Retamales, 2001) and Kona, Hawaii earthquake 2006 (Chock et al., 2006). In view of development and implementation of performance-based earthquake engineering, harmonization of performance levels between structural and nonstructural components becomes vital as both of them contribute in economic losses as a merit for performance evaluation. Even if the structural components of a building
achieve a continuous or immediate operational performance level after a seismic event, failure of architectural, mechanical or electrical components can lead to inferior performance level of the entire building system. This reduction in performance caused by the vulnerability of nonstructural components has been observed during recent earthquakes worldwide.
The investment in nonstructural components and building contents is far greater than that of structural components and framing. Therefore, it is not surprising that in many past earthquakes, losses from damage to nonstructural components have exceeded losses from structural ones. Furthermore, the failure of nonstructural components can become a safety hazard or can more severely hamper safe movement of occupants evacuating buildings or of rescue workers entering buildings. According to Miranda and Taghavi (2003), nonstructural components make up approximately 82%, 87% and 92% of the total monetary investment in office, hotel and hospital buildings, respectively, in the United States (Figure 1).
175 Furthermore, damage to nonstructural components occurs at seismic intensities much lower than those required to cause structural damage (Miranda and Taghavi, 2003). Therefore, it is not surprising that in many past earthquakes, losses from damage to nonstructural building components have exceeded losses from structural damage.
In comparison to structural components and systems, there is relatively limited information and specific guidance available on seismic design of nonstructural components for multiple-performance levels. Basic research work in this area has been sparse, and the available codes and guidelines are usually, for the most part, based on past experiences, engineering judgment and intuition, rather than on objective experimental and analytical results. Often, design engineers are forced to start almost from square one after each earthquake event to observe what went wrong and to try to avoid repetitions. This is a consequence of the empirical nature of current seismic regulations and guidelines for nonstructural components (Filiatrault and Sullivan, 2014). Summaries of many principal aspects in seismic assessments of nonstructural components behavior as well as the advancement of research and code efforts in the last 30 years can be found in (Soong, 1995; Filiatrault and Christopoulos, 2002).
A performance-based earthquake engineering methodology that does carefully treat nonstructural components could be quite valuable in risk-management decision-making, such as picking out design alternatives for new construction or judging the cost-effectiveness of a seismic retrofit, when decisions affect nonstructural components (Porter, 2005).
Picking out location of some nonstructural components is an inevitable feature like the decorating in lobbies or elevator equipment in the roof stories;
however, some of the others could be changed or modified; for example by well-done partition anchoring, they could be assumed as acceleration-dependent components rather than displacement-dependent ones and their cost distributions follow different type of demand.
The focused subject of this study is the pattern of distribution of building nonstructural components in height which could affect obtained damage cost amounts subjected to earthquake loading. This study could be very supportive for architectural planning phase of the project and could provide determining location of each component in a building in view of the cost of damage subjected to earthquake loading.
PERFORMANCE GROUPS,
FRAGILITY FUNCTIONS AND
NORMATIVE QUANTITIES
176 communication equipment, computers, cooling towers, piping systems, ductwork and electrical conduits. Building contents are nonstructural components belonging to tenants or occupants of the building. They include filing cabinets, bookshelves and all pieces of furniture found inside buildings. Achieving cost amounts normalized by the story replacement value requires knowing the incorporated performance groups in each story and their normative quantities in addition to their fragility functions.
Different taxonomy (categorization system) for performance groups in building or story level have been proposed such as taxonomies developed by Antaki (2004), Porter (2005), HAZUS taxonomy for structural and nonstructural components, procurement and contacting requirements from NISTIR 6389 (NIST, 1999), classification of building elements based on UNIFORMAT II and the most commonly applied taxonomy is according to FEMA P-58-1 recommendation that is going to be utilized in this study too. Meeting objectives for taxonomic groups ensure meaningful fragility function creation; for more detail refer to (Porter, 2005). FEMA classification added some detailed subgroups to the NISTIR 6389 classification, for case in point, categorizing the structural components based on their ductility to special, intermediate or ordinary groups and dividing nonstructural components to anchored and non-anchored or based on their establishing requirements. The details for each fragility function have been achieved according to some resources:
Actual demand data: specimens tested with slowly increasing (Engineering Demand Parameter) EDP to failure, EDP at failure is known.
Bounding demand data: specimens observed in labor field, some failed, some not. Maximum EDPs are known.
Capable demand data: specimens tested in lab, none failed. Maximum EDP for each is known.
Derivation: estimate capacity with structural analysis.
Expert opinion: capacity from engineering judgment (Porter, 2011). The incorporated attributes cause to reach the number of proposed performance groups to 700 where for all of them fragility functions and their corresponding cost and repair functions have been distinguished incorporating quantity of damaged materials, relative difficulties in accessing and manipulating repair and quality of finished materials. The given information for each defined performance groups could be classified in basic identifier information, fragility information and consequence information. All of these performance groups in company with their fragility functions are provided in Appendix-D of FEMA P-58-1 and Appendix-B of ATC-58 or in a file by the name of Fragility Database (Excel file) or Fragility Specifications (PDF file) acting as a supplementary file to the cost estimating program of PACT.
177 on any predefined fragility curve by user. Lognormal probability distribution has been considered for both of the collapse and residual drift condition with statistical parameters defined by user in this code.
Utilizing FEMA specifications have some advantages. The first is dependence of the proposed fragility functions to large collection of information, reports of earthquakes and experimental data; the second is possibility of result modification chiefly based on Bayesian approach as well as the most important advantage is covering almost all fragility functions corresponding to structural and nonstructural components by gigantic details. However, the inadequacy of the FEMA's proposed group of fragility functions is the overestimation of damage cost deduced from overvaluing in the amounts of standard deviation of the fragility functions which affects severely the starting and finishing point of each fragility function. As in practice, limited number of fragility functions considered for a particular prototype building and the mentioned overestimating has been revoked by not covering all the performance groups in a building (FEMA P-58-1, 2012; Ramirez and Mirenda, 2007).
After determining incorporated performance groups, the quantity for each of the groups should be determined. There are two approaches for determining normative quantities for each performance group; the first is deterministic approach working based on specific plan for each story of the model and the second is probabilistic approach operating based on the probability of observing specific amount of a performance group among buildings by the similar type of occupancy.
For selecting a plan for deterministic approach of determining normative quantities for each performance group, some attributes should be taken in mind like architectural characteristics; the location of
building, the city vastness and social characteristics related to architecture of the model. These items affect dominantly nonstructural components than structural ones. One of the studies in this field based on deterministic approach is (Ferench, 2011) which estimated damage cost of office type buildings subjected to six different earthquake scenarios for big cities of Los Angeles, Salt Lake and Shelby illustrating very great portion of nonstructural components (ceiling, piping and partition) in damage costs of buildings.
The other study which delivers very inclusive considerate about the significance of nonstructural components in damage cost of buildings subjected to earthquakes based on some preselected deterministic plans is a work conducted by Aslani and Miranda (Aslani and Miranda, 2005). In this study, the amount of partition-like components in a story assumed to be equal to 14%, 36% and 58% of the selected plans area for each story. This study illustrates noteworthy portion of nonstructural damages subjected to regular ground motions and shows that a slight amplification in quantity of this partition-like components could intensely amplify the amounts of damage costs.
178 in this study are chosen based on the proposed quantities by FEMA P-58-1.
The point that is fine to be stated is that the location of components in a story is an important view for damage cost evaluation that is not going to be reflected in many studies and beyond the scope of this paper too; because of gigantic investigation about the possibilities and dependencies of performance groups. The focused point of this study is only dealt with the amount of each performance group in each of the stories.
Practically, the source chosen to establish cost estimation and distribution in a building is the RS Means Square Foot Costs codes (Balaboni, 2014). These codes provide cost distributions of the entire building components rather than the distributions at each story level for many different types of common building occupancies (e.g. residential high-rise, commercial low-rise, hospitals, etc.). Engineering judgment was used to translate this data into story cost distributions, while maintaining the overall building cost distribution.
Translating the building cost distribution to story distributions requires making assumptions about the variation of stories' values along building height. This will be highly dependent on how the building components are distributed amongst the different floors, which is typically a function of the occupancy of the building as well as it is the subject of this study.
Although different story cost distributions could be generated for every floor, the number of distributions served can be limited by making the following assumptions:
The entire building will be used for office space (i.e. not a mixed-use facility)
The value of the first floor has significant differences from the other floors because as the main entrance,
the layout, facades and finishes are typically different at this level.
The value of the top floor, typically the roof of the building, has distinct differences from the other floors because typically this is where most of the buildings mechanical and electrical equipment is located (this floor comprises any equipment that may be located in a mechanical penthouse).
The remaining intermediate floors are all dedicated to office occupancy. These floors will have the same story cost distribution.
Under these assumptions, it was decided that there would be three different types of story cost distributions: one for the first floor, one for the top floor, and one for the intermediate floors, which will be referred to as the typical floor.
Table 1 displays an example cost distribution for a 7-story commercial office building. The first column is the cost distribution for the entire building taken directly from RS Means (Balaboni, 2014). Based on this information, the cost distributions for the first floor, the typical floors and the top floor were approximated as shown respectively in the second, third and fourth columns of this table from the estimations by Ramirez and Miranda (2007). Most of the story cost distributions are similar to the overall building distributions with the exception of a couple of items that reflect the previously discussed features. For instance, the component group Exterior Enclosures has a higher contribution to the story cost in the first floor because it is common to have more expensive exterior
elements around the building’s main
179
Table 1. Example building and story cost distribution for mid-rise office buildings (Balaboni, 2014; Ramirez and Miranda, 2007)
Component Group
Building Distribution
(% of total building value) Story Distribution (% of story value) Total 1st Floor Typical Floor Top Floor
A. SUBSTRUCTURE
2.3 0.0 0.0 0.0
B. SHELL
B10 Superstructure 17.6 17.9 18.5 15.4
B20 Exterior Enclosure 16.3 18.8 16.2 16.9
B30 Roofing 0.6 0.0 0.0 4.5
C. INTERIORS
19.4 20.7 21.4 11.1
D. SERVICES
D10 Conveying 9.5 9.1 9.4 11.8
D20 Plumbing 1.9 1.9 1.9 2.0
D30 HVAC 13.0 12.3 12.7 17.6
D40 Fire Protection 2.6 2.6 2.7 2.8
D50 Electrical 16.8 16.6 17.2 17.9
100 100 100 100
By all discussions about cost of damage subjected to earthquake in a building and its distribution in height, this paper attempts to determine the portion of each story in the entire damage cost of a building and also to address the challenge of reducing total damage cost by redistributing building components in a proposed revised pattern.
DESCRIPTION OF STRUCTURAL
SYSTEMS AND ANALAZING
METHODS USED FOR EVALUATION
On account of the need for consideration of varieties in models' characterizations, the selected models should represent acceptably the picked out group of the buildings. Studied models in this study take only account of low-rise buildings due to dissimilar distribution of demands and also different cost distribution in mid-rise and rise buildings. For mid-rise and high-rise buildings other supplementary studies have to be conducted. In this study, three models with 3, 4 and 5 number of stories have been chosen to be representative of typical structures and analyzed through conducting nonlinear dynamic analysis. The
height of each story was assumed equal to 3.0 m. The plan of all stories was taken in to account similar with 4 spans in longitude side and 3 spans in the other side whereas the length of each span is equal to 4.0 m. The fundamental periods of the models are equal to 0.68 s, 0.85 s and 1.12 s for the models with 3, 4 and 5 number of stories respectively.
Loading has been accomplished based on ASCE7-05 by consideration of dead load equal to 620 kg/m2 and live load equal to 200 kg/m2. Design has been accomplished based on AISC 2005.
180 damping ratios in the first and second modes of vibration are assumed equal to 0.03. Modification of stiffness and damping has been done by consideration of modification factor equal to 10 based on studies conducted by Medina and Zareyian (2010). Geometric nonlinearity has been taken in to account through consideration of P-Δ effects (Lignos, 2014). Panel zone modeling has been conducted based on nonlinear behavior suggested by Gupta and Krawinkler composed up three linear fragments (Gupta and Krawinkler, 1999).
Engineering Demand Parameters (EDPs) have been assessed in three subcategories; responses in near collapse, non-collapse and responses from residual drift situations. For getting responses near collapse situation, incremental dynamic analysis (IDA) has been utilized for determining median and dispersion of spectral acceleration of collapse fragilities based on procedure developed by detail in (Vamvatsikos and Cornell, 2002); whereas, structural responses in non-collapse and residual drift situations have been derived by the help of nonlinear dynamic in company with nonlinear static analyses. All nonlinear dynamic analyses were conducted as Direct Integration Transient time history analyses using direct integration in Hilber, Hughes and Taylor's method. Nonlinear static analyzing used to determine elastic displacement for each story is conducted based on first mode distribution pattern of lateral forces.
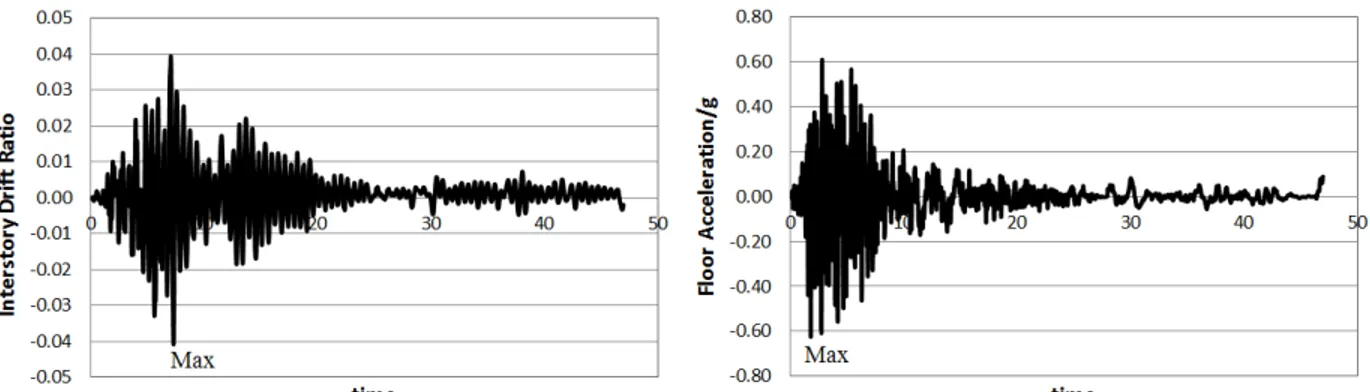
In this paper, the selected EDPs are inter-story drift ratios (IDR) and peak floor acceleration (PFA) in each story of the building similar to other conducted studies on performance-based assessment of steel structures like (Tehranizadeh and Movahed, 2011) and many related studies in this field.
Selected Ground Motions
Statistical quantities (median and standard deviation) for structural responses
could be achieved regarding some ground motion records. Concerning the number of ground motions, typical practice in structural design is to use seven motions according to ASCE05-7 and eleven ground motions according to ATC, but the appropriate number of motions is still a topic of prospect researches. It is demonstrated that the ASCE/SEI 7-10 scaling procedure is conservative if less than seven ground motions are employed and in this condition the design values of EDPs are served as the maximum values of the EDPs where if at least seven ground motions are analyzed, the design values of engineering demand parameters (EDPs) are taken as the average of the EDPs determined by the analyses. Current ground motion selection and modification (GMSM) efforts are generally focused on predicting the median response of the engineering demand parameters (EDP) under prescribed seismic loads.
The procedure of this paper for the purpose of record selection is employment of random selection of records by consideration of minimizing deviations around the geometric mean of natural logarithmic spectral acceleration values to reduce the effects of record to record variations in structural responses. The efficiency of this record selection technique has been revealed in an accomplished study by the same authors (Haj Najafi and Tehranizadeh, 2015a).
For ground motion selection, a primarily set of records is required which the records are going to be picked out from it. Many researchers prefer to randomly set records in primarily list and some other recommends choosing records as a list comprises records with all groups of specification subjected to corresponding hazard possibilities.
181 selected by Medina and Krawinkler from the Pacific Earthquake Engineering Research center (PEER) strong motion database classified as far-filed records. This list of records has been employed in many prospect researches in PEER and SAC1 centres and could be inputted for many studies in this field too (Aslani and Miranda, 2006). The earthquake magnitude in the selected primarily record set ranges in magnitude from 5.8 to 6.9 with the closest distance to rupture ranging from 13 km to 60 km.
Recorded motions could be derived from databases of PEER NGA database (PEER SGMD, 2015), COSMOS (COSMOS, 2015) or K-NET (K-Net, 2015). All ground motions were recorded on free-field sites classified as site class D according to National Earthquake Hazards Reduction Program (NEHRP) seismic provision (NIST, 2011). Most of the design codes like ASCE05-7 and seismic performance provisions like ATC-58-1 allow manipulation of this class of soil when the soil specification has not been studied and determined. The eleven selected records are presented in Table 2. It is fine to mention that any arbitrary list of records could be substituted.
The selected intensity measure for scaling procedure has been considered as spectral acceleration in the first period of the models. The efficiency of this intensity measure parameter for far-field records has been comparatively evaluated in a study by the authors (Haj Najafi and Tehranizadeh, 2015b).
The acceleration spectrum in the level of design earthquake (DE) representing 10% probability of earthquake occurrence by the
1
SAC center is a joint venture of the Structural Engineers Association of California, Applied Technology Council and Consortium of Universities for Research in Earthquake Engineering
adopted intensity measure in 50 years is going to be acquired according to ASCE05-7 procedure for each earthquake. Through calculating geomean between the design earthquake spectrums for each station, the target design earthquake spectrum will be achieved.
182
Table 2. Eleven selected records
Number Record ID Event Year Station Mw R
(km) Mechanism
PGA (g)
1 IV79e13 Imperial
Valley 1979
El Centro Array
#13 6.53 21.90 Strike-slip 0.139 2 MH84g02 Morgan Hill 1984 Gilroy Array #2 6.20 15.10 Strike-slip 0.162 3 PM73phn Point Mugu 1973 Port Hueneme 5.80 25.00 Reverse-slip 0.112
4 PS86psa N. Palm
Spring 1986
Palm Springs
Airport 6.00 16.60 Strike-slip 0.187
5 WN87wat Whittier
Narrows 1987
Carson - Water
St 6.00 24.50 Reverse 0.104
6 SF71pel San
Fernando 1971
LA - Hollywood
Store Lot 6.60 21.20 Reverse-slip 0.174
7 SH87pls Superstition
Hill 1987 Plaster City 6.70 21.00 Strike-slip 0.186
8 BM68elc Borrego
Mountain 1968
El Centro Array
#9 6.70 46.00 Strike-slip 0.057
9 LP89slc Loma Prieta 1989 Palo Alto -
SLAC Lab 6.90 36.30
Reverse-oblique 0.194
10 NR94del Northridge 1994 Lakewood - Del
Amo Blvd 6.70 59.30 Reverse-slip 0.137
11 CO83c05 Coalinga 1983 Parkfield -
Cholame 5W 6.40 47.30
Reverse-oblique 0.131
Evaluation of Structural Responses
Mentioning all EDPs elongates the paper without any constructive view to its objectives. The evaluations of structural responses have been conducted in three subcategories; Collapse assessment, non-collapse assessment and residual drift condition.
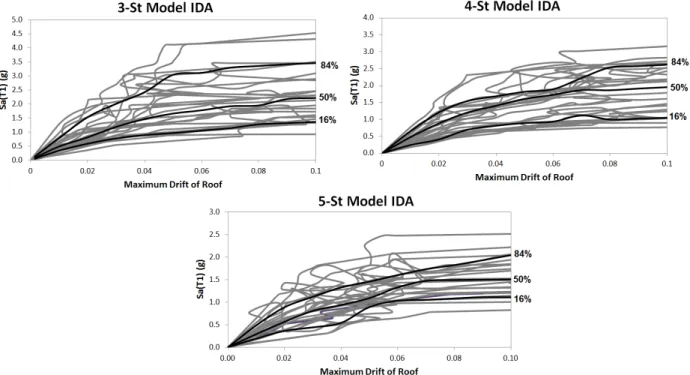
Vamvatsikos and Cornell (2002) proposed a probabilistic framework on the basis of Incremental dynamic analysis (IDA) to relate ground motion intensity to structural response and performance. In this method, the displacement capacity and transition point of a structure are calculated using a set of ground motion records. The output curves indicate the cumulative
probability of structural collapse in terms of ground motion intensity. The developed framework of IDA has been commonly applied for damage detection in numerous studies, for instance in (Shahraki and Shabakhty, 2015). In this study, IDA analyses have been accomplished utilizing both N-S and W-E direction of ground motion sets in each of the x and y direction of the models for deriving collapse fragility curves. The diagrams of IDA analyses for the models and corresponding collapse fragility curves are presented in Figures 2 and 3; in addition, the obtained statistical parameters for consideration of collapse are exhibited in Table 3.
Table 3. Collapse fragility parameters
3-St Model 4-St Model 5-St Model
Median of SCT(T1) (g) 1.863 1.526 1.372
183
Fig. 2. Results of incremental dynamic analysis for different models, spectral acceleration amount according to maximum drift of the roof story
Fig. 3. Collapse fragilities of the models
For assessing non-collapse conditions, record scaling has been done according to five levels corresponding to design level earthquake (DLE) which was calculated based on first fundamental period and consideration of the design target spectrum. The level of scaling is selected as (0.5 DLE, 1.0 DLE, …, 2.5 DLE). Nonlinear dynamic analyzing has been conducted according to the both N-S and E-W factors of the records; in this respect, the models have been analyzed subjected to 22 records in each
184
Fig. 4. Structural responses of roof story in 3-story model in scaling level of 1.5 DLE
The dispersion amounts of the EDPs are calculated by consideration of lognormal distribution of responses in each scaling level of response. The procedure for calculating dispersion factors () in each scaling levels are based on the recommendations in ATC-58 (ATC-58, 2011). The values of could be gained based on the standard deviations of logarithmic amounts of EDPs. values could be divided into three major parts, which contribute to computation by the help of Eqs. (1) and (2).
2 2
q c
m
(1)2 2
aEDP m
EDP
(2)where m: is modeling dispersion, c: is
dispersion associated with definition of the building, characteristics of the materials and available information of the building, q:
dispersion associated with modeling
strategy, aEDP: is dispersion associated with
structural responses calculated in two distinct groups of Maximum floor acceleration and inter-story drift ratio.
The ultimate calculated amounts of dispersion for three selected models are summarized in Tables 4 and 5.
Residual drift plays very important role in loss calculation. The effect of consideration of this factor in loss estimation in some cases especially systems with high ductility reach up to 50% of the loss amounts (Miranda and Ramirez, 2009). Diverse equations have been proposed by some researchers commonly based on ultimate nonlinear displacement and yield displacement of story. One of very frequently applied equations in researches (Ruiz‐García and Miranda, 2006) and also codes (ATC-58, 2011) as well as this study is the mentioned Eq. (3).
Table 4. The ultimate calculated amounts of dispersion for peak floor acceleration (PFA)
2.5 DL 2.0 DL
1.5 DL 1.0 DL
0.5 DL T (s)
0.33 0.31
0.31 0.29
0.28 0.68
0.32 0.32
0.31 0.29
0.28 0.85
0.33 0.32
0.32 0.29
0.28 1.12
Table 5. The ultimate calculated amounts of dispersion for interstory drift ratio (IDR)
2.5 DL 2.0 DL
1.5 DL 1.0 DL
0.5 DL T (s)
0.44 0.40
0.38 0.38
0.31 0.68
0.43 0.41
0.38 0.35
0.30 0.85
0.45 0.41
0.41 0.39
185
y
r
0
y y
y
r 0.3( ) 4
y y
r
( 3.1 ) 4
(3)
where Δr: is estimated median residual story
drift in a story, Δ: is computed median ultimate drift in a story gained from nonlinear dynamic analysis and Δy: is
median value for elastic drift of a story gained from static nonlinear analysis.
Static nonlinear analyzing has been performed based on ASCE/SEI 41-06 recommendation (ASCE/SEI 41-06, 2007) by utilizing gravitational load combination of (1.05 DL+0.25LL). Target drift has been considered equivalent to 0.1 and distribution of lateral load was based on first mode. The results of elastic drifts for each story of the models are presented in Table 6. Availability of nonlinear dynamic analyses results in company with elastic drifts and utilizing Eq. (4) contribute to residual drift ratios for models under each of the 22 records.
The dispersion values are calculated according to the Eqs. (1) and (2) by consideration of the calculated residual drifts values.
Fragility functions for non-collapse condition are derived from FEMA P-58-1 Specification. Selected fragility functions and associated performance groups and their normative quantities were discussed earlier in this paper. For collapse condition fragility functions for each model were derived from IDA analysis mentioned in Figure 3 and Table 3.
For consideration of residual drifts in loss calculations, repair fragility has been hired. The repair fragility is a lognormal distribution, typically having a median value of 1% of the residual drift and dispersion of 0.3 (ATC-58, 2011). In this study, the repair fragility function mentioned in ATC-58 has been used for consideration of residual drifts
in loss calculations similar to most of the studies which were considered this aspect like (Ruiz-García and Miranda, 2008).
DEFINITION OF THE COST MODEL IN PACT
The program PACT computes cost of damage (that is the governing concern of this paper) based on the component, collapse and repair fragility functions. Most of these fragilities are available by default in this program based on FEMA P-58-1 or ATC-58 or could be defined manually. PACT has been conducted on the foundation of Monte Carlo simulation in each try called in this program as a realization. The number of realizations in this study has been assumed equal to 200 which could influence the accuracy of the results as well as time of analyzing. There are so many non-structural components in a building that measuring them all is not feasible in terms of time and effort; however, the type and normative quantities of the applied performance groups in this study are developed based on FEMA P-58-1 recommendation which has been exclusively discussed formerly in this paper as well as referred in Appendix 1 of this paper in detail.
186
Table 6. Elastic drift for each story of the models in both x and y direction
5-Story Model 4-Story Model
3-Story Model
y-dir x-dir
y-dir x-dir
y-dir x-dir
0.017 0.016
0.014 0.014
0.013 0.011
Story 1
0.017 0.017
0.016 0.015
0.012 0.013
Story 2
0.018 0.017
0.017 0.016
0.011 0.013
Story 3
Table 7. The percentage of the amounts of damage cost for each story according to different intensity levels for the 3-story model with fundamental period of 0.68 s
Intensity Levels
Story Damage Cost to the Cost of Each Story (%) Total Damage Cost to the Cost of Entire Building
(%) First Story Typical Story Roof Story
IDR PFA IDR PFA IDR PFA
0.5 DLE 4.3 7.4 5.3 7.0 2.9 8.7 8.4
1.0 DLE 15.6 14.5 15.4 14.6 7.8 11.6 20.6
1.5 DLE 26.9 25.1 28.1 23.4 28.2 18.0 35.1
2.0 DLE 34.8 37.1 36.0 32.0 40.8 24.2 47.4
2.5 DLE 38.0 39.7 38.4 34.3 45.2 26.3 51.0
Table 8. The percentage of the amounts of damage cost for each story according to different intensity levels for the 4-Story model with fundamental period of 0.85 s
Intensity Levels
Story Damage Cost to the Cost of Each Story (%)
Total Damage Cost to the Cost of Entire
Building (%) First Story Typical Story
(2nd + 3rd Stories) Roof Story
IDR PFA IDR PFA IDR PFA
0.5 DLE 7.1 5.7 8.7+6.7 6.1+6.2 3.9 5.8 12.6
1.0 DLE 17.4 16.8 16.9+9.8 16.9+17.4 5.1 13.4 28.7 1.5 DLE 30.5 27.7 31.4+27.4 25.9+25.6 24.9 20.3 53.6 2.0 DLE 40.7 34.4 39.2+32.5 31.2+31.4 34.9 24.7 67.4 2.5 DLE 45.8 38.1 46.8+36.0 34.9+34.2 38.4 27.3 75.6
Table 9. The percentage of the amounts of damage cost for each story according to different intensity levels for the 5-Story model with fundamental period of 1.12 s
Intensity Levels
Story Damage Cost to the Cost of Each Story (%) Total Damage Cost to the Cost of Entire Building
(%) First Story Typical Story
(2nd + 3rd + 4th Stories) Roof Story
IDR PFA IDR PFA IDR PFA
0.5 DLE 1.5 4.6 4.2+5.6+4.4 4.5+4.5+5.1 2.0 3.9 8.1 1.0 DLE 7.3 11.7 22.6+21.2+16.0 12.0+11.8+12.2 8.7 9.5 27.0 1.5 DLE 21.8 19.0 27.9+26.9+21.5 18.2+17.9+17.9 16.2 14.2 40.7 2.0 DLE 34.7 26.5 40.3+40.7+32.0 21.1+20.9+19.9 32.5 19.7 57.8 2.5 DLE 42.4 32.0 46.8+46.7+34.4 29.5+29.4+29.4 36.0 23.2 70.4
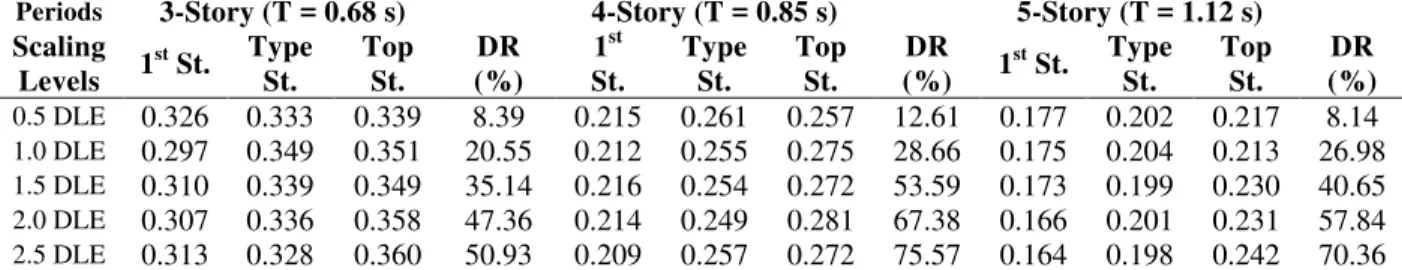
The contribution portion for each story in the entire building's damage cost could be calculated due to the evaluated damage cost for all the models subjected to different scaling levels. The results, for different fundamental periods and different scaling levels are displayed in Table 10. For illustrating the impact of component distribution in height on total damage cost of building the ratio of DR has been defined as
187
Table 10. Percentage of incorporation for each story in the total damage cost and the percentage of total damage cost to the total replacement cost of building (DR) according to different fundamental periods and different scaling levels
Periods 3-Story (T = 0.68 s) 4-Story (T = 0.85 s) 5-Story (T = 1.12 s) Scaling
Levels 1
st St. Type
St.
Top St.
DR (%)
1st St.
Type St.
Top St.
DR (%) 1
st St. Type
St.
Top St.
DR (%) 0.5 DLE 0.326 0.333 0.339 8.39 0.215 0.261 0.257 12.61 0.177 0.202 0.217 8.14
1.0 DLE 0.297 0.349 0.351 20.55 0.212 0.255 0.275 28.66 0.175 0.204 0.213 26.98
1.5 DLE 0.310 0.339 0.349 35.14 0.216 0.254 0.272 53.59 0.173 0.199 0.230 40.65
2.0 DLE 0.307 0.336 0.358 47.36 0.214 0.249 0.281 67.38 0.166 0.201 0.231 57.84
2.5 DLE 0.313 0.328 0.360 50.93 0.209 0.257 0.272 75.57 0.164 0.198 0.242 70.36
It could be observed that by increasing intensity level of spectral acceleration, the incorporation of displacement-dependent components has been decreased resulting in reduction of contribution portion for first story in the damage cost. However, the amplification of intensity level brings about intensification of contribution portion for acceleration-dependent components which are generally situated in top story. Also by increasing the number of stories and consequently the period of structures, the involvement of the typical stories increased bringing about reduction in portion of top and first floors where by increasing the intensity level, the impact of fundamental period of the models has been degraded.
Then, the strategies of situating displacement or acceleration-dependent components could be determined according to some indexes such as intensity level of earthquake, number of stories and period of the building.
In small earthquake intensities by transferring acceleration-dependent elements to the lower stories, the cost of damage could be reduced according to less gained accelerations in these stories and also according to further incorporation of lower stories in building damage costs. In the other hand, by increasing the scaling level of spectral acceleration intensity, if one could distribute displacement-dependent component in a way to afford larger portion of contribution to the upper stories, or by altering the type of components from displacement-dependent to
acceleration-dependent by well-done anchoring the components, the cost of damage has been decreased.
In some levels of intensity, the contribution portions of stories go across equality like the intensity of 0.5DLE for the 3-story model or 1.5DLE for the 4-story model. Although this situation is very ideal for investment, its occurrence would not guarantee the least amount of damage cost subjected to seismic excitation because of diverse structural responses and in addition dissimilar component distribution in different stories. However, it could be usually assure degrading entire building cost of damage in non-collapse situation of response and also profitability of investment in each of the building's stories. In the other word, it is the wisdom of designer to keep in mind the cost of damage subjected to earthquake as a decision making issue for determining the situation of nonstructural components.
Proposed Modified Pattern
Some procedures for modifying incorporations of stories could be followed which could be classified as modifications in structural responses and modifications in distribution of components.
188 dependent demands, respectively. There are lots of structural design approaches for applying these modifications which are not the concern view of this paper. The focused feature of this paper is on the modifications in distributions of components which derive in modifications in incorporation of stories in the total cost of damage for a typical low-rise building and conclude to less amounts of loss without any alternation in the presumed quantity for each performance groups.
For instance, some of the proposed modifications in this paper are as follow:
Moving chiller equipment
(D3031.011a) from roof story to the first story.
Moving cooling tower (D3031.021a) from roof story to the first story.
Moving motor control center (D5012.013a) from roof story to the
first story.
Decreasing decorating expenses in first story by moving them to the 2nd story or completely anchoring the components; so, they could be removed from the first story.
Moving electronic equipment from first story to the 2nd story.
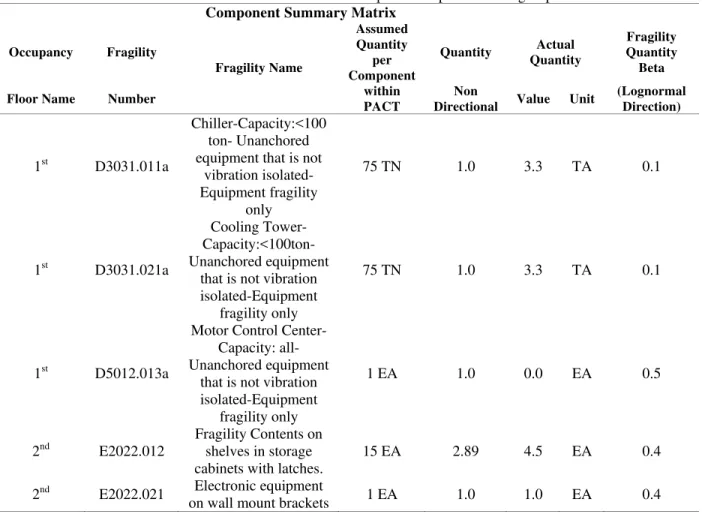
So, the proposed component summary matrix by FEMA P-58-1 which has been stated in Appendix 1 of this paper could be adapted in some cases as mentioned in Table 11. The distributions of the other components are as formerly mentioned in Appendix 1 of this paper. For simplifying comparative referring purposes, Table 11 also lists equivalent performance group codes subjected to FEMA loss-estimation framework.
Table 11. Modified distributions of the presumed performance groups
Component Summary Matrix
Occupancy Fragility
Fragility Name
Assumed Quantity
per Component
Quantity Actual Quantity
Fragility Quantity Beta
Floor Name Number within
PACT
Non
Directional Value Unit
(Lognormal Direction)
1st D3031.011a
Chiller-Capacity:<100 ton- Unanchored equipment that is not
vibration isolated-Equipment fragility
only
75 TN 1.0 3.3 TA 0.1
1st D3031.021a
Cooling Tower- Capacity:<100ton- Unanchored equipment
that is not vibration isolated-Equipment
fragility only
75 TN 1.0 3.3 TA 0.1
1st D5012.013a
Motor Control Center- Capacity: all- Unanchored equipment
that is not vibration isolated-Equipment
fragility only
1 EA 1.0 0.0 EA 0.5
2nd E2022.012
Fragility Contents on shelves in storage cabinets with latches.
15 EA 2.89 4.5 EA 0.4
2nd E2022.021 Electronic equipment
189 Evaluation of the Results
As the modifications are not as structural type, the structural responses of the models have not altered and the previously gained results could be utilized for new analyses too. The amounts of damage cost and the portion of contribution of each story in the damage cost of the models based on the modified distribution of components are presented in Table 12 for different models subjected to different intensity levels.
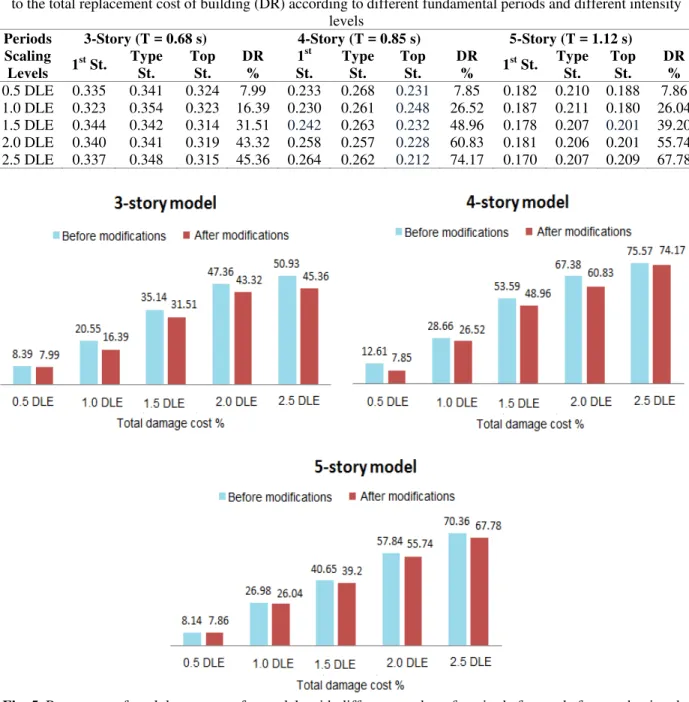
The results demonstrate prominent standing of the performance group's distribution in height of models. By application of these straightforward proposed modifications without any alternation in the amounts of performance groups or in structural characteristics of the models, the cost of damage in all of the models has been declined subjected to all assumed fundamental periods and all intensity levels. Although this reduction is not too considerable in the percentage of total damage cost of building in some cases; assuming the amount of building cost in dollars, this reduction could save great expenses particularly for the models with large areas and thus large initial costs. As for models with larger areas, both of the initial cost and normative quantities for performance groups are excessively greater than the presumed amounts for considered typical models of this study. To complement the results from the analyses, the percentages of total damage costs could be compared in different intensity levels before and after application of the proposed modifications for different models by the help of the diagrams in Figure 5.
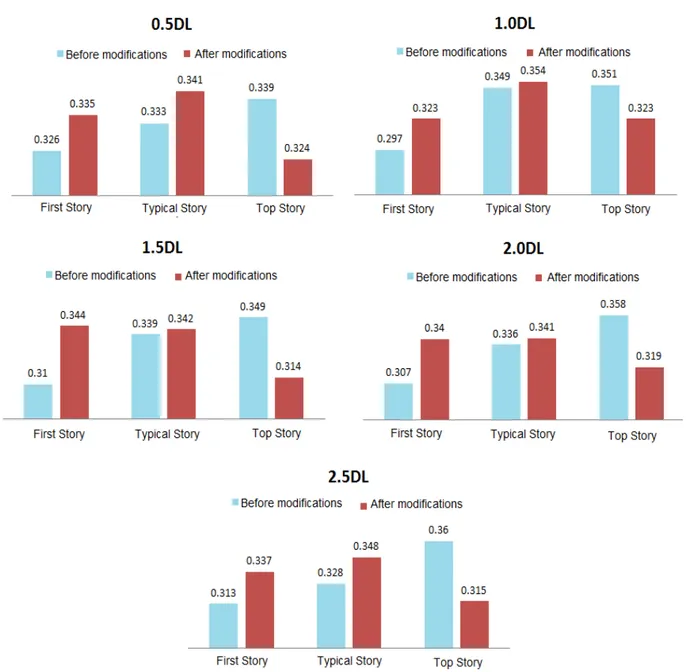
The more significant impact of the proposed modifications is on the portion of incorporation of each story in the total damage cost of building. By conducting the recommended modifications, the portions of incorporation for the first and typical stories increase especially for low scaling levels of
intensities. This amplification is more intense in the first floor than the typical ones and further in 3-story building than the 4 or 5-story ones; because of fewer number of typical stories permits to the first floor to play more significant role in making cost of damage. In addition, new proposed distribution pattern of components indicates in almost near to equivalent portion of incorporation for the stories in the total damage cost of building.
For more evidently demonstrating the effects of the recommended modified distribution of components on the contribution portion of each story in different models, Figures 6 to 8 could be very supportive presenting intensification in participation part of lower stories and reduction in participation part of upper stories in the total damage cost especially for low intensity earthquakes.
190
Table 12. Percentage of incorporation for each story in the total damage cost and the percentage of total damage cost to the total replacement cost of building (DR) according to different fundamental periods and different intensity
levels
Periods 3-Story (T = 0.68 s) 4-Story (T = 0.85 s) 5-Story (T = 1.12 s) Scaling
Levels 1
st St. Type
St.
Top St.
DR %
1st St.
Type St.
Top St.
DR
% 1
st St. Type
St.
Top St.
DR %
0.5 DLE 0.335 0.341 0.324 7.99 0.233 0.268 0.231 7.85 0.182 0.210 0.188 7.86 1.0 DLE 0.323 0.354 0.323 16.39 0.230 0.261 0.248 26.52 0.187 0.211 0.180 26.04 1.5 DLE 0.344 0.342 0.314 31.51 0.242 0.263 0.232 48.96 0.178 0.207 0.201 39.20 2.0 DLE 0.340 0.341 0.319 43.32 0.258 0.257 0.228 60.83 0.181 0.206 0.201 55.74 2.5 DLE 0.337 0.348 0.315 45.36 0.264 0.262 0.212 74.17 0.170 0.207 0.209 67.78
Fig. 5. Percentage of total damage cost for models with different number of stories before and after conducting the proposed modifications for components' distribution in height
CONCLUSIONS
This paper illustrates the significant role of distribution of nonstructural performance groups in height of models and its impact on stories incorporations and thus profitability of investments and also in the amounts of the total damage costs by assessing the cost of damage as a performance merit for two
competing nonstructural distributions (one commonly applied which has been recommended in associated codes and one modified distribution which has been proposed by the authors). Some of the obtained conclusions from the paper could be mentioned as:
acceleration-191 dependent components could be determined according to some factors like intensity level of earthquake, number of stories and period of the building.
In small earthquake intensities by conveying acceleration-dependent elements to the lower stories, the cost of damage could be reduced according to less gained accelerations in these stories and also according to further incorporation of lower stories in
building damage costs. In the other hand, by increasing the scaling level of spectral acceleration intensity, if one could distribute displacement-dependent component in a way to afford larger portion of contribution to the upper stories, or by altering the
type of components from
displacement-dependent to
acceleration-dependent by well-done anchoring the components, the cost of damage has been decreased.
192
Fig. 7. Percentage of incorporation of stories in total damage cost for 4-Story model subjected to different scaling intensity levels for two competing nonstructural distributions
By the straightforward proposed modifications without any alternation in the amounts of performance groups or in structural characteristics of the models, the cost of damage in all of the models has been declined subjected to all assumed fundamental periods and all intensity levels. This reduction could save great expenses particularly for the models with large areas and thus large initial costs.
193 making cost of damage.
New proposed distribution pattern of nonstructural components indicates in almost near to equivalent portion of incorporation for the stories in the total damage cost of building. Although uniformly distributed costs in height of building do not insure less total damage cost in all cases, the equivalent incorporation of stories in damage costs could insure the profitability of the built investment in each story; Noticing the fact that
nonstructural components account for most of the total investment in a typical office building. While for the models of this study, the evaluations exhibit reduction in total amounts of damage costs in all situations just by application of the proposed modifications in the pattern of component distribution in height without any alternation in specification or quantity of the incorporated components.
194 REFERENCES
AISC. (2005). Manual of steel construction, AISC 2005. American Institute of Steel Construction, Chicago, Illinois, United States.
Alavi, B. and Krawinkler, H. (2000). “Consideration of near-fault ground motion effects in seismic design”,Proceeding of the 12th World Conference on Earthquake Engineering, Auckland, New Zealand.
ASCE. (2007). Seismic rehabilitation of existing buildings, ASCE/SEI 41-06. American Society of Civil Engineers, Reston, United States.
ATC-58. (2011). Guidelines for seismic performance assessment of buildings, ATC-58. Applied Technology Council, Washington D.C. Retrieved
October 13, 2014, from
https://www.atccouncil.org/pdfs/ATC-58-50persentDraft.pdf
ASCE. (2010). Minimum design loads for buildings and other structures, ASCE/SEI 7-10. American Society of Civil Engineers, Reston, Virginia, United States.
Aslani, H. and Miranda, E. (2005). “Probabilistic earthquake loss estimation and loss disaggregation in buildings”, Report 157, Ph.D. Dissertation, John A. Blume Earthquake Engineering Center, Stanford University, United State.
Balaboni, B. (2014). RSmeans square foot costs 2014,
RSMeans Engineering Department, 35th ed. New York, United States.
Boroschek, R. and Retamales, R. (2001). “Damage observed in El Salvador's public hospital system during the January 13, 2001 earthquake”, WHO/PAHO Collaborating Center for Disaster Mitigation in Health Facilities, University of Chile, Santiago, Chile.
Chock, G., Robertson, I., Nicholson, P., Brandes, H., Medley, E., Okubo, P., Hirshorn, B., Sumada, J., Kindred, T., Linurna, G., Sarwar, A., Dal Pino, J. and Holmes, W. (2006). “Compilation of observations of the October 15, 2006, Kiholo Bay (Mw 6.7) and Mahukona (Mw 6.0) earthquakes, Hawaii”, Report 31, Earthquake Engineering Research Institute, Oakland, United State. COSMOS Ground Motions Databases, Retrieved
May 05, 2016, from http://db.cosmos-eq.org/scripts/default.plx
FEMA. (2009). Quantification of building seismic performance factors, FEMA P695, Building Seismic Safety Council for the Federal Emergency Management Agency, Federal Emergency Management Agencies, Washington D.C.
FEMA. (2012). Seismic performance assessment of buildings, Volume 1 – Methodology,FEMA P-58-1, Building seismic safety council for the Federal Emergency Management Agency, Federal Emergency Management Agencies, Washington D.C.
FEMA. (2012), Seismic performance assessment of buildings, Volume 3 - Supporting Electronic Materials and Background Documentation: 3.1
Performance Assessment Calculation Tool
(PACT), Version 2.9.65, FEMA P-58-3, Building Seismic Safety Council for the Federal Emergency Management Agency, Federal Emergency Management Agencies, Washington, D.C.
Filiatrault, A. and Christopoulos, C. (2002). “Guidelines, specifications, and seismic performance characterization of nonstructural building components and equipment”, Report PEER 2002/05, Pacific Earthquake Engineering Research Center, Berkeley, CA.
Filiatrault, A., Kuan, S. and Tremblay, R. (2004). “Shake table testing of bookcase – partition wall systems”, Canadian Journal of Civil Engineering, 31(4), 664-676.
Filiatrault, A. and Sullivan, T. (2014). “Performance-based seismic design of nonstructural building components: The next frontier of earthquake engineering”, Earthquake Engineering and Engineering Vibration, 13(1), 17-46.
French, S.P. (2012). “Modeling nonstructural damage for metropolitan building stocks”, Proceedings of the 15th World Conference on Earthquake Engineering, Lisbon, Portugal.
Gupta, A. and Krawinkler, H. (1999). “Seismic demand for performance evaluation of steel moment resisting frames structures”, Report 132, Ph.D. Dissertation, John A. Blume Earthquake Engineering Center, Stanford University, United State.
Gupta, A. and McDonald, B. M. (2008). “Performance of building structures during the October 15, 2006 Hawaii earthquake”,
Proceedings of the 14th World Conference on Earthquake Engineering, Beijing, China.
Haj Najafi, L. and Tehranizadeh, M. (2015a). “Ground motion selection and scaling in practice”, Peryodica Polytechnica - Civil Engineering, 59(2), 233-248.
Haj Najafi, L. and Tehranizadeh, M. (2015b). “Selecting appropriate intensity measure in view of efficiency”, Civil Engineering Infrastructures Journal, 48(2), 269-287.
195 Report 156, Ph.D. Dissertation, John A. Blume Earthquake Engineering Center, Stanford University, United States.
Haselton, C.B., Goulet, C.A., Mitrani-Reiser, J., Beck, J.L., Deierlein, G.G., Porter, K.A., Stewart, J.P. and Taciroglu, E. (2008). “An assessment to benchmark the seismic performance of a code-conforming reinforced concrete moment-frame building”, PEER Report 2007/12, Pacific Earthquake Engineering Research Center, College of Engineering, University of California, Berkeley, United States.
Ibarra, L. F., Medina, R. A. and Krawinkler, H. (2005). “Hysteretic models that incorporate strength and stiffness deterioration”, Earthquake Engineering and Structural Dynamic, 34(12), 1489-1511.
K-Net. (2015). “Strong-motions seismograph networks”, Retrieved May 05, 2016, from http://www.k-net.bosai.go.jp
Krawinkler, H. and Medina, R. (2004). “Seismic demands for nondeteriorating frame structures and their dependence on ground motions”, Report EER 2003/15, Pacific Earthquake Engineering Research Center, University of California at Berkeley, Berkeley, CA.
Lignos D.G., Krawinkler H. and Whittaker, A.S. (2011). “Prediction and validation of sideway collapse of two scale models of a 4-story steel moment frame”, Earthquake Engineering and Structural Dynamics,40(7), 807-825.
Lignos, D.G. and Krawinkler, H. (2012). “Sideway collapse of deteriorating structural system under seismic excitations”, Report 177, Ph.D. Dissertation, John A. Blume Earthquake Engineering Center, Stanford University, United State.
Lignos, D.G. and Krawinkler, H. (2013). “Development and utilization of structural component databases for performance-based earthquake engineering”, Journal of Structural Engineering, 139(8), 1382-1394.
Lignos, D.G. (2014). “Modeling steel moment resisting frames with OpenSees”, OpenSees Workshop, University of California, Berkeley, United States.
McGavin, G. and Patrucco, H. (1994). “Survey of nonstructural damage to healthcare facilities in the January 17, 1994 Northridge earthquake”, Report prepared for HMC Group, Ontario, Canada. Mehanny, S. S. F. (1999). “Modeling and assessment
of seismic performance of composite frames with reinforced concrete columns and steel beams”, Report 135, Ph.D. Dissertation, John A. Blume Earthquake Engineering Center, Stanford University, United State.
Miranda, E. and Ramirez, C.M. (2009). “Building-specific loss estimation methods and tools for simplified performance-based earthquake engineering”, Report 171, Ph.D. Dissertation, John A. Blume Earthquake Engineering Center, Stanford University, United State.
Nau, J. and Hall, W. (1984). “Scaling methods for earthquake response spectra”, Journal of Structural Engineering, ASCE, 110(2), 91-109. NIST. (1999). UNIFORMAT II elemental
classification for building specifications, cost estimating, and cost analysis, NISTIR 6389, National Institute of Standards and Technology, Washington, D.C., Retrieved May 05, 2016, from http://www.bfrl.nist.gov/oae/publications/nistirs/6 389.pdf
NIST. (2011). Soil-structure interaction for building
structures, NIST/GCR 11-917-14, NEHRP
Consultants Joint Venture for the National Institute of Standards and Technology, Gaithersburg, Maryland.
Pacific Earthquake Engineering Research Center, Retrieved May 05, 2016, from www.peertestbeds.net
PEER Strong Ground Motion Database, Retrieved May 05, 2016, from http://peer.berkeley.edu/ peer_ground_motion_database.
Porter, K.A. (2005). “A taxonomy of building components for performance-based earthquake engineering”, Department of Civil Engineering and Applied Mechanics California Institute of Technology, PEER Award number EEC-9701568, Report PEER 2005/03, Pacific Earthquake Engineering Research Center, University of California at Berkeley, Berkeley, CA.
Porter, K.A., Johnson, G. Sheppard R. and Bachman, R. (2011). “Response to discussions of fragility of mechanical, electrical and plumbing equipment”,
Earthquake Spectra, 27(1), 229-233.
Ramirez, C. and Miranda, E. (2009). “Building-specific loss estimation methods and tools for simplified performance-based earthquake engineering”, Report 171, Ph.D. Dissertation, John A. Blume Earthquake Engineering Center, Stanford University, United States.
Ruiz‐García, J. and Miranda, E. (2006). “Residual displacement ratios for assessment of existing structures”, Earthquake Engineering and Structural Dynamics, 35(3), 315-336.
Ruiz‐García, J. and Miranda, E. (2008). “Probabilistic seismic assessment of residual drift demands in existing buildings”, Proceeding of the 14th World Conference on Earthquake Engineering Beijing, China.
196 Application of response surface method and systemic approach”, Civil Engineering Infrastructures Journal, 48(1), 47-68.
Shome, N., Cornell, C.A., Bazzurro, P., and Carballo, J.E. (1998). “Earthquakes, records and nonlinear responses”, Earthquake Spectra, 14(3), 469-500. Soong, T.T. (1995). “Seismic behavior of
nonstructural elements-state-of-the-art-report”,
Proceedings of the 10th European Conference on Earthquake Engineering, Vienna, Austria. Taghavi, S., and Miranda, E. (2003). “Response of
nonstructural building elements”, Report PEER 2003/05, Pacific Earthquake Engineering Research Center, University of California at Berkeley, Berkeley, CA.
Tehranizadeh, M. and Movahed, H. (2011). “Evaluation of steel moment-resisting frames performance in tall buildings in near fault areas”, Civil Engineering Infrastructures Journal, 44(5), 621-633.
Vamvatsikos, D. and Cornell C.A. (2002). “Incremental dynamic analysis”, Earthquake Engineering and Structural Dynamics, 31(3), 491-514.