© 2012 M. Cline et al., This open access article is distributed under a Creative Commons Attribution (CC-BY) 3.0 license
doi:10.3844/ajavssp.2012.218.225 Published Online 7 (4) 2012 (http://www.thescipub.com/ajavs.toc)
Corresponding Author: Martha Cline, Department of Small Animal Clinical Sciences,
University of Tennessee, College of Veterinary Medicine, Knoxville, TN, USA
COMPARISON OF HIGH FIBER AND LOW CARBOHYDRATE
DIETS ON OWNER-PERCEIVED SATIETY OF CATS DURING
WEIGHT LOSS
Martha Cline, Angela Witzel,
Tamberlyn Moyers, Joseph Bartges and Claudia Kirk
Department of Small Animal Clinical Sciences,
University of Tennessee, College of Veterinary Medicine, Knoxville, TN, USA
Received 2012-10-11, Revised 2013-01-07; Accepted 2013-01-08
ABSTRACT
Food-seeking behaviors exhibited by cats during weight loss programs are frustrating to owners. Two categories of therapeutic weight loss diets are available for cats: High Fiber (HF) and Low Carbohydrate (LC). The objective of this study was to determine if cat owners perceive a difference in satiety when their cats are fed either a HF or LC diet during a weight loss regimen. Twenty-eight client-owned cats were randomly assigned to either an HF or LC canned diet and fed to 80% of their ideal weight resting energy requirements. Cats were rechecked at 2, 4, 6 and 8 weeks and food intake adjusted to maintain weight loss between 0.5-1% per week. Seventeen cats completed the 8-week weight loss study (HF = 10, LC = 7). Owners completed behavior questionnaires at each visit and were blinded to food assignments. The two diet groups did not differ significantly by age, sex, body condition score, caloric intake, or rate of weight loss during the study. The two diets did not differ by owner response to questionnaire. In conclusion, owners perceived cats to be equally satiated during weight loss regimens on both the HF and LC diets.
Keywords: Satiety, Low Carbohydrate, High Fiber, Weight Loss
1. INTRODUCTION
Data from the 1990s revealed that approximately 35% of adult cats in the United States were overweight or obese and more recent data from New Zealand demonstrates a prevalence of cats with a Body Condition Score (BCS) greater than 6/9 of 27% (Cave et al., 2012; Lund et al., 2005). Sixty-three percent of cats from the latter study had a BCS of 6/9 or greater. Although weight loss programs for cats are easy to establish, the negative behaviors exhibited by hungry cats can be one of the largest hindrances to successful weight loss. Therefore, owner compliance is one of the most important factors in achieving weight loss in cats.
Intra-meal satiety, is the process of feeling full and ending food consumption during the course of eating. Inter-meal satiety, on the other hand, occurs after the food has been consumed. This type of satiety can delay
glucagon-like peptide 1 and peptide YY and suppressing the appetite-stimulating hormone ghrelin (Little and Feinle-Bisset, 2011). Therefore, weight loss diets that contain moderate to high levels of fat may increase satiety. Additionally, insoluble or soluble fiber added to the diets of humans can improve post-meal satiety, decrease hunger and have a greater satiety value compared to digestible complex and simple carbohydrates (Gerstein et al., 2004; Howarth et al., 2001).
Two studies looking at satiety related to macronutrient composition in dogs had similar findings demonstrating that fiber increases satiety in dogs by decreasing their voluntary food intake when offered (ad libitum) a diet supplemented with fiber versus a low-fiber diet (Jewell and Toll, 1996; Jackson et al., 1997). Another study in dogs found that the addition of either soluble or insoluble fiber to a diet formulated for weight loss had no beneficial effect on satiety, as measured by a challenge meal and or the perception of hunger as represented by behavioral characteristics (Butterwick and Markwell, 1997). This study differed from the previously mentioned studies because the investigators measured satiety in overweight dogs that were subjected to calorie restriction to induce weight loss. These findings suggest that the effects of fiber on satiety during weight loss may be lost due to calorie restriction. Another study found that dogs fed a diet both high in protein and fiber were more satiated than dogs fed either protein or fiber alone, as measured by voluntary food intake during an energy-restricted meal (Weber et al., 2008). These results suggest that with the addition of high protein, a high fiber diet may retain its satiating effects in dogs. Lastly, in one study, satiety-related metabolites (postprandial plasma glucose, insulin, peptide YY, total Glucagon-Like Peptide-1 [GLP-1] and total ghrelin concentration) and voluntary food intake were measured using two diets: a low-fermentable and high-fermentable fiber diet (Bosch et al., 2009). The dogs consuming the highly fermentable fiber diet had a lower voluntary food intake at the end of the study, but there were no differences in satiety-related metabolites between the two groups, suggesting that the mechanism for satiety related to the highly fermentable fiber is unknown.
Little clinical data is available regarding investigating diet composition on satiety in cats. However, canned food reportedly decreases voluntary energy intake and body weight in cats fed ad libitum when compared to a dry formulation with the same nutrient composition (Wei et al., 2001). These results suggest that canned food may help promote weight loss in cats. Canned foods have higher water, lower
carbohydrate and higher protein content levels than dry food. In a group-housed setting, cats on either a low-carbohydrate or high-fiber dry formulation lost weight when their feedings were time limited regardless of diet type, even when their energy intake was restricted to the same degree (Michel et al., 2005).
There are currently two main categories of therapeutic feline weight loss diets available: those that are high in fiber and reduced in fat and those that are low in fiber and carbohydrates and moderately high in fat. Little data is available comparing feline satiation behaviors on different diet types during weight loss. With the current epidemic of feline obesity, it is critical that veterinarians find ways to improve owner compliance with weight loss programs. For this report, the two extremes of commercially available, therapeutic weight loss diets, Low Carbohydrate (LC) and High Fiber (HF), were compared to determine if owners can detect behavioral differences in cats on these two diet types. We hypothesize that cat owners feeding an HF canned food during weight loss would observe fewer negative behaviors associated with weight loss than owners feeding an LC canned food.
2. MATERIALS AND METHODS
2.1. Animals
This study was a randomized, single-blinded field trial using client-owned healthy cats between the ages of 1-14 years with a Body Condition Score (BCS) of 6/9 or greater. Cats were recruited from staff and students at The University of Tennessee College of Veterinary Medicine. Inclusion criteria for cats included indoor only, spayed or neutered and willingness to eat an exclusively canned diet. Any cats with known metabolic disease such as hyperthyroidism or diabetes mellitus or with a history of polyuria/polydipsia or recent weight loss were excluded. All experimental protocols were approved by the university’s Institutional Animal Care and Use Committee and the owners gave their informed consent to participate in the study.
2.2. Diets
2.3. Protocol and Monitoring
At week 0, cats underwent physical examination, body weight measurement and BCS assessment. Ideal body weight was estimated by two separate investigators by correlating body fat percentages to the current 9-point BCS system (Laflamme, 1997). Caloric needs for weight loss were estimated using ideal body weight with the
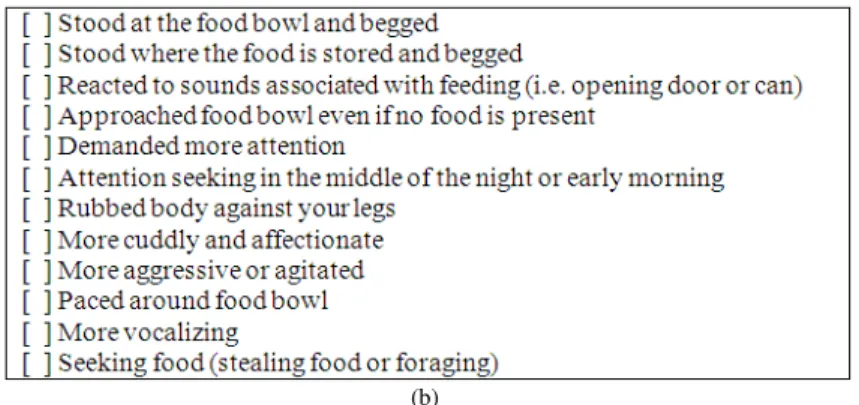
equation (BWkg)0.75×70x×0.8, where BW is body weight and 0.8 is life stage factor (NRC, 2006). Cats were randomly assigned either the LC or HF canned food and recommendations were made to the owner on how much to feed. Owners were instructed to feed their cats twice daily. Owners filled out a complete diet history form and a baseline behavior questionnaire (Fig. 1a and b).
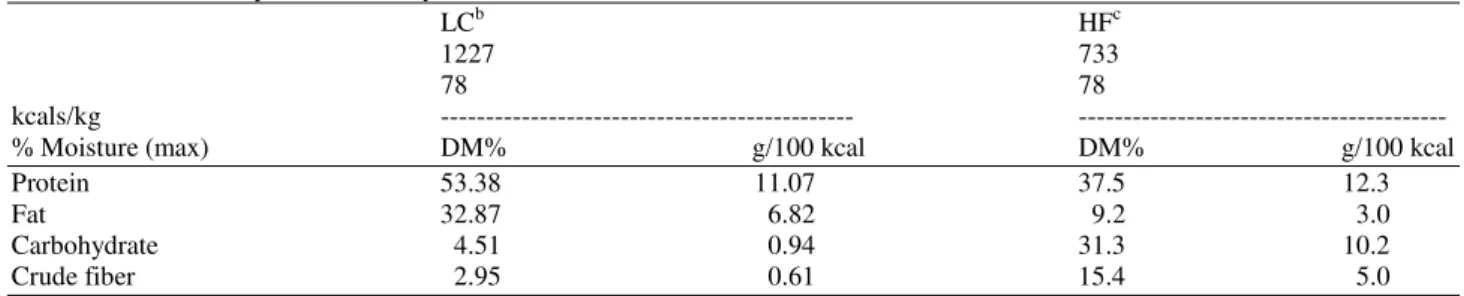
Table 1. Nutrient composition of study dietsa
LCb HFc
1227 733
78 78
kcals/kg --- ---
% Moisture (max) DM% g/100 kcal DM% g/100 kcal
Protein 53.38 11.07 37.5 12.3
Fat 32.87 6.82 9.2 3.0
Carbohydrate 4.51 0.94 31.3 10.2
Crude fiber 2.95 0.61 15.4 5.0
a
; All data from manufacturers. b; Purina DM Feline Formula canned, Nestle-Purina, St. Louis, MO. c; Hill’s Prescription Diet r/d Feline canned, Hill’s Pet Nutrition, Topeka, KS
(b)
Fig. 1. (a) Behavior questionnaire-multiple choice questions (b) Behavior questionnaire-negative behavior checklist
Cats were re-examined at weeks 2, 4, 6 and 8. At these rechecks, body weight and BCS were assessed and rate of weight loss was calculated. If the rate of weight loss was <0.5% or >1% body weight per week, then the food dose was adjusted to maintain a weight loss rate between 0.5-1% of body weight per week. A behavior questionnaire was filled out by the owners at each recheck appointment.
2.4. Statistical Analysis
Statistical tests were performed using two different computer-based statistical software programs. Logistic regressions, plots and t tests were run with SPSS, version 19 (IBM, Armonk, NY). The ANOVA, ANCOVA and correlations tests were run using SAS, version 9.3 (SAS Institute Inc., Cary, NY).
Responses to multiple choice questions concerning the likability of the assigned diet and perceived satiety were on a 5- or 4-point ordinal scale that ranged from less (1) to more (4 or 5) positive. Numeric values for these questions were averaged to obtain a mean positivity response to the set. For the negative behavior checklist, the occurrence of behaviors was summed to obtain a total count on the number of negative behaviors for each animal in each week.
Because the actual range of responses rarely included D or E and almost always included either A or B, the original values of the multiple choice questions were collapsed to A (most positive coded 1) and not A (less positive coded 0) for use in binary logistic regression. A backward selection method based on the Wald statistic was used to evaluate predictive models for these questions. The probability for removal from the model was 0.05. Predictors in all logistic regression models were sex, age, weight, amount fed, caloric intake and diet.
Pearson correlation was used to determine the relationship between the mean positivity score and the total number of negative behaviors with age, weight, BCS, total percent weight lost per week, amount fed and calorie intake. The p value for statistical significance was set at 0.05 for all correlations. The effect of sex on the mean positivity score and total number of negative behaviors was compared using an independent samples, equal variances t test. The effect of diet on the mean positivity score was also compared using an independent samples, equal variances t test. An ANOVA was used to evaluate the effect of diet on the number of negative behaviors observed by the owners during the study period. A univariate ANCOVA was used to test for mean differences in total percent weight lost per week by diet group with the number of weeks completed in the study used as a covariate. The normality assumption for ANOVA was tested using the Shapiro-Wilk test. The equality of variance assumption was tested with the Levene’s test. Due to the total number of means tests performed, the Bonferroni corrected alpha was 0.003.
3. RESULTS
3.1. Study Animals
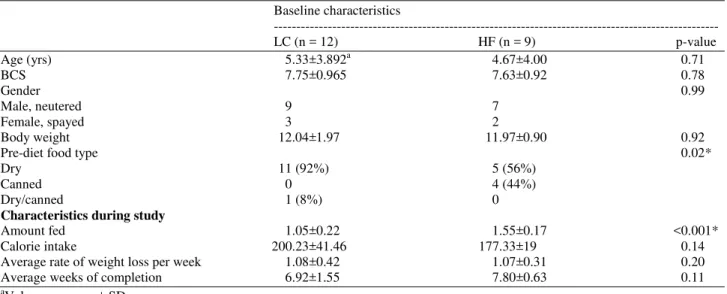
Table 2. Population characteristics baseline and during study (* denotes significance p<0.05) Baseline characteristics
---
LC (n = 12) HF (n = 9) p-value
Age (yrs) 5.33±3.892a 4.67±4.00 0.71
BCS 7.75±0.965 7.63±0.92 0.78
Gender 0.99
Male, neutered 9 7
Female, spayed 3 2
Body weight 12.04±1.97 11.97±0.90 0.92
Pre-diet food type 0.02*
Dry 11 (92%) 5 (56%)
Canned 0 4 (44%)
Dry/canned 1 (8%) 0
Characteristics during study
Amount fed 1.05±0.22 1.55±0.17 <0.001*
Calorie intake 200.23±41.46 177.33±19 0.14
Average rate of weight loss per week 1.08±0.42 1.07±0.31 0.20
Average weeks of completion 6.92±1.55 7.80±0.63 0.11
a
Values are mean ± SD
Table 3. Mean positivity scores to multiple choice questions 1-5 by diet group by week
Week Diet type Mean (SD) p value
2 LC 3.82 (0.80) 0.37
HF 4.09 (0.41)
4 LC 4.07 (0.33) 0.08
HF 4.31 (0.23)
6 LC 4.10 (0.24) 0.43
HF 4.20 (0.30)
8 LC 4.17 (0.18) 0.59
HF 4.22 (0.19)
The LC and HF groups did not differ significantly by age, gender, BCS, or body weight (Table 2). The calorie intake, average rate of weight loss per week and number of weeks completed also did not differ between groups (Table 2). The groups did differ significantly (p = 0.021) by their diet type prior to enrollment in the study and the amount of amount of food fed before and during the study (p<0.001) (Table 2).
3.2. Logistic Regression
No significant predictors were found for responses to questions 1 and 3-6. Calorie intake was a significant predictor of the response to question 2: How enthusiastic is your cat when eating the investigational food? (p = 0.03). For each one unit decrease in calorie intake, the likelihood of the response to question 2 being “extremely enthusiastic” increased approximately 4% (odds ratio, 0.96; regression coefficient, -0.04). There was no relationship between calorie intake, the response to question 2 and diet (p = 0.99). Neither were there significant predictors for the negative behaviors on the checklist.
3.3. Mean Positivity Scores
The mean positivity scores (average response to individual questions) for question 1-5 did not differ between the LC and HF diets at any time point (Table 3). Sex, weight, BCS, total percent weight lost per week, amount fed and calorie intake did not significantly correlate with the mean positivity scores at any time point. However, age correlated positively with the mean positivity at week 6 (r = 0.71, p = 0.03) and week 8 (r = 0.57, p = 0.02).
The mean for question 6 (owner satisfaction with the weight loss plan) did not differ between the LC and HF diets at any time point (week 2, p = 0.63; week 4, p = 0.51; week 6, p = 0.82, week 8, p = 0.04). Age was negatively correlated with question 6 at weeks 2 (r = -0.59, p = 0.005) and 4 (r = -0.64, p = 0.003). Age at weeks 6 and 8, weight, BCS, total percent weight lost per week, amount fed, or calorie intake are not linearly correlated with question 6.
3.4. Negative Behavior Checklist Scores
Table 4. Mean score values of negative behavioral checklist by diet group by week
Week Diet type Mean (SD) p value
2 LC 5.25 (3.19) 0.36
HF 4.11 (2.03)
4 LC 5.27 (3.16) 0.90
HF 5.11 (2.21)
6 LC 5.80 (3.71) 0.72
HF 5.22 (3.19)
8 LC 6.00 (3.79) 0.95
HF 6.11 (2.85)
This trend appears to be linear in week 8, however the correlation is not significant (p = 0.09). The mean number of total negative behaviors did not differ by sex at any time point (week 2, p = 0.97; week 4, p = 0.71; week 6, p = 0.49; week 8, p = 0.51).
The total percent weight loss per week was negatively correlated with weeks completed in the study (r = -0.65, p = 0.001). The total percent weight loss per week was not correlated with age or BCS. The total percent weight loss per week by diet groups was adjusted for the number of weeks completed in the study. The number of weeks completed in the study was a significant covariate for the total percent weight loss per week (p<0.001). The mean total percent weight lost per week did not differ by diet groups (p = 0.195). A significant correlation existed between the number of weeks completed and the mean total percent weight lost per week in the LC group (r = -0.81, p = 0.001) but not the HF group (r = -0.25, p = 0.49).
4. DISCUSSION
Feline obesity is common in veterinary practice. Weight loss requires increased energy expenditure coupled with energy restriction. Indoor cats often lead sedentary lifestyles and energy restriction is a mainstay of weight loss. However, owners are often frustrated with negative behaviors associated with hunger and therefore, compliance is difficult. Finding dietary strategies to promote satiety and minimize unwanted behaviors in cats should lead to more successful weight loss therapy. This study evaluated cat owners’ view of hunger behaviors in their cats that were fed either an LC or HF therapeutic weight loss diet.
The results of this study show that cat owners in both groups were overall pleased with their cats’ weight loss programs. At no time point did we find that the owners were more satisfied with the LC diet than the HF diet as indicated by question 6. Answers for cat
centric question 1-5, did not differ by diet group. Both diets had similar acceptance rates and palatability-related question scores. Additional factors that could influence owner satisfaction include fecal volume or characteristics unrelated to diet composition, such as smell and texture. Although our study did not specifically address these factors, we could find no difference between the study groups.
Approximately 39% of the cats did not complete the full eight weeks of the study period (LC = 50% and HF = 29%). The largest reason for study removal (25%) included diet refusal (LC = 4, HF = 3). We attempted to screen owners prior to study enrollment for cats that would accept canned food. The majority of cat consumed dry food prior to enrollment and it is likely that palatability and changes in texture contributed to diet refusal. Although our study removal rates were different, the average number of weeks completed by each group was not statistically different. The second most common reason for study removal included lack of owner compliance, although the removal rate was only 11%.
Despite randomization, more cats in the LC group were fed dry diets prior to study enrollment than cats in the HF group. It has been reported that canned diets are more satiating than dry diets (Wei et al., 2001). Ideally, this would have been balanced between groups, but we did not feel this impacted the results of our study given the similar mean number of weeks completed in each study group and the similar removal rate for diet refusal.
There was no difference in owner-reported behaviors associated with satiety in the two diet groups. The rate of weight loss increased as the number of weeks completed decreased in the LC group. This suggests that cats not completing the full 8-week weight loss period had a higher rate of weight loss in the LC group. Although the two diet groups had similar mean completion rates and overall rates of weight loss, the higher rate of weight loss in cats not completing the full 8 week study period was likely due to more cats in the LC group dropping out between the 4-6-week periods (LC = 5, HF = 1) than cats in the HF group because more cats from the HF group were excluded during the 0-2-week period (LC = 2, HF = 3). The majority of cats dropped out due to refusal to consume the food, which likely also contributed to their increased rate of weight loss.
less calorically dense than the LC diet. Cats were fed, on average, 1.5 cans per day of the HF diet compared to 1 can per day of the LC diet. Therefore, we were surprised to discover that cats had similar behavior patterns on both diets. However, the LC diet is higher in fat, which is reported to increase the release of gastrointestinal satiety hormones and delay gastric emptying (Little and Feinle-Bisset, 2011).
Since no difference was detected between the diets in regards to satiety-related behaviors and owners were generally satisfied with the weight loss plan, the high levels of protein in both diets probably improved satiety. It would have been interesting to include a negative control group with a diet lower in protein. Ideally, when comparing two diets, it is desirable to have the diets vary by only the nutrients of interest, in this case the carbohydrate (fiber) content. However, one of the main goals of the study was to provide veterinarians with a clinically relevant comparison of commercially available diets.
5. CONCLUSION
In this study, we chose to assess satiety using a questionnaire of the owner’s perception of their cat’s behaviors. Other studies in veterinary medicine have measured satiety using voluntary food intake as an indirect measure. Although this method is more accurate in determining if the animal is actually satiated, our objective was to assess cat owner’s opinions and observations in real work circumstances so we may explore ways to improve owner compliance during weight loss. In conclusion, owners of cats in both the LC and HF groups felt their cats were equally satiated. Both groups were pleased with their cat’s weight loss plan. Both the LC and HF diets are effective in achieving owner satisfaction during weight loss in cats.
6. ACKNOWLEDGEMENT
The researchers thank Ann Reed for statistical analysis. The authors would also like to thank the Companion Animal Fund at The University of Tennessee College of Veterinary Medicine for funding this study.
7. REFERENCES
Bosch, G., A. Verbrugghe, M. Hesta, J.J. Holst and A.F.V.D. Poel et al., 2009. The effects of dietary fibre type on satiety-related hormones and voluntary food intake in dogs. Br. J. Nutr., 102: 318-325. DOI: 10.1017/S0007114508149194
Butterwick, R.F. and P.J. Markwell, 1997. Effect of amount and type of dietary fiber on food intake in energy-restricted dogs. Am. J. Vet. Res., 58: 272-276. PMID: 9055973
Cave, N.J., F.J. Allan, S.L. Schokkenbroek, C.A.M. Metekohy and D.U. Pfeiffer, 2012. A cross-sectional study to compare changes in the prevalence and risk factors for feline obesity between 1993 and 2007 in New Zealand. Preventive Vet. Med., 107: 121-133. DOI: 10.1016/j.prevetmed.2012.05.006
Gerstein, D.E., G. Woodward-Lopez, A.E. Evans, K. Kelsey and A. Drewnowski, 2004. Clarifying concepts about macronutrients’ effects on satiation and satiety. J. Am. Dietetic Assoc., 104: 1151-1153. PMID: 15215775
Howarth, N.C., E. Saltzman and S.B. Roberts, 2001. Dietary fiber and weight regulation. Nutr. Rev., 59: 129-139. PMID: 11396693
Jackson, J.R., D.P. Laflamme and S.F. Owens, 1997. Effects of dietary fiber content on satiety in dogs. Vet. Clin. Nutr., 4: 130-134.
Jewell, D.E. and P.W. Toll, 1996. Effects of fiber on food intake in dogs. Vet. Clin. Nutr., 3: 115-118. Laflamme, D., 1997. Development and validation of a
body condition score system for cats: A clinical tool. Feline Practice, 25: 13-18.
Little, T.J. and C. Feinle-Bisset, 2011. Effects of dietary fat on appetite and energy intake in health and obesity-oral and gastrointestinal sensory contributions. Physiol. Behav., 104: 613-620. DOI: 10.1016/j.physbeh.2011.04.038
Lund, E.M., P.J. Armstrong, C.A. Kirk and J.S. Klausner, 2005. Prevalence and risk factors for obesity in adult cats from private US veterinary practices. Int. J. Applied Res. Vet. Med., 3: 88-96. Michel, K.E., A. Bader, F.S. Shofer, C. Barbera and
D.A. Oakley et al., 2005. Impact of time-limited feeding and dietary carbohydrate content on weight loss in group-housed cats. J. Feline Med. Surgery, 7: 349-355. DOI: 10.1016/j.jfms.2005.05.003
NRC, 2006. Nutrient Requirements of Dogs and Cats. 1st Edn., National Academies Press, Washington, DC., ISBN-10: 0309086280, pp: 5.
Wei, A., A.J. Fascetti, C. Villaverde, R.K. Wong and J.J. Ramsey, 2001. Effect of water content in a canned food on voluntary food intake and body weight in cats. Am. J. Vet. Res., 72: 918-923. DOI: 10.2460/ajvr.72.7.918