Phytohormone Involvement in the
Ustilago
maydis
–
Zea mays
Pathosystem:
Relationships between Abscisic Acid and
Cytokinin Levels and Strain Virulence in
Infected Cob Tissue
Erin N. Morrison1*, R. J. Neil Emery2, Barry J. Saville3
1Environmental and Life Sciences Graduate Program, Trent University, Peterborough, Ontario, Canada,
2Biology Department, Trent University, Peterborough, Ontario, Canada,3Forensic Science Program, Trent University, Peterborough, Ontario, Canada
Abstract
Ustilago maydisis the causative agent of common smut of corn. Early studies noted its abil-ity to synthesize phytohormones and, more recently these growth promoting substances were confirmed as cytokinins (CKs). Cytokinins comprise a group of phytohormones com-monly associated with actively dividing tissues. Lab analyses identified variation in viru-lence betweenU.maydisdikaryon and solopathogen infections of corn cob tissue. Samples from infected cob tissue were taken at sequential time points post infection and biochemical profiling was performed using high performance liquid chromatography-electrospray ioniza-tion tandem mass spectrometry (HPLC-ESI MS/MS). This hormone profiling revealed that there were altered levels of ABA and major CKs, with a marked reduction in CK glucosides, increases in methylthiol CKs and a particularly dramatic increase incisZ CK forms, inU.
maydisinfected tissue. These changes were more pronounced in the more virulent dikaryon relative to the solopathogenic strain suggesting a role for cytokinins in moderating virulence during biotrophic infection. These findings highlight the fact thatU.maydisdoes not simply mimic a fertilized seed but instead reprograms the host tissue. Results underscore the suit-ability of theUstilago maydis–Zea maysmodel as a basis for investigating the control of phytohormone dynamics during biotrophic infection of plants.
Introduction
A key strategy for successful pathogen establishment often involves hijacking an already exist-ing plant network. Manipulation of host metabolism through the production of phytohor-mones by plant pathogens, or the activation of host phytohormone biosynthesis, is often used as a component of establishing pathogen growth within the host [1,2].
OPEN ACCESS
Citation:Morrison EN, Emery RJN, Saville BJ (2015) Phytohormone Involvement in theUstilago maydis– Zea maysPathosystem: Relationships between Abscisic Acid and Cytokinin Levels and Strain Virulence in Infected Cob Tissue. PLoS ONE 10(6): e0130945. doi:10.1371/journal.pone.0130945
Editor:Wei Wang, Henan Agricultural Univerisity, CHINA
Received:March 20, 2015
Accepted:May 27, 2015
Published:June 24, 2015
Copyright:© 2015 Morrison et al. This is an open access article distributed under the terms of the Creative Commons Attribution License, which permits unrestricted use, distribution, and reproduction in any medium, provided the original author and source are credited.
Data Availability Statement:All relevant data are within the paper and its Supporting Information files.
Phytohormone manipulation has often been associated with the infection strategy of bio-trophic fungi through; nutrient diversion, suppression of plant defense responses, and increased host susceptibility, all of which have been mimicked through the exogenous applica-tion of the phytohormones cytokinins (CK) or abscisic acid (ABA) [3–5].
The phytohormone group cytokinins are N6substituted adenine derivatives which are important in a number of developmental processes within the plant including cell division and differentiation [6]; abscisic acid, is often referred to as the plant stress hormone, and is involved in plant development as well as adaptation to various environmental biotic and abiotic stress-ors [5,7,8].
While phytohormone production is often associated with biotrophic fungi, the key ques-tions remain as to why non-plant associated microbes produce phytohormones? And, what is the mechanism by which microbial phytohormone production provides a pathogenic advan-tage in a host-pathogen interaction? [4](reviewed in [9], [10], reviewed in [11], [12–14]). Here we examine the latter of the two questions.
Studies examining the infection process of the basidiomycete corn smut fungusUstilago maydishave suggested that phytohormone manipulation, by this fungus, may play a role in host infection [15,16]. Infection of corn by theU.maydispathogenic dikaryon stimulates unco-ordinated cellular division, resulting in tumour formation on aerial portions of the plant including the cob [17,18]. Within these tumours black, diploid teliospores are produced which act as the dispersal agent for the fungus [18,19].U.maydisinfection ofZea maysresults in reduced photosynthetic rate, maintenance of nutrient sinks [20], elevated levels of total soluble sugars, and increased nitrogen accumulation in infected tumours [21]. These features are com-mon acom-mong biotrophic fungal infections and have been mimicked through the application of exogenous CKs [1]. However, the link to CKs during theU.maydis-Zea maysinteraction has not been thoroughly examined, although previous studies have shown that culturedU.maydis
(sporidia and dikaryon) were capable of producing CKs and ABA, and that specific CK forms varied during infection of maize seedlings [22,23], none have examined the hallmark of this disease, cob tumour formation.
Information forU.maydisphytohormone manipulation and pathogenesis has mostly been done in corn seedlings however, seedling infections elicit symptoms that are distinctly different from those seen in cob tissue and, therefore, likely result in different CK profiles.U.maydis
pathogenesis assays are often carried out using theU.maydisdikaryon, which results from the fusion of two compatible haploid sporidia, or using a genetically engineered haploid solopatho-gen [18,19]. In lab observations it was noted that infection of corn seedlings and cob tissue by these two strains resulted in different rates of disease development and severity of disease symptoms, with the dikaryon being more virulent (S1 Fig). With this in mind we sought to examine the changes in ABA and CK profiles between mock-infected andU.maydisinfected cob tissue at specific time points post infection, and determine ifU.maydisstrains (dikaryon vs. solopathogen) with contrasting virulence will result in different ABA and CK profiles dur-ing infection. Samples, from infected cob tissue, were taken at various time points post infec-tion and biochemical profiling conducted using high performance liquid chromatography-electrospray ionization tandem mass spectrometry (HPLC-ESI MS/MS). The use of HPLC-ESI MS/MS in this study permits the detection and separation of ABA and CK analytes from the same tissue sample [14]. In this study, it was observed that ABA levels were elevated in infected tissue. CK levels specific to the free base, riboside, nucleotide (FBRNT) group of CKs increased dramatically inU.maydisinfected tissue relative to the mock-infected control, and further dif-ferences were found when comparing the dikaryon and solopathogen infections. This compari-son of ABA and CK profiles between differentU.maydisstrain infections will provide new insight into virulence factors experienced during infection.
Materials and Methods
Ustilago maydis
strains and growth conditions
Ustilago maydisstrains used in the experiments include: FB1 (a1b1) and FB2 (a2b2), provided by Flora Banuett [19], and the solopathogenic haploid strain SG200 (a1 mfa2 bE1bW2); a FB1 derived strain engineered to grow filamentously and cause disease without a mating partner, obtained from Jörg Kämper (Karlsruhe Institute of Technology, Karlsruhe, Germany; [18,24]). Budding cultures were grown on solid YEPS medium (1% w/v yeast extract, 2% w/v peptone, 2% w/v sucrose) containing agar for 3–4 days at 28 C; for SG200, solid medium was supple-mented with 20μg mL-1phleomycin (InvivoGen). Single colonies were inoculated into liquid
YEPS medium and grown overnight (28 C, 250 rpm). Two hundredμL of overnight culture
was inoculated into 200 mL of liquid YEPS medium and grown overnight (28 C, 250 rpm). Cultures were diluted to a final OD600of 1 using sterile dH2O. For compatible haploids (FB1 x
FB2) equal volumes of diluted culture were combined. For solopathogenic (SG200) injections, cultures were diluted to a final OD600of 1.
Plant growth conditions, tissue injection and sampling
Zea maysL.‘Golden Bantam’(Ontario Seed Company, Canada) seeds were planted (16 per 38 cm pot, reduced to 8 plants per pot) in Sunshine Professional Growing Mix (Mix#1, Sungro Horticulture Canada). Two pots with a total of 10 cobs were used for the mock-infected treat-ment, three pots with a total of 14 cobs were used for the dikaryon (FB1 x FB2) treatment and four pots with a total of 13 cobs were used for the solopathogen (SG200) treatment. Germina-tion and growth occurred under 16 h light, 60–80% RH, 24–27 C, 8 h dark, 60–80% RH, at 19– 22 C (Aurora Greenhouse, Conviron, Canada). Corn plants were detasseled to prevent pollina-tion of ovules and increase the likelihood of cob infecpollina-tion [25,26]. Cobs were injected, as described in Morrison et al. [27]. Briefly,U.maydisinjection of cobs was carried out using 6 mL of culture (FB1 x FB2 or SG200), which was diluted to an OD600of 1 and injected down the
silk shaft of cobs using a 10 mL syringe and 18 gauge needle. If strong back pressure occurred (suggesting insertion into the cob) the needle was drawn back or reinserted through the husk at a different location. Mock-infections (controls) were injected in the same manner using diluted YEPS (50%v/v sdH2O).
Time course tissue sampling
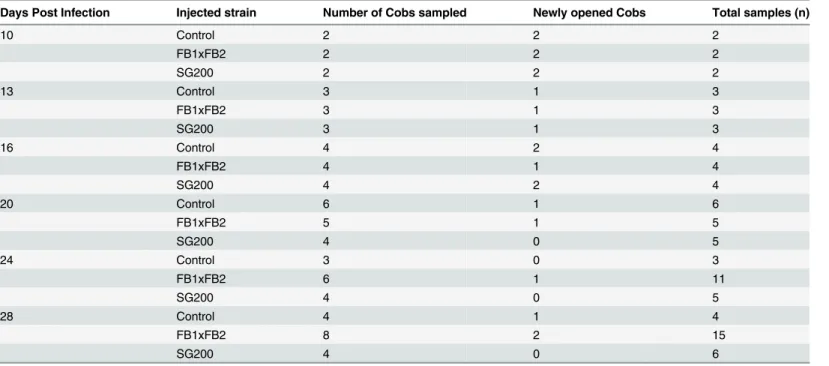
tumours to reach the tissue mass required for hormone extraction. Later time points, with larger tumours, allowed single tumours to represent a single sample. Each tumour in later time points was considered an individual sample even if it was taken from the same cob.Table 1 presents a summary of the number of cobs sampled and the total number of samples collected at each time point. Unfertilized ovules from mock-infected controls were often pooled to repre-sent one sample. For each time point, an attempt was made to examine a previously unopened cob, when available.
CK and ABA extraction and purification
Hormone extraction and purification were carried out as described in Ross et al. [29] for ABA and in Dobrev and Kaminek [30], as modified in Morrison et al. [14] for CKs. Briefly, frozen tissue was reweighed and internal standards added during the first extraction step to enable endogenous hormone quantification through the isotope dilution technique [31]. Internal standards included 146.9 ng of labeled ABA (2H4ABA) (PBI, Saskatoon), and 10 ng of the
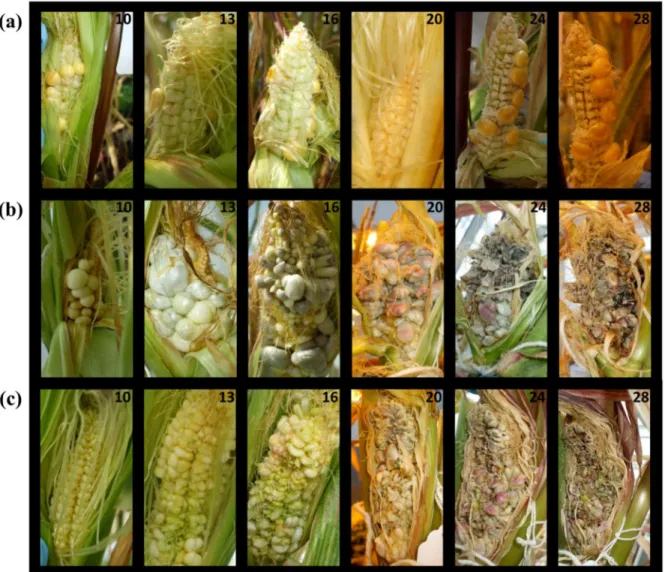
Fig 1. Representative time course of disease progression forZea mays- U.maydiscob assay.(a) Mock-infected controls (b) Dikaryon (FB1 x FB2) infected (c) Solopathogen (SG200) infected. Days post infection (dpi) appear in the top right-hand corners of individual photographs.
following CK’s:2H7BA,2H7BAR,2H5ZOG,2H7DHZOG,2H5ZROG,2H7DHZROG,2H6iP7G, 2H
5Z9G,2H5MeSZ,2H6MeSiP,2H5MeZR,2H6MeSiPR,2H6iPR,2H3DHZR,2H6iP,2H3DHZ, 2H
6iPRMP, and2H6DHZRMP (OlchemIm Ltd., Olomouc, CZ). Similarity in retention time
allowed the use of labeled2H3DHZR,2H3DHZ, and2H6DHZRMP for the quantification of
transZ,transZR,transZRP, andcisZ isomers. Since deuterated standards were not commer-cially available forcis-CKs, levels of these compounds were quantified using the recovery of the corresponding DHZ-CK deuterated standard. Frozen tissue was homogenized in pre-cooled (-20 C) modified Bieleski #2 extraction buffer (Methanol: Water: Formic Acid; CH3OH:H2O:
HCO2H (15:4:1, v/v/v)) using a ball mill grinder and zirconium oxide grinding beads (Comeau
Technique Ltd., Vaudreuil-Dorion, Canada; 25 mZ, 5 minutes, 4 C) for tissue ~0.25 g or less. Stainless steel grinding cylinders were used for tissue greater than ~0.25 g (25 mZ, 30 seconds, 4 C, Retsch MM300). Following tissue homogenization samples were sonicated, vortexed and allowed to extract passively overnight at -20 C for approximately 12 hrs. Following overnight extraction, samples were centrifuged at 8400 xgfor 10 minutes (Sorvall ST 16 Centrifuge or Fisher Scientific Centrifuge at maximum speed) and the supernatant collected. Pellets were re-extracted and allowed to extract passively in modified Bieleski #2 extraction buffer for 30 min-utes at -20 C. Samples were centrifuged as above and pooled supernatants were dried in a speed vacuum concentrator at ambient temperature (Savant SPD111V, UVS400, Thermo Fisher Scientific, Waltham, MA). Dried samples were stored at -20 C until use. Dried superna-tant residues were reconstituted in 1 mL of 1M HCO2H, to allow for complete protonation of
CKs, and subjected to solid phase extraction (SPE) on a mixed mode, reverse-phase/ cation-exchange cartridge (Oasis MCX 6 cc; Waters, Mississauga, Canada). Cartridges were activated with 5 mL CH3OH and equilibrated with 5 mL 1M HCO2H. Following equilibration the
sam-ple was loaded and washed with 5 mL 1M HCO2H. ABA was eluted first using 5 mL CH3OH.
CKs were eluted based on their chemical properties, with CK nucleotide forms eluted second, using 5 mL 0.35 M ammonium hydroxide (NH4OH) followed by riboside, free base,
Table 1. Tissue sampling for phytohormone analysis.
Days Post Infection Injected strain Number of Cobs sampled Newly opened Cobs Total samples (n)
10 Control 2 2 2
FB1xFB2 2 2 2
SG200 2 2 2
13 Control 3 1 3
FB1xFB2 3 1 3
SG200 3 1 3
16 Control 4 2 4
FB1xFB2 4 1 4
SG200 4 2 4
20 Control 6 1 6
FB1xFB2 5 1 5
SG200 4 0 5
24 Control 3 0 3
FB1xFB2 6 1 11
SG200 4 0 5
28 Control 4 1 4
FB1xFB2 8 2 15
SG200 4 0 6
methylthiol, and glucoside CK forms eluted using 5 mL 0.35 M NH4OH in 60% CH3OH.
Col-lected fractions were evaporated to dryness and stored at -20 C.
CK nucleotides were reconstituted in 1 mL 0.1 M ethanolamine-HCl (pH 10.4) and dephos-phorylated to form ribosides using 3.4 units of bacterial alkaline phosphatase (Sigma, Oakville, Canada) for 12 hours at 37 C. Resulting CK ribosides were evaporated to dryness in a speed vacuum concentrator at ambient temperature. Due to the need for nucleotide to riboside con-version for detection purposes, resultant nucleotide data potentially reflects pooled contribu-tion of mono, di- or tri- phosphates as the isopentenyl or hydroxylated moiety can be transferred to an AMP, ADP or ATP [32] this is represented in the current study by using iPRP, DHZRP,transZRP andcisZRP to represent the respective pooled nucleotide data for that particular analyte. Dephosphorylated nucleotides were reconstituted in 1.5 mL Milli-Q H2O and further purified using a reversed-phase C18SPE column (Oasis C183 cc; Waters,
Mis-sissauga, Canada). Column activation and equilibration were carried out using 3 mL CH3OH
and 6 mL Milli-Q H2O, respectively. Samples were loaded and allowed to pass through the
col-umn under gravity. The sorbent bed was washed with 3 mL Milli-Q H2O and samples were
eluted using 1.5 mL CH3OH. Samples were dried in a speed vacuum concentrator and stored
at -20 C until analysis.
Purified fractions of ABA, CK nucleotides, CK ribosides/ free base/ methylthiol/ glucosides were reconstituted in 1.5 mL of initial HPLC mobile phase conditions (95:5 H2O: CH3OH with
0.08% acetic acid (CH3CO2H)) for ABA and (95:5 H2O: Acetonitrile (C2H3N) with 0.08%
CH3CO2H) for CKs. Samples were transferred to glass auto- sampler vials and stored at 4 C
until analysis.
HPLC-ESI MS/MS methods with multiple reaction monitoring (MRM) channels, specific for each analyte, were carried out as described in Ross et al. [29] and Farrow and Emery [33]. Detection limits were as listed in Farrow and Emery [33]. Samples were analyzed and quanti-fied by HPLC-ESI MS/MS (Agilent 1100 series HPLC connected to a Sciex Applied Biosystem 5500 API mass spectrometer) with a turbo V-spray ionization source. A 20μL sample was
injected onto a Luna C18reverse-phase HPLC column (3μm, 150 x 2.0 mm; Phenomenex,
Tor-rance, CA, U.S.A.); all ABA samples were analyzed in negative-ion (ESI-) mode and all CK samples were analyzed in positive-ion (ESI+) mode. ABA was eluted using component A: H2O
with 0.08% CH3CO2H and component B: CH3OH with 0.08% CH3CO2H, at a flow rate of 0.2
mL minute-1. CKs were eluted using component A: H2O with 0.08% CH3CO2H and
compo-nent B: C2H3N with 0.08% CH3CO2H, at a flow rate of 0.2 mL minute-1. Initial conditions for
the ABA fraction were 50% B changing on a linear gradient to 80% B over 8 minutes. This ratio was then held constant for 2 minutes before returning to starting conditions and equilibrating for 8 minutes. The CK fractions were eluted using a multistep gradient. Starting conditions were 5% B increasing linearly to 95% B over 17 minutes. 95% B was held constant for 5 minutes before returning to starting conditions for 18 minutes.
Data analysis
variance). In the case of ABA analysis, data points were subjected to the Grubb’s test for out-lier detection.
Results
Disease progression and tissue sampling
Disease symptoms were monitored and recorded over the course of 28 days. Multiple tissue samples were taken at each time point from the mock-infected (control), the dikaryon and the solopathogen injections. While effort was taken to prevent kernel pollination, in some cases cobs had a mix of fertilized and unfertilized kernels. Snetselaar et al. [25] noted that kernel pol-lination was not necessary forU.maydisinfection and may actually interfere with fungal devel-opment. An effort was made to collect only unfertilized tissue from control cobs, as this was thought to be more representative of the tissue that would be infected byU.maydis. During the early stages of disease, small, white, disorganized galls were visible (day 10) (Fig 1). Gall enlargement had begun by day 13 and in most cases by day 16 the tumours took on a grey appearance. In some cases, exposedU.maydistumours also became green or purple in appear-ance. By day 20, enlarged tumour tissue was darkened by the development/maturation of telio-spores within the tissue. By days 24–28 most tumour tissue had begun to dehydrate. All opened or harvestable cobs were tracked to evaluate the progression of disease. Samples selected for hormone analysis were those in which cob tissue developed disease symptoms. Because of the nature of the experiment, which included destructive and repeated sampling, any cob with secondary infection was discarded. Tissue sample numbers ranged from 2–15, and were determined by the day during which samples were taken, the treatment type and the presence of diseased tissue. During early time points, infection differences were qualitatively observed between the dikaryon and solopathogen strains. Dikaryon infected tissue resulted in tumours that were larger and more bulbous than those from the solopathogen treatment (Fig 1, day 10–16). Infection percentages were determined for the dikaryon and solopathogen treat-ments, and these were based on whether an individual cob contained tumours that could be harvested for hormone analysis. The dikaryon had 57% harvestable cobs whereas the solo-pathogen had 38%.
Abscisic acid
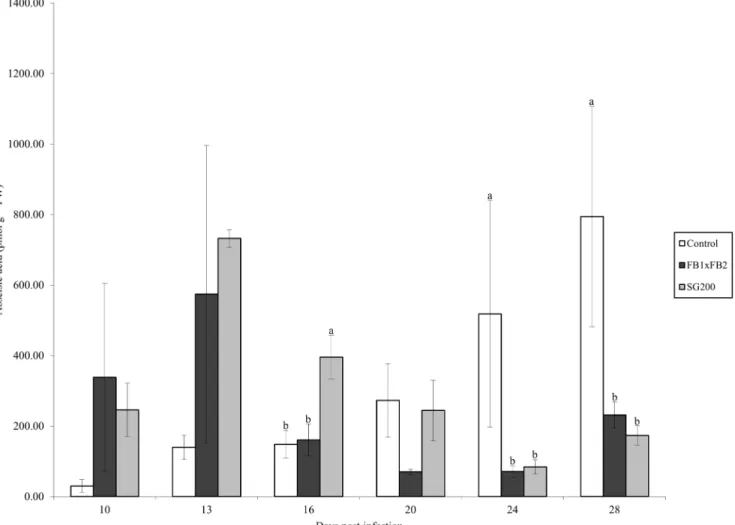
Tissue samples were extracted and analyzed for the presence of ABA by HPLC-ESI (-) MS/MS. ABA was present in all treatments at all time points. The control treatment ranged from 29.84 pmol g-1FW at day 10 to 794.62 pmol g-1FW at day 28 (Fig 2). The dikaryon treatment reached its highest level of ABA content at day 13 (574.23 pmol g-1FW), which was greatly reduced by day 16 with subsequent days ranging from 70.2 pmol g-1FW to 231.84 pmol g-1 FW (days 20 and 28 respectively). The solopathogenic treatment showed an increase in ABA levels at day 13 (732.13 pmol g-1FW), followed by a gradual decrease in total ABA (Fig 2). Sig-nificant differences were detected between the solopathogen and other treatments at day 16 (Tukey Kramerp<0.05) and between the control tissue and infected tissue at days 24 and 28 (Tukey Kramerp<0.05).
Cytokinins
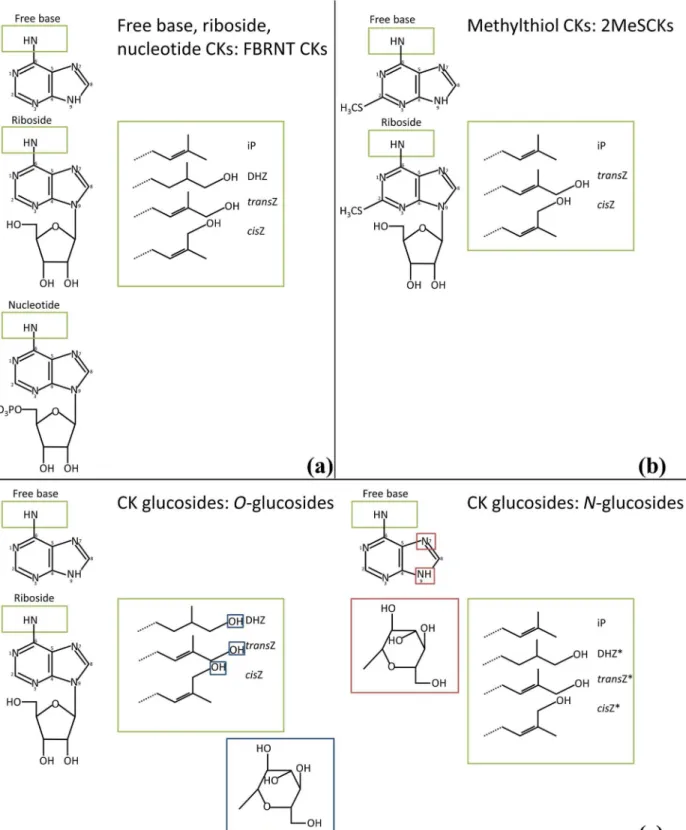
Fig 3represent all compounds scanned for on the HPLC-ESI MS/MS (excluding aromatic CKs) including those that were undetected. CK glucosides are considered inactive CK forms [34], and were grouped to include the following analytes: DHZOG, DHZROG, DHZ9G,
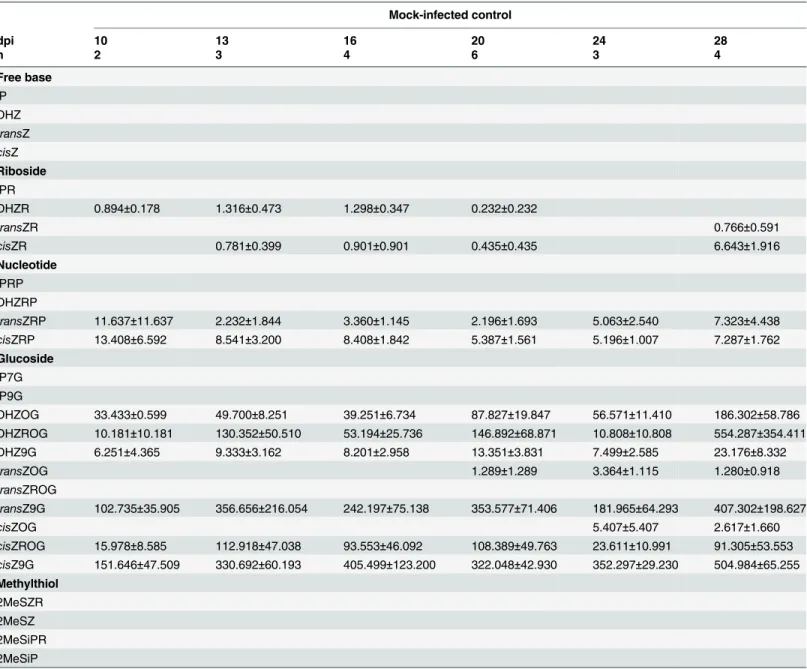
trans-ZOG,transZROG,transZ9G,cisZOG,cisZROG, andcisZ9G (iP9G and 7Gs were not detected in this study). Methylthiol CKs are modified at C2 with the addition of a methylthiol group [34] (Fig 3b) and, for this study 2MeSCKs included the following analytes: 2MeZR, 2MeSZ, 2MeSiPR, and 2MeSiP. FBRNT CKs represent the putatively active CK forms and their imme-diate precursors. In this study, the FBRNT CK grouping included the following analytes: iP, iPR, iPRP, DHZ, DHZR, DHZRP,transZ,transZR,transZRP,cisZ,cisZR, andcisZRP. Analyte concentrations are found in Tables2,3and4for the mock-infected control, dikaryon and solo-pathogen infected tissues. No aromatic CKs were detected in any tissue type and were therefore not listed in Tables2,3and4.
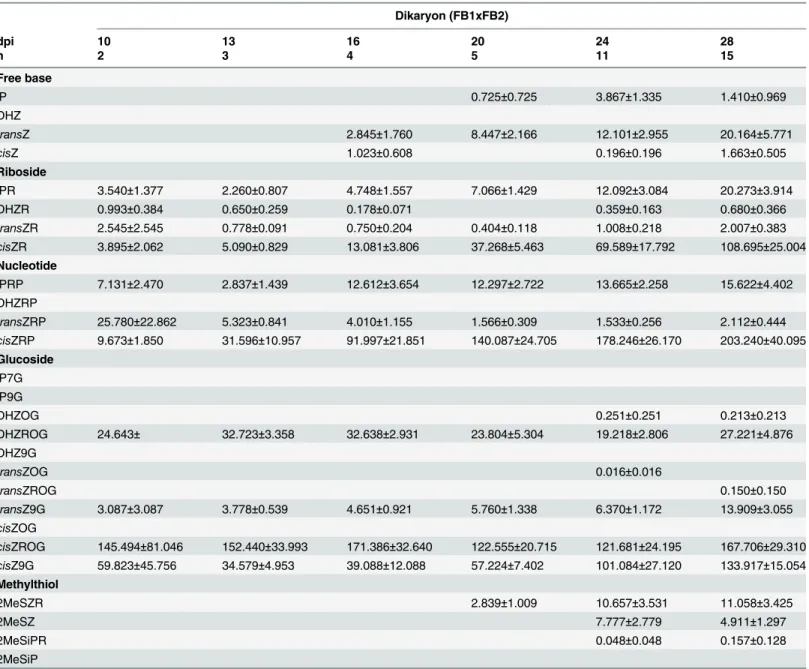
CK glucosides represented 93% (day 10) to 99% (days 13, 20 and 28) of the total CKs found in control tissue (Table 2). During dikaryon infection, glucosides represented the main CK type during early stages of infection at 81% and 82% at days 10 and 13. The relative amount of glucosides decreased at day 16 (65%) and was lowest at day 28 (47%) (Table 3). Methylthiol Fig 2. Abscisic acid concentration (pmol g-1FW) for control, dikaryon and solopathogen injected cob tissue at specific days post infection (dpi).
n = 2–15, error bars represent standard error (SE). Letters denote significant differences within time points (ANOVA and Tukey-Kramer post hoc analysis,
p<0.05).
Fig 3. Representative CK structures for analytes detected/scanned for, in theZea mays- U.maydiscob assay time course.(a) Free base, riboside, nucleotide CKs (b) Methylthiol CKs (c) CK glucosides includingO-glucosides (left) andN-glucosides (right). Green boxes indicate addition of side chains; large green boxes show the different side chains. Blue boxes indicate the structure of glucose and location of glucosylation forO-glucosides. Red boxes indicate the structure of glucose and location of glucosylation forN-glucosides. Adapted from: Esberg et al. [70], Sakakibara [34], Frébort et al. [12].*The 7G form of these analytes was not scanned for.
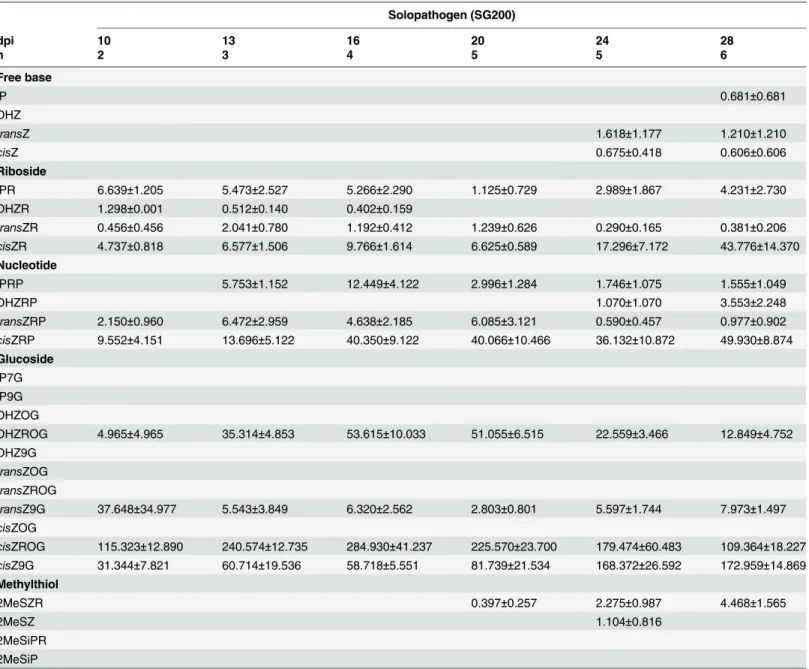
CKs (2MeSCKs) represented a small percentage of the total CK levels, and were present only in later stages of infected tissue, starting at day 20 (Tables3and4). FBRNT CKs increased during dikaryon infection, representing over 50% of all CKs during later stages of infection (days 24, 28). During solopathogenic infection glucosides represented 73%-89% of the total CK level, whereas FBRNT CKs represented less than 17% of the total CKs detected during the time course, differing from the increased representation of FBRNT CKs noted in the dikaryon infec-tion (days 10–24;Table 4). The following sections describe the dynamics of each CK grouping.
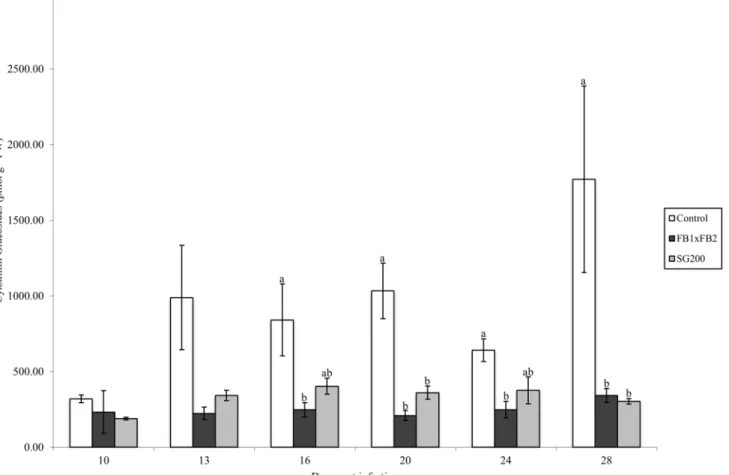
CK glucosides. Total glucosides were compared between all treatments at each time point (Fig 4), with the control tissue maintaining the highest level of total glucosides throughout the Table 2. Cytokinin concentrations (pmol g-1FW) in mock-infectedZ.mayscob tissue, during theU.maydis-Z.maysinfection time course.
Mock-infected control
dpi 10 13 16 20 24 28
n 2 3 4 6 3 4
Free base
iP DHZ
transZ
cisZ
Riboside
iPR
DHZR 0.894±0.178 1.316±0.473 1.298±0.347 0.232±0.232
transZR 0.766±0.591
cisZR 0.781±0.399 0.901±0.901 0.435±0.435 6.643±1.916
Nucleotide
iPRP DHZRP
transZRP 11.637±11.637 2.232±1.844 3.360±1.145 2.196±1.693 5.063±2.540 7.323±4.438
cisZRP 13.408±6.592 8.541±3.200 8.408±1.842 5.387±1.561 5.196±1.007 7.287±1.762
Glucoside
iP7G iP9G
DHZOG 33.433±0.599 49.700±8.251 39.251±6.734 87.827±19.847 56.571±11.410 186.302±58.786 DHZROG 10.181±10.181 130.352±50.510 53.194±25.736 146.892±68.871 10.808±10.808 554.287±354.411 DHZ9G 6.251±4.365 9.333±3.162 8.201±2.958 13.351±3.831 7.499±2.585 23.176±8.332
transZOG 1.289±1.289 3.364±1.115 1.280±0.918
transZROG
transZ9G 102.735±35.905 356.656±216.054 242.197±75.138 353.577±71.406 181.965±64.293 407.302±198.627
cisZOG 5.407±5.407 2.617±1.660
cisZROG 15.978±8.585 112.918±47.038 93.553±46.092 108.389±49.763 23.611±10.991 91.305±53.553
cisZ9G 151.646±47.509 330.692±60.193 405.499±123.200 322.048±42.930 352.297±29.230 504.984±65.255
Methylthiol
2MeSZR 2MeSZ 2MeSiPR 2MeSiP
Values are means±standard error (SE) (n = 2–15) at specific days post infection (dpi). Empty cells indicate values of zero for those analytes. In cases where an analyte was detected in only one sample the presented mean concentration is equivalent to the SE.
time course. Total glucoside levels were significantly different between the control tissue and dikaryon tissue on days 16, 20, 24 and 28 (Tukey-Kramerp<0.05), and differences between the control tissue and solopathogen tissue were also noted at days 20 and 28 (Tukey-Kramer
p<0.05).
Glucosides were further separated, based on the location of glucosylation, intoO-glucosides (DHZOG, DHZROG,transZOG,transZROG,cisZOG,cisZROG) andN-glucosides (DHZ9G,
transZ9G,cisZ9G;Fig 3c), which revealed distinct profile changes within the tissues examined.
O-glucosides can be readily cleaved byβ-glucosidase and act as stable storage forms of CKs, Table 3. Cytokinin concentrations (pmol g-1FW) inU.maydisdikaryon infectedZ.mayscob tissue, during theU.maydis-Z.maysinfection time
course.
Dikaryon (FB1xFB2)
dpi 10 13 16 20 24 28
n 2 3 4 5 11 15
Free base
iP 0.725±0.725 3.867±1.335 1.410±0.969
DHZ
transZ 2.845±1.760 8.447±2.166 12.101±2.955 20.164±5.771
cisZ 1.023±0.608 0.196±0.196 1.663±0.505
Riboside
iPR 3.540±1.377 2.260±0.807 4.748±1.557 7.066±1.429 12.092±3.084 20.273±3.914
DHZR 0.993±0.384 0.650±0.259 0.178±0.071 0.359±0.163 0.680±0.366
transZR 2.545±2.545 0.778±0.091 0.750±0.204 0.404±0.118 1.008±0.218 2.007±0.383
cisZR 3.895±2.062 5.090±0.829 13.081±3.806 37.268±5.463 69.589±17.792 108.695±25.004
Nucleotide
iPRP 7.131±2.470 2.837±1.439 12.612±3.654 12.297±2.722 13.665±2.258 15.622±4.402 DHZRP
transZRP 25.780±22.862 5.323±0.841 4.010±1.155 1.566±0.309 1.533±0.256 2.112±0.444
cisZRP 9.673±1.850 31.596±10.957 91.997±21.851 140.087±24.705 178.246±26.170 203.240±40.095
Glucoside
iP7G iP9G
DHZOG 0.251±0.251 0.213±0.213
DHZROG 24.643± 32.723±3.358 32.638±2.931 23.804±5.304 19.218±2.806 27.221±4.876 DHZ9G
transZOG 0.016±0.016
transZROG 0.150±0.150
transZ9G 3.087±3.087 3.778±0.539 4.651±0.921 5.760±1.338 6.370±1.172 13.909±3.055
cisZOG
cisZROG 145.494±81.046 152.440±33.993 171.386±32.640 122.555±20.715 121.681±24.195 167.706±29.310
cisZ9G 59.823±45.756 34.579±4.953 39.088±12.088 57.224±7.402 101.084±27.120 133.917±15.054
Methylthiol
2MeSZR 2.839±1.009 10.657±3.531 11.058±3.425
2MeSZ 7.777±2.779 4.911±1.297
2MeSiPR 0.048±0.048 0.157±0.128
2MeSiP
Values are means±standard error (SE) (n = 2–15) at specific days post infection (dpi). Empty cells indicate values of zero for those analytes. In cases
where an analyte was detected in only one sample the presented mean concentration is equivalent to the SE.
whereasN-glucosides are thought to be irreversibly modified or inactive, as they are not cleaved byβ-glucosidase [13,34]. Control tissue had higher levels ofN-glucosides (>65% of total gluco-sides), specificallytransZ9G andcisZ9G throughout most of the time course (Table 2).
Whereas infected tissue showed a reduction inN-glucoside forms, particularlytransZ9G and
cisZ9G, relative to the control tissue, while having a higher representation ofO-glucoside forms during days 10–20 (Tables2,3and4). Within infected tissuecisZ9G andcisZROG rep-resented the majority of detected glucosides (Tables3and4).
Table 4. Cytokinin concentrations (pmol g-1FW) inU.maydissolopathogen infectedZ.mayscob tissue, during theU.maydis-Z.maysinfection
time course.
Solopathogen (SG200)
dpi 10 13 16 20 24 28
n 2 3 4 5 5 6
Free base
iP 0.681±0.681
DHZ
transZ 1.618±1.177 1.210±1.210
cisZ 0.675±0.418 0.606±0.606
Riboside
iPR 6.639±1.205 5.473±2.527 5.266±2.290 1.125±0.729 2.989±1.867 4.231±2.730 DHZR 1.298±0.001 0.512±0.140 0.402±0.159
transZR 0.456±0.456 2.041±0.780 1.192±0.412 1.239±0.626 0.290±0.165 0.381±0.206
cisZR 4.737±0.818 6.577±1.506 9.766±1.614 6.625±0.589 17.296±7.172 43.776±14.370
Nucleotide
iPRP 5.753±1.152 12.449±4.122 2.996±1.284 1.746±1.075 1.555±1.049
DHZRP 1.070±1.070 3.553±2.248
transZRP 2.150±0.960 6.472±2.959 4.638±2.185 6.085±3.121 0.590±0.457 0.977±0.902
cisZRP 9.552±4.151 13.696±5.122 40.350±9.122 40.066±10.466 36.132±10.872 49.930±8.874
Glucoside
iP7G iP9G DHZOG
DHZROG 4.965±4.965 35.314±4.853 53.615±10.033 51.055±6.515 22.559±3.466 12.849±4.752 DHZ9G
transZOG
transZROG
transZ9G 37.648±34.977 5.543±3.849 6.320±2.562 2.803±0.801 5.597±1.744 7.973±1.497
cisZOG
cisZROG 115.323±12.890 240.574±12.735 284.930±41.237 225.570±23.700 179.474±60.483 109.364±18.227
cisZ9G 31.344±7.821 60.714±19.536 58.718±5.551 81.739±21.534 168.372±26.592 172.959±14.869
Methylthiol
2MeSZR 0.397±0.257 2.275±0.987 4.468±1.565
2MeSZ 1.104±0.816
2MeSiPR 2MeSiP
Values are means±standard error (SE) (n = 2–15) at specific days post infection (dpi). Empty cells indicate values of zero for those analytes. In cases
where an analyte was detected in only one sample the presented mean concentration is equivalent to the SE.
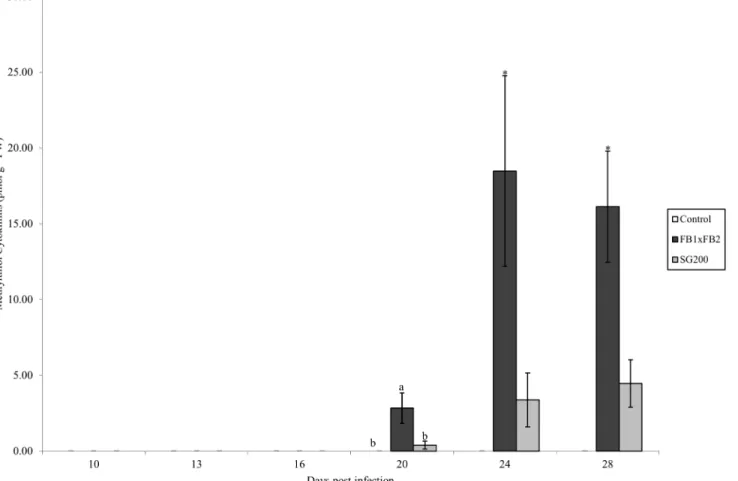
Methylthiol CKs. Methylthiol CKs (2MeSCKs) were analyzed in the control, dikaryon and solopathogenic tissue (Fig 5). 2MeSCKs were not detected in control tissue at any time point; however they were detected in infected dikaryon and solopathogenic tissue beginning at day 20 (Fig 5). Total 2MeSCK levels increased after their initial detection at day 20 in both dikaryon and solopathogenic tissue. Significant differences were detected between the dikaryon tissue, and other tissues at day 20 (Tukey-Kramerp<0.05). Differences between the dikaryon and solopathogen infections were detected at day 24 and 28 (two tailed Studentt-test assuming unequal variancep<0.05). Total 2MeSCKs in the dikaryon tissue ranged from 2.84 pmol g-1 FW at day 20 to>16 pmol g-1FW for days 24 and 28, whereas solopathogenic tissue main-tained low levels<4.5 pmol g-1FW throughout the time course. 2MeSZR was the abundant 2MeSCK present in the infected tissue (Tables3and4).
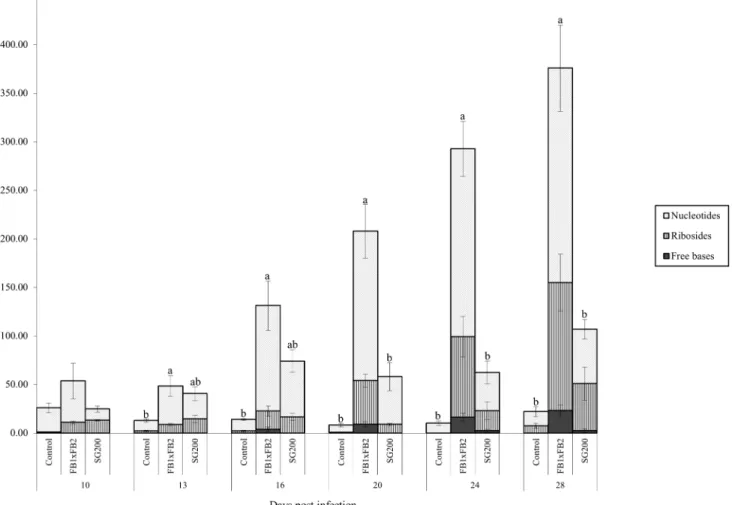
FBRNT CKs. Total free base, riboside and nucleotide (FBRNT) CKs varied among treat-ments throughout the time course. Specifically, in the control tissue, total FBRNT CKs main-tained a concentration between 8 pmol g-1FW and 26 pmol g-1FW (Fig 6). CK levels were elevated in infected tissue relative to the control as the infection time course progressed. Dikar-yon infected tissue had FBRNT levels significantly higher than control tissue at days 13–28 (Tukey-Kramerp<0.05), and significantly higher from solopathogen tissue at days 20–28 (Tukey-Kramerp<0.05) (Fig 6). The major FBRNT CKs found in the tissue samples were the Fig 4. Total CK glucoside concentration (pmol g-1FW) for control, dikaryon and solopathogen injected cob tissue at specific days post infection (dpi).n = 2–15, error bars represent standard error (SE). Letters denote significant differences within time points (ANOVA and Tukey-Kramer post hoc
analysis,p<0.05).
nucleotide forms, followed by the ribosides, with low representation of the free base form across all treatments and time points (Fig 6). Further dividing FBRNTs into FBR forms, signifi-cant differences were detected at day 10 and 16 between the control and infected tissues (Tukey-Kramerp<0.05). Differences were also detected at day 20 between the dikaryon and other tissues (Tukey-Kramerp<0.05). While relatively low in total CKs,cisZRP represented the major FBRNT CK in control tissue (>50%) for all time points with the exception of day 28 (Table 2). Infected tissue showed an accumulation ofcisZRP andcisZR during the course of infection, with a 27-fold increase incisZR levels in the dikaryon infection and a 9-fold increase incisZR levels for the solopathogenic infection between days 10 and 28 (Tables3and4).cis Z-isomer CK types constituted the majority of the total FBRNT CK pool in infected tissue as time progressed. iPCKs were found only in infected tissue starting at day 10 (Tables2,3and4) and increased in the dikaryon infection during the time course (Tables3and4).
Discussion
During host pathogen interactions CKs aid in the creation of nutrient sinks, as well as the for-mation of green islands or galls, whereas abscisic acid has been conflictingly implicated in increased host susceptibility as well as host resistance [4,5,35,36]. DuringU.maydisinfection Fig 5. Total methylthiol CK concentration (pmol g-1FW) for control, dikaryon and solopathogen injected cob tissue at specific days post infection
(dpi).n = 2–15, error bars represent standard error (SE). Letters denote significant differences within time points (ANOVA and Tukey-Kramer post hoc
analysis,p<0.05). Asterisks (*) denote significant differences between the dikaryon and solopathogen infection within time points (two tailed Studentt-test assuming unequal variancep<0.05).
the formation of characteristic tumours is thought to be initiated by the release of fungal effec-tors whereas tumour expansion is likely dependant on plant hormones [18,37]. The knowledge thatU.maydisproduces phytohormones and that it induces different host responses in differ-ent tissues suggested the need to examine CK and ABA levels in infected cobs [23,38,39]. Tumour tissue collected at specific time points during dikaryon and solopathogen infection revealed slightly elevated levels of ABA, reduced CK glucosides, presence of 2MeSCKs, and dramatic increases in specific FBRNT CKs. These distinct alterations in the phytohormone profile indicated thatU.maydisuses phytohormone manipulation as one of its approaches to modulate the plant host’s physiology.
U
.
maydis
cob infection leads to phenotypic differences between two
strains and among tissue collections
Dikaryon and solopathogen infections differed in pathogenic development and phytohormone levels. Tumour formation progressed similar to that outlined in Pataky and Snetselaar [28] with slightly reduced virulence, or less pronounced visual symptoms in the solopathogen infec-tions relative to the dikaryon infection at early time points (days 10–16).
Fig 6. Total FBRNT CK concentration (pmol g-1FW) for control, dikaryon and solopathogen injected cob tissue at specific days post infection
(dpi).Total FBRNT is subdivided into the Freebase, Riboside, and Nucleotide forms to show the representation of each form. n = 2–15, error bars represent
standard error (SE). Letters denote significant differences within time points (ANOVA and Tukey-Kramer post hoc analysis,p<0.05).
This variability in virulence between the dikaryon and otherU.maydisstrains is consistent with previous observations by Babu et al. [40] (dikaryon vs. diploid) and the Saville Lab (S1 Fig, dikaryon vs. solopathogen) in corn seedling infections. The differences in phytohormone levels noted in the current study provide a possible link between strain type and virulence level in theU.maydis-Z.maysinteraction.
Virulence differences have been noted between strains, yet the severity ofU.maydiscob tumour formation can also be influenced by the time of inoculation and pollination [26]. In order to control for pollination, corn was detasseled in the current study. Snetselaar et al. [25] noted that when cobs were shielded from pollen they were more susceptible toU.maydis infec-tion. Pollination may act to protect ovaries from infection due to the formation of an abscission zone at the base of the silk preventing multiple pollen tubes from reaching the ovary and inhibit-ingU.maydisentrance into the ovary [25]. Furthermore, fertilized seeds yield a very distinct CK profile from unfertilized ovules [41]. For these reasons careful visual inspection of the cob was done in order to exclude potentially fertilized seeds from the control analysis, as unfertilized tis-sue more accurately represented the tistis-sue that would be infected byU.maydis. Moreover, con-sistent sampling times-of-day were used to control for potential fluxes in CK diurnal levels [42].
Hormone profiling
ABA levels are elevated in infected tissue. ABA plays a key role in plant development including seed dormancy and response to abiotic and biotic stressors [5,7,8,43]. Increased lev-els of ABA have been associated with elevated susceptibility of plants to pathogen attack [5] (reviewed in [44]); however callose deposition stimulated by ABA can also provide a degree of resistance [7]. The role of ABA in host-pathogen relations is influenced by the infection strat-egy of the pathogen and the infection stage at which it is triggered [36]. Hence ABA’s role in pathogen infection is finely balanced. In the current study the increase in ABA at earlier time points (day 10,Fig 2) inU.maydisdisease development suggests a possible role for ABA in ini-tiating host susceptibility and tumour expansion. Increased ABA levels due to exogenous appli-cation or fungal production have resulted in increased susceptibility of the tomato plant to
Botrytis cinereainfection [5], and rice toMagnaporthe griseainfection [45].U.maydisis capa-ble of producing ABA, and ABA levels were elevated at 14 dpi during corn seedling infection [23]. This increased susceptibility associated with ABA may also be due to the complex interac-tion and cross-talk between many phytohormones [46]. Studies have detected an antagonistic interaction between ABA and salicylic acid (SA) which influences host susceptibility. SA pro-duction is an important defense response strategy for plants and is commonly associated with defense against biotrophic pathogens [46]. Pre-treatment of plants with ABA results in the sup-pression of the SA pathway. SA supsup-pression has been detected during the interaction between
Magnaporthe griseaand rice [45],Arabidopsis thalianaandPseudomonas syringaepv.tomato [47],Xanthomonas oryzaepv.oryzaeand rice [46] among others resulting in increased host susceptibility. Suppression of plant SA appears to play a minor role inU.maydisvirulence [48,49] and deletion of anU.maydisSA-degrading enzyme, salicylate hydroxylase, does not appear to impact virulence during corn seedling infection [50]. Many complex interactions occur between phytohormone systems; manipulation of these by the pathogen can greatly influence plant immunity [46]. The proposed initial suppression of host defenses through ele-vated ABA levels, as seen in the current study, is consistent with development within theU.
maydis–Zea mayspathosystem.
infection from days 13–20. The higher level of ABA in the solopathogen infection may play a role in the virulence reduction noted during the time course. Elevated levels of ABA are known to result in decreased cell division in normal maize seed development and can also trigger other plant hormone defense responses when produced later on in the infection process (prolif-eration stage) [36,51]. The mock-infected control follows a different pattern for ABA accumu-lation when compared to the infected tissue. In control tissue, ABA levels gradually increased. During normal seed development, increases in ABA facilitate the maintenance of seed dor-mancy [52] and two ABA peaks occur during early and late seed maturation stages [53], ABA levels are not typically measured in unfertilized ovules. In this study, the increased ABA level detected in unfertilized ovules was likely due to the natural dessication of the cob.
In the current system ABA may allow for increased susceptibility of the host toU.maydis
infection initially, but past a certain point inU.maydisdevelopment may actually result in decreased cell division and lower virulence.
CKs in tumour formation. During normal seed development cytokinins act to stimulate cell division and lead to increased organ size and enhanced sink strength (reviewed in [54]). However, during infection,U.maydisdoes not simply grow within the constraints set for a developing seed, but manipulates and reprograms the already existing sink tissue in order to complete its lifecycle.
In the current study total CKs decreased uponU.maydisinfection, due to an overall reduc-tion in CK glucosides (Tables2,3and4). A similar decrease in total CKs was also reported by Behr et al. [55] duringColletotrichum graminicolainfection of maize leaves, and was likely due to considerable decreases inO-glucosides. HoweverU.maydisinfection, while resulting in the decrease of CK glucosides, results in the accumulation of more active CK forms and their pre-cursors. By subdividing CKs into groups, as per the current study, changes in the precursor, active, storage and sometimes overlooked CKs (i.e. 2MeSCKs) can more clearly be seen. All of these CKs appear to play an important role in this pathosystem.
CK glucosides. CK glucoside levels decreased considerably during infection, particularly thetransZ and DHZ forms, which all but disappeared.cisZ glucoside forms remained relatively high in infected tissue, suggesting that glucosylation was limited tocis-isomers in infected tis-sue. Notably, the levels ofN-glucosides were reduced in infected tissue when compared to the mock-infected control. The reduced glucoside levels in infected tissue may be due to the fungus acting to inhibit the plant’s glucosylation activity by potentially targetingZea maysN9-glucosyl transferase (ZmCNGT), responsible forN-glucosylation of CKs, or other zeatin-O- glucosyl-transferase genes [56,57]. Changes in CK glucoside balance appear to be highly tissue and path-ogen specific.C.graminicolainfection of maize leaves results in significant decreases incisZOG following infection [55]; whereas in the current study theN-glucosides:transZ9G andcisZ9G were greatly reduced upon cob infection byU.maydis.
Another way in which glucoside balance can be altered is through the activation ofβ -gluco-sidases [58], which catalyze the deglycosylation ofO-glucosides [34].β-glucosidase activity has been detected in other fungi [3], andβ-glucosidase genes have been identified inU.maydis
2MeSCKs. The function of methylthiol CKs (2MeSCKs) is not well understood and very little is known regarding their importance in plant systems. Recent reports have detected 2MeSCKs in various basidiomycete forest fungi [14], and have also highlighted their potential importance in plant-insect-microbe interactions [59].U.maydisis not known to produce 2MeSCKs separate from the plant yet 2MeSCKs have been found as components of the tRNA of all organisms with the exception of Archaea [13,60,61]. In the current study, 2MeSZR and 2MeSZ accumulated inU.maydisinfected tissue during the later stages of infection but were not detected in the control tissue. Little is known about tRNA accumulation/degradation dur-ing end stageU.maydisinfection. The potential for tRNA accumulation off set by degradation may influence the level of 2MeSCKs detected during the current infection time course. 2MeSZ and 2MeSZR were the more predominant 2MeSCKs detected in the current study, this parallels the findings of Morrison et al. [14]. Furthermore, pathogenic strains ofRhodococcus fascians
contain the same spectrum of CKs as their nonpathogenic counterpart yet with higher levels of 2MeScisZ, iP andcisZ, of which 2MeScisZ andcisZ were found to accumulate in infected Arabi-dopsis thalianatissue [62]. Little is known about the bioactivity of 2MeSCKs, but the authors suggested that 2MeSZ may be less cytotoxic than other classic cytokinins and therefore this may account for its accumulation during infection [62]. The low but consistent presence of 2MeSCKs may be important in eliciting plant responses during disease development [59]. The similar accumulation of 2MeSCKs inU.maydisinfected tissue may be functionally based in the fact that they are less cytotoxic to the plant or they may also evade attempts by the host to balance CKs through the use of cytokinin oxidase.
Cytokinin oxidase acts to permanently degrade CKs; however, 2MeSZ andcisZ, were found to be poor substrates for 3 apoplastic cytokinin oxidases, permitting their accumulation in tis-sue [62]. Although fungi are capable of producing 2MeSCKs [14] it may be that host-stimu-lated or fungal-supplied 2MeSCKs, during infection, influence the host cells and permits the continued proliferation of tissue around the site of infection. In the current study the presence of 2MeSCKs in infected tissue may indicate a fungal stimulated origin for these CKs and their importance in promoting tissue proliferation.
FBRNTs. FBRNTs include free base, riboside and nucleotides which respectively represent the active, transport and precursor forms, of these CKs [34,55,63]. In this study they have been grouped together to reflect the importance of the NT-R-FB pathway in eliciting classic CK responses in plants. Fertilized seeds have a peak in CK levels 6 days after pollination, which is earlier than unfertilized ovules. Fertilized seeds also have CK levels 60 fold higher than unfertil-ized ovules [41,52].U.maydistissue does not mirror the early CK peak seen in fertilized seeds, suggesting that it does not simply mimic a fertilized seed, but instead reprograms the host tis-sue. FBRNTs, notablycisZRP andcisZR, increased dramatically in dikaryon and solopathogen infected cob tissue relative to the control starting at day 16 (Fig 6). This similarcisZCK accu-mulation has been detected during maize leaf infection byC.graminicola, corn seedling infec-tion byU.maydis, andArabidopsis thalianainfection by the bacteriumRhodococcus fascians
[23,55,62]. CK accumulation is likely dependent on host substrate specificities [62]. The abun-dance ofcisZ type CKs in maize [64], cytokinin receptors that are responsive tocisZ CKs [65], and zeatin-O-glucosyltransferase genes specific tocisZCKs [56,57], suggests that maize has the capacity to respond to the accumulation ofcisZCKs duringU.maydisinfection.
produce adenine and the corresponding aldehyde, thus removing any CK activity (reviewed in [66]). Brefort et al. [67] found that theZea mayscytokinin oxidase 3 gene is up-regulated follow-ing infection byU.maydisstrains in which an effector gene cluster has been deleted; suggesting that during normal infection these effectors act to suppress CK oxidase production. Microarray data fromU.maydisinfected corn seedlings [48] noted a>3 fold increase in theZea maysCK receptor: AHK4 histidine kinase receptor, starting at 4 dpi as well as a decrease in aZea mays
potential glycosyltransferase at 2 dpi followingU.maydisinfection of corn seedlings. These changes in host gene expression profiles suggest thatU.maydisis capable of manipulating the host’s CK signaling and storage pathways. Furthermore, during normalZ.maysdevelopment CKX levels are higher in the embryo, in order to prevent precocious germination [52].U.maydis
appears to take over the role of the embryo, resulting in the collapse of the ovule inside the ovary and a hollow appearance of tumours [25]. This targeted suppression would effectively hamper the plants ability to control CK balance within the seed, and lead to specific (cis-isomer) CK accu-mulation; this is supported by the current study’s phytohormone infection profiles.
Conclusions
This study found thatU.maydisinfection specifically alters the CK balance withinZea mays, with specific reduction of CK glucosides and increases tocisZCKs, iPCKs and 2MeSCKs. CK accumulation is more dramatic in the dikaryon infection and may account for the greater tumour manifestation seen during this infection. The increased CK levels may be working to promote sink development, distribution of nutrients and increased cell division, which may effectively reprogram the host tissue resulting in larger tumours. The changes in ABA were not as clear as has been seen previously inU.maydisinfected corn seedlings [23]. However, ABA accumulation and maintenance during early and later cob infection stages likely requires a deli-cate balance. Further study must be done in order to determine if the higher maintained levels of ABA starting at day 16 (in solopathogen infections) can result in heightened plant response and reduced virulence.
Supporting Information
S1 Fig. Pathogenesis assay forU.maydisinfected corn seedlings at 14 days post infection. The dikaryon (FB1x FB2) and solopathogen (SG200) strains ofU.maydiswere injected into seven day old corn seedlings and pathogenesis scored using the disease symptoms presented in the legend. The percentage of symptom formation is indicated for each treatment. A non-parametric Mann-WhitneyUtest was conducted to assess statistical significance (p<0.05). Sta-tistical significance is indicated by an asterisk (). n equals total sample size. Each disease symp-tom was assigned a numerical value; the average of this is represented by the value associated with the disease index (D.I.).
(TIF)
Acknowledgments
The authors declare that they have no conflict of interest. The authors acknowledge Amanda Charlesworth for data associated withS1 Fig.
Author Contributions
Conceived and designed the experiments: ENM RJNE BJS. Performed the experiments: ENM. Analyzed the data: ENM RJNE BJS. Contributed reagents/materials/analysis tools: RJNE BJS. Wrote the paper: ENM RJNE BJS.
References
1. Walters DR, McRoberts N. Plants and biotrophs: a pivotal role for cytokinins? Trends Plant Sci. 2006; 11: 1360–1385.
2. Choi J, Choi D, Lee S, Ryu C-M, Hwang I. Cytokinins and plant immunity: old foes or new friends? Trends Plant Sci. 2011; 16: 388–394. doi:10.1016/j.tplants.2011.03.003PMID:21470894
3. Cooper SJ, Ashby AM. Comparison of cytokinin and cytokinin-O-glucoside cleavingβ-glucosidase pro-ductionin vitrobyVenturia inaequalisand other phytopathogenic fungi with differing modes of nutrition
in planta. Physiol Mol Plant Pathol. 1998; 53: 61–72.
4. Ashby AM. Biotrophy and the cytokinin conundrum. Physiol Mol Plant Pathol. 2000; 57: 147–158. 5. Audenaert K, De Meyer GB, Hofte MM. Abscisic acid determines basal susceptibility of tomato to
Botry-tis cinereaand suppresses salicylic acid-dependent signaling mechanisms. Plant Physiol. 2002; 128: 491–501. PMID:11842153
6. Mok DWS, Mok MC. Cytokinin metabolism and action. Annu Rev Plant Physiol Plant Mol Biol. 2001; 52: 89–118. PMID:11337393
7. Mauch-Mani B, Mauch F. The role of abscisic acid in plant-pathogen interactions. Curr Opin Plant Biol. 2005; 8: 409–414. PMID:15939661
8. Schmidt K, Pflugmacher M, Klages S, Maser A, Mock A, Stahl DJ. Accumulation of the hormone abscisic acid (ABA) at the infection site of the fungusCercospora beticolasupports the role of ABA as a repressor of plant defence in sugar beet. Mol Plant Pathol. 2008; 9: 661–673. doi:
10.1111/j.1364-3703.2008.00491.xPMID:19018995
9. Tsavkelova EA, Klimova SY, Cherdyntseva TA, Netrusov AI. Microbial producers of plant growth stimu-lators and their practical use: a review. Appl Biochem Microbiol. 2006; 42: 133–143.
10. Hartung W. The evolution of abscisic acid (ABA) and ABA function in lower plants, fungi and lichen. Funct Plant Biol. 2010; 37: 806–812.
11. Stirk WA, van Staden J. Flow of cytokinins through the environment. Plant Growth Regul. 2010; 62: 101–116.
12. Frébort I, Kowalska M, Hluska T, Frébortová J, Galuszka P. Evolution of cytokinin biosynthesis and degradation. J Exp Bot. 2011; 62: 2431–2452. doi:10.1093/jxb/err004PMID:21321050
14. Morrison EN, Knowles S, Hayward A, Thorn RG, Saville BJ, Emery RJN. Detection of phytohormones in temperate forest fungi predicts consistent abscisic acid production and a common pathway for cytoki-nin biosynthesis. Mycologia. 2015; doi:10.3852/14-157
15. Doehlemann G, Wahl R, Vranes M, de Vries RP, Kämper J, Kahmann R. Establishment of compatibility in theUstilago maydis/maize pathosystem. J Plant Physiol. 2008; 165: 29–40. PMID:17905472 16. Bolker M, Basse CW, Schirawski J.Ustilago maydissecondary metabolism-From genomics to
bio-chemistry. Fungal Genet Biol. 2008; 45: S88–S93. doi:10.1016/j.fgb.2008.05.007PMID:18585066 17. Banuett F, Herskowitz I. Discrete developmental stages during teliospore formation in the corn smut
fungus,Ustilago maydis. Development. 1996; 122: 2965–2976. PMID:8898211
18. Kämper J, Kahmann R, Bolker M, Ma LF, Brefort T, Saville BJ, et al. Insights from the genome of the biotrophic fungal plant pathogenUstilago maydis. Nature. 2006; 444: 97–101. PMID:17080091 19. Banuett F, Herskowitz I. Different a alleles ofUstilago maydisare necessary for maintenance of
fila-mentous growth but not for meiosis. Proc Natl Acad Sci U S A. 1989; 86: 5878–5882. PMID:16594058 20. Horst RJ, Engelsdorf T, Sonnewald U, Voll LM. Infection of maize leaves withUstilago maydisprevents
establishment of C4 photosynthesis. J Plant Physiol. 2008; 165: 19–28. PMID:17689830
21. Horst RJ, Doehlemann G, Wahl R, Hofmann J, Schmiedl A, Kahmann R, et al.Ustilago maydisinfection strongly alters organic nitrogen allocation in maize and stimulates productivity of systemic source leaves. Plant Physiol. 2010; 152: 293–308. doi:10.1104/pp.109.147702PMID:19923237
22. Mills LJ, Van Staden J. Extraction of cytokinins from maize, smut tumors of maize andUstilago maydis
cultures. Physiol Plant Pathol. 1978; 13: 73–80.
23. Bruce SA, Saville BJ, Emery RJN.Ustilago maydisproduces cytokinins and abscisic acid for potential regulation of tumor formation in maize. J Plant Growth Regul. 2011; 30: 51–63.
24. Bolker M, Genin S, Lehmler C, Kahmann R. Genetic regulation of mating and dimorphism inUstilago maydis. Can J Bot. 1995; 73: S320–S325.
25. Snetselaar KM, Carfioli MA, Cordisco KM. Pollination can protect maize ovaries from infection by Usti-lago maydis, the corn smut fungus. Can J Bot. 2001; 79: 1390–1399.
26. Pataky JK, Chandler MA. Production of huitlacoche,Ustilago maydis: timing inoculation and controlling pollination. Mycologia. 2003; 95: 1261–1270. PMID:21149027
27. Morrison EN, Donaldson ME, Saville BJ. Identification and analysis of genes expressed in theUstilago maydisdikaryon: uncovering a novel class of pathogenesis genes. Can J Plant Pathol. 2012; 34: 417–
35.
28. Pataky JK, Snetselaar KM. Common smut of corn. The Plant Health Instructor. 2006; doi: 10.1094/PHI-I-2006-0927-01
29. Ross ARS, Ambrose SJ, Cutler AJ, Feurtado JA, Kermode AR, Nelson K, et al. Determination of endog-enous and supplied deuterated abscisic acid in plant tissues by high-performance liquid chromatogra-phy-electrospray ionization tandem mass spectrometry with multiple reaction monitoring. Anal Biochem. 2004; 329: 324–333. PMID:15158494
30. Dobrev PI, Kamínek M. Fast and efficient separation of cytokinins from auxin and abscisic acid and their purification using mixed-mode solid-phase extraction. J Chromatogr A. 2002; 950: 21–29. PMID:
11990994
31. Jacobsen JV, Pearce DW, Poole AT, Pharis RP, Mander LN. Abscisic acid, phaseic acid and gibberel-lin contents associated with dormancy and germination in barley. Physiol Plant. 2002; 115: 428–441.
PMID:12081536
32. Quesnelle PE, Emery RJN.cis-cytokinins that predominate inPisum sativumduring early embryogene-sis will accelerate embryo growth in vitro. Can J Bot. 2007; 85: 91–103.
33. Farrow SC, Emery RJN. Concurrent profiling of indole-3-acetic acid, abscisic acid, and cytokinins and structurally related purines by high-performance-liquid-chromatography tandem electrospray mass spectrometry. Plant Methods. 2012; 8: 42. doi:10.1186/1746-4811-8-42PMID:23061971
34. Sakakibara H. Cytokinins: Activity biosynthesis, and translocation. Annu Rev Plant Biol. 2006; 57: 431–449. PMID:16669769
35. Jameson P. Cytokinins and auxin in plant-pathogen interactions- An overview. Plant Growth Regul. 2000; 32: 369–380.
36. Ton J, Flors V, Mauch-Mani B. The multifaceted role of ABA in disease resistance. Trends Plant Sci. 2009; 14: 1360–1385.
38. Skibbe DS, Doehlemann G, Fernandes J, Walbot V. Maize tumors caused byUstilago maydisrequire organ-specific genes in host and pathogen. Science. 2010; 328: 89–92. doi:10.1126/science.1185775
PMID:20360107
39. Gao L, Kelliher T, Nguyen L, Walbot V.Ustilago maydisreprograms cell proliferation in maize anthers. Plant J. 2013; 75: 903–914. doi:10.1111/tpj.12270PMID:23795972
40. Babu MR, Choffe K, Saville BJ. Differential gene expression in filamentous cells ofUstilago maydis. Curr. Genet. 2005; 47: 316–333. PMID:15809875
41. Rijavec T, Jain M, Dermastia M, Chourey PS. Spatial and temporal profiles of cytokinin biosynthesis and accumulation in developing caryopses of maize. Ann Bot. 2011; 107: 1235–1245. doi:10.1093/
aob/mcq247PMID:21169292
42. Novakova M, Motyka V, Dobrev PI, Malbeck J, Gaudinova A, Vankova R. Diurnal variation for cytokinin, auxin and abscisic acid levels in tobacco leaves. J Exp Bot. 2005; 56: 2877–2883. PMID:16157652 43. Rodriguez-Gacio MdC, Matilla-Vazquez MA, Matilla AJ. Seed dormancy and ABA signaling: the
break-through goes on. Plant Signal Behav. 2009; 4: 1035–1048. PMID:19875942
44. Cao FY, Yoshioka K, Desveaux D. The roles of ABA in plant-pathogen interactions. J Plant Res. 2011; 124: 489–499. doi:10.1007/s10265-011-0409-yPMID:21380629
45. Jiang CJ, Shimono M, Sugano S, Kojima M, Yazawa K, Yoshida R, et al. Abscisic acid interacts antago-nistically with salicylic acid signalling pathway in Rice-Magnaporthe griseainteraction. MPMI. 2010; 23: 791–798. doi:10.1094/MPMI-23-6-0791PMID:20459318
46. Xu J, Audenaert K, Hofte M, De Vleesschauwer D. Abscisic acid promotes susceptibility to the rice leaf blight pathogenXanthomonas oryzaepvoryzaeby suppressing salicylic acid-mediated defenses. PLoS One. 2013; 8: doi:10.1371/journal.pone.0067413
47. Mohr PG, Cahill DM. Suppression by ABA of salicylic acid and lignin accumulation and the expression of multiple genes, inArabidopsisinfected withPseudomonas syringaepv.tomato. Funct Integr Geno-mics. 2007; 7: 181–191. PMID:17149585
48. Doehlemann G, Wahl R, Horst RJ, Voll LM, Usadel B, Poree F, et al. Reprogramming a maize plant: transcriptional and metabolic changes induced by the fungal biotrophUstilago maydis. Plant J. 2008; 56:181–195. doi:10.1111/j.1365-313X.2008.03590.xPMID:18564380
49. Djamei A, Schipper K, Rabe F, Ghosh A, Vincon V, Kahnt J, et al. Metabolic priming by a secreted fun-gal effector. Nature. 2011; 478: 395–398. doi:10.1038/nature10454PMID:21976020
50. Rabe F, Ajami-Rashidi, Doehlemann G, Kahmann R, Djamei A. Degradation of the plant defence hor-mone salicylic acid by the biotrophic fungusUstilago maydis. Mol Microbiol. 2013; 89: 179–188. doi:
10.1111/mmi.12269PMID:23692401
51. Myers PN, Setter TL, Madison JT, Thompson JF. Abscisic acid inhibition of endosperm cell division in cultured maize kernels. Plant Physiol. 1990; 94: 1330–1336. PMID:16667837
52. Jones RJ, Setter TL. Hormonal regulation of early kernel development in physiology and modeling ker-nel set in maize. In: Westgate M, Boote K, editors. CSSA Special Publication no. 29. Crop Science Society of America and American Society of Agronomy USA; 2000. pp. 25–42.
53. Cheng ZJ, Zhao XY, Shao XX, Wang F, Zhou C, Liu YG, et al. Abscisic acid regulates early seed devel-opment inArabidopsisby ABI5-mediated transcription ofSHORT HYPOCOTYL UNDER BLUE1. Plant Cell. 2014; 26: 1053–1068. doi:10.1105/tpc.113.121566PMID:24619610
54. Rijavec T, Li QB, Dermastia M, Chourey PS. Cytokinins and their possible role in seed size and seed mass determination in maize. In: Montanaro G, editor. Advances in Selected Plant Physiology Aspects. ISBN: 978-953-51-0557-2, In Tech. 2012. Available: http://www.intechopen.com/books/advances-in- selected-plant-physiology-aspects/cytokinins-and-their-possible-role-in-seed-size-and-seed-mass-determination-in-maize.
55. Behr M, Motyka V, Weihmann F, Malbeck J, Deising H, Wirsel S. Remodeling of cytokinin metabolism at infection sites ofColletotrichum graminicolaon maize leaves. MPMI. 2012; 25: 1073–1082. doi:10.
1094/MPMI-01-12-0012-RPMID:22746825
56. Martin RC, Mok MC, Habben JE, Mok DWS. A maize cytokinin gene encoding anO -glucosyltransfer-ase specific tocis-zeatin. Proc Natl Acad Sci U S A. 2001; 98: 5922–5926. PMID:11331778 57. Veach YK, Martin RC, Mok DWS, Malbeck J, Vankova R, Mok MC.O-glucosylation ofcis-Zeatin in
Maize. Characterization of genes, enzymes and endogenous cytokinins. Plant Physiol. 2003; 131: 1374–1380. PMID:12644686
58. Schafer M, Meza-Canales ID, Navarro-Quezada A, Brutting C, Vankova R, Baldwin IT, et al. Cytokinin levels and signaling respond to wounding and the perception of herbivore elicitors inNicotiana attenu-ata. J Integr Plant Biol. 2015; 57: 198–212. doi:10.1111/jipb.12227PMID:24924599
60. Persson BC, Esberg B, Olafsen O, Bjork GR. Synthesis and function of isopentenyl adenosine deriva-tives in tRNA. Biochimie. 1994; 76: 1152–1160. PMID:7748950
61. Yarian C, Townsend H, Czestkowski W, Sochacka E, Malkiewicz AJ, Guenther R, et al. Accurate trans-lation of the genetic code depends on tRNA modified nucleosides. J Biol Chem. 2002; 277: 16391–
16395. PMID:11861649
62. Pertry I, Vaclavikova K, Depudt S, Galuszka P, Spichal L, Temmerman W, et al. Identification of Rhodo-coccus fascianscytokinins and their modus operandi to reshape the plant. Proc Natl Acad Sci U S A. 2009; 106: 929–934. doi:10.1073/pnas.0811683106PMID:19129491
63. Kudo T, Kiba T, Sakakibara H. Metabolism and long-distance translocation of cytokinins. J Integr Plant Biol. 2010; 52:53–60. doi:10.1111/j.1744-7909.2010.00898.xPMID:20074140
64. Gajdosova S, Spichal L, Kaminek M, Hoyerova K, Novak O, Dobrev P, et al. Distribution, biological activities, metabolism, and the conceivable function ofcis-zeatin-type cytokinins in plants. J Exp Bot. 2011; 62: 2827–2840. doi:10.1093/jxb/erq457PMID:21282330
65. Yonekura-Sakakibara K, Kojima M, Yamaya T, Sakakibara H. Molecular characterization of cytokinin-responsive histidine kinases in maize. Differential ligand preferences and response tocis-Zeatin. Plant Physiol. 2004; 134: 1654–1661. PMID:15064375
66. Brugiere N, Jiao S, Hantke S, Zinselmeier C, Roessler JA, Niu X, et al. Cytokinin oxidase gene expres-sion in maize is localized to the vasculature, and is induced by cytokinins, abscisic acid, and abiotic stress. Plant Physiol. 2003; 132: 1228–1240. PMID:12857805
67. Brefort T, Tanaka S, Neidig N, Doehlemann G, Vincon V, Kahmann R. Characterization of the largest effector gene cluster ofUstilago maydis. PLoS Pathog. 2014; 10: e1003866. doi:10.1371/journal/ppat. 1003866PMID:24992561
68. Hinsch J, Vrabka J, Oeser B, Novak O, Galuszka P, Tudzynski P. De novo biosynthesis of cytokinins in the biotrophic fungusClaviceps purpurea. Environ Microbiol. 2015; doi:10.1111/1462-2920.12838
69. Jiang CJ, Shimono M, Sugano S, Kojima M, Liu X, Inoue H, et al. Cytokinins act synergistically with sali-cylic acid to activate defense gene expression in rice. MPMI. 2013; 26: 287–296. doi:
10.1094/MPMI-06-12-0152-RPMID:23234404