Este artigo pode ser copiado, distribuído, exibido, transmitido ou adaptado desde que citados, de forma clara e explícita,
g
g
• RAM, REV. ADM. MACKENZIE, 17(3) • SÃO PAULO, SP • MAIO/JUN. 2016 • ISSN 1518-6776 (impresso) • ISSN 1678-6971 (on-line) • http://dx.doi.org/10.1590/1678-69712016/administracao.v17n3p183-211. Submissão: 11 set. 2015. Aceitação: 28 jan. 2016.
Sistema de avaliação: às cegas dupla (double blind review). UNIVERSIDADE PRESBITERIANA MACKENZIE. Silvio Popadiuk (Ed.), Claudia Cristina Bitencourt (Ed. Seção), p. 183-211.
gReen
maRketing
as
a
mediatoR
betWeen
supply
cHain
management
and
oRganizational
peRfoRmance
EDNEI ROGÉRIO DE SOUZA ZAMPESE
Doctor in Business Administration from the Graduate Program of Business Administration at the Universidade Presbiteriana Mackenzie (UPM). Director of Customer and Planning – Consumer Market at Editora Globo. Avenida Nove de Julho, 5229, Jardim Paulista, São Paulo – SP – Brasil – CEP 01406-200
E-mail: [email protected]
ROBERTO GIRO MOORI
Doctor in Production Engineering from the Politechnical School, Department of Production Engineering at the Universidade de São Paulo (USP). Professor for the Graduate Program in Business Administration at the
Universidade Presbiteriana Mackenzie (UPM). Rua da Consolação, 896, Prédio 45, Consolação, São Paulo – SP – Brasil – CEP 01302-907
E-mail: [email protected]
ADILSON CALDEIRA
184
ABSTRACT
Purpose: The study aims to explore and describe the mediation of green marketing in the relationship between supply chain management and corporate performance. Originality/gap/relevance/implications: The prior intention was to fill an epis-temological gap about green marketing. The presence of green marketing in regression decreases the magnitude of the relationship between supply chain management and performance in Brazilian construction companies.
Key methodological aspects: The study was carried out using quantitative method with exploratory and descriptive purposes. An exploratory research was conduc-ted through in-depth interviews with ten managers working in the construction business. A descriptive survey involved the application of a questionnaire answe-red by a sample of 133 respondents. Data was analyzed using descriptive statis-tics, linear regression and structural equation modeling.
Summary of key results: Data showed that green marketing mediates, in part, the relationship between supply chain management and corporate performance. Key considerations/conclusions: As theoretical implications, the study reinfor-ces positive correlations between the constructs used in the surveyed sector. It resorted to models previously developed that, combined, could be reproduced or falsified, in order to obtain, finally, convergent measurement models. As a practical application, it identified the involvement of employees in environmen-tal issues, missions and visions with explicit statements on energy and water saving and green marketing initiatives to improve the corporate image, such as obtaining environmental certifications. In conclusion, it appears that the civil construction companies have room to improve the communication and image to stimulate both the supply and consumption of green products.
KEYWORDS
185
1
INTRODUCTION
Under the growing pressure of demand for goods and services, deter-mined by global population multiplication, companies are at risk of causing damage to ecosystems. Ozone layer destruction, climate change and accu-mulation of waste pollutants, which affect agricultural production, quality of life and tourism activities, are examples of those effects (Dahlstrom, 2011). Companies that produce goods and provide services (King, Felin, & Whetten, 2009), considered the main responsible for environmental damages, face the challenge of adopting cleaner or “green” practices (Dahlstrom, 2011).
The adoption of green practices, whether motivated by external regulatory pressures or internal proactivity, pervades decisions relating to the manage-ment of the supply chain by companies located in both downstream and ups-tream position in it. (Bowen, Cousins, Lamming, & Faruk, 2001). Green sup-ply chain management (GSCM) aims to achieve improvements in many ways of business performance: economic performance (Alvarez Gil, Jimenez, & Lorente, 2001), environmental and financial performances (Chien & Shih, 2007), environmental performance (Kim, Youn, & Roh, 2011), organizational performance (Shang, Lu, & Li, 2010), ecological and economic performances (Zhu, Sarkis, & Geng, 2005).
The market behavior itself, which leans towards an increase in both con-sumer demand and concon-sumer awareness, encourages companies to create and deliver products considered “green” (Murphy, Graber, & Stewart, 2010). The use of green marketing to facilitate the consumption, production, distribution, promotion and claim of products in a manner that is sensitive or responsive to ecological problems (Dahlstrom, 2011) can influence the achievement of prac-tical results concerning profitability, marketing performance, cost reduction (Fraj, Martínez, & Matute, 2011) and new product launches (Baker & Sinkula, 2005), meaning improvements in the company’s performance.
186
be seen in the importance of sustainability certifications (Yudelson, 2006), such as LEED – Leadership in Energy and Environmental Design – from USA, the AQUA process – High Environmental Quality, a French certifica-tion (Coelho, 2010), and the funding for sustainable projects (Banco Nacional de Desenvolvimento Econômico e Social – BNDES, 2015).
Within this context, the following research issue becomes relevant: is green marketing a mediating factor in the relationship between GSCM and organizational performance?
The objective was to assess the magnitude and statistical significance of green marketing, as an indirect way of the relationship between GSCM and organizational performance.
The article is structured as follows: after this introduction, we present a literature review, the research model and hypotheses, followed by the metho-dological procedures, analysis of data and results. Finally, the final considera-tions display a discussion about implicaconsidera-tions and alternative paths for further researches.
2
THEORETICAL REFERENCES, MODEL AND
HIPOTHESYS
According to Zhu et al. (2005), GSCM may have a direct effect on orga-nizational performance. Green marketing specific actions can be of great assistance to improve this performance (Shang et al., 2010). In this case, it is assumed that the green marketing plays a mediating function through which GSCM indirectly may affect the organizational performance.
187
figuRe 1
REPRESENTATION OF THE INFLUENCE OF GM IN THE RELATIONSHIP BETWEEN GSCM AND OP
Corporate Practice towards GSCM
(CP)
Green Project (GP)
Green Supply Chain Management
(GSCM)
Organizational Performance
(OP)
Green Operation (Green Construction)
(GC)
Green Marketing (GM)
(c) H1 H2 H3 (a) (b)
Note: mediation, according to Iacobucci, Saldanha and Deng (2007):
1. If H2 or H3, or both hypotheses are not statistically significant – then GM does not mediate the relationship between GSCM and OP → rejects to H4.
2. If H2 and H3 are statistically significant – then GM mediates the relationship between GSCM and OP → is accepted H4.
2.1) Apply the z Sobel test to see if mediation is partial or total.
a. if z is statistically significant and H1 is not – then the mediation is complete.
b. if z is not statistically significant, but H1 is – then mediation is partial.
c. if neither z nor H1 are statistically significant – then mediation is partial.
Source: Elaborated by the authors.
The following sections present conceptual foundations that support this adopted theoretical model.
2.1
G R E E N S U P P LY C H A I N M A N AG E M E N T ( G S C M ) A N D O R G A N I Z AT I O N A L P E R F O R M A N C E ( O P )The study of Supply Chain Management (SCM) started in the 1980’s (Bur-gess, Singh, & Koroglu, 2006) and represents the essential concern to integrate critical business processes to add value to consumers and other stakeholders (Lambert, 1993).
188
to SCM includes the influence and the relationship with the environment. The-refore, GSCM has its roots in SCM literature, together with the environmental management literature.
Srivastava (2007), in a review of the literature between 1980 and 2005, divi-des the academic texts on GSCM into three main areas: the importance of GSCM corporate practices, Green Design and Green Operation. The area that discusses the importance of corporate practices regarding GSCM concerns competitive ini-tiatives focused on saving resources, eliminating waste and improving producti-vity. That practices may be considered reactive if related to the compliance with laws and regulations, or proactive, when dedicated to anticipating the law and seeking added value through the integration of environmental activities in the scope of business strategies.
Green Design refers to environmentally conscious design, involving subs-titution of potentially hazardous materials and processes, as well as life cycle analysis, consisting of the global monitoring of raw materials, from extraction to final disposal, and the flow of energy and materials in the environment. Green Operation is divided into green manufacturing (reduction in the use of materials, recycling, remanufacturing, inventory management and production planning), reverse logistics and network design (obtaining, inspection, pre--processing and distribution of materials for recycling and reuse) and waste management (reduction of polluting sources, pollution prevention, and dispo-sal) (Srivastava, 2007).
Other actions toward the “greening” of the supply chain are sustainability certifications for construction market (Yudelson, 2006). The two most relevant are Leadership in Energy and Environmental Design (LEED) from the USA, and
Haute Qualité Environnementale (Alta Qualidade Ambiental [Aqua], from France, a translation of High Environmental Quality [HQE]) (Coelho, 2010).
Corporate GSCM practices, according to Chakraborty (2010), have been sources of cost efficiency and profitability, not only as a way of increasing sales and market share, reducing rework, encouraging the reverse logistics and optimizing resources, but as a way of developing new market opportuni-ties with higher profit margins. Zhu et al. (2005) also reported a positive rela-tionship between environmental management and economic performance in Chinese manufacturing companies. Chien and Shih (2007) found significant evidence between corporate GSCM practices and environmental and financial performance of the electrical and electronic industries in Taiwan. Thus, it is expected that:
189
2.2
G R E E N S U P P LY C H A I N M A N AG E M E N T ( G S C M ) A N D G R E E N M A R K E T I N G ( G M )The recognition of supply chain management as a strategic function for competitive advantage has led authors like Mentzer, Stank and Esper (2008) to talk about the importance of the connection between supply chain management and marketing. Supply chain management focuses on information sharing and collaboration, while marketing is dedicated to value addition, transforming a commodity into a differentiated product, valued making use of elements such as brand, services provided to customers, packaging or other add-ons.
Shang, Lu and Li (2010) developed a taxonomy for GSCM capabilities in the electronics industry of Taiwan. As a result, they formed four clusters: 1. poorly GSCM oriented cluster; 2. green marketing oriented cluster; 3. green supplier oriented cluster; and 4. green inventory oriented cluster. From the examination of performance differences among clusters of companies and dimensions of capabilities in GSCM, it was found that the green marketing group was better oriented to performance marketing (branding, sales, increase in market share, customer satisfaction and loyalty) and economic performance (profitability).
Similarly, Dahlstrom (2011) divided green marketing into four sets of practi-ces: market analysis (segmentation and positioning); integrated communication (communication, message strategies, green brands and certifications); supply strategies; and pricing strategy (costs evaluation, demand, legal barriers, compe-tition, and corporate mission coherence).
Concerning the integration between SCM and green marketing, according to Rao and Holt (2005), when implementing the green supply chain manage-ment, companies expected not only an improvement in environmental perfor-mance, but also corporate image recognition, competitive advantage and marke-ting exposure. Thus, firms that implement green supply chain management should expect:
H2: Green Supply Chain Management has a positive and significant effect on Green Marketing.
2.3
G R E E N M A R K E T I N G ( G M ) A N D O R G A N I Z AT I O N A L P E R F O R M A N C E ( O P )190
However, green marketing studies are recent. Peattie (2001) divided the green marketing history in three phases: the ecological phase (from 1960 to 1985), which had no useful practical results, except for government awareness as a form of response to environmental activism; the environmental phase (from 1985 to 2000), which presented limited practical results due to the difficulty in proving products’ green attributes and companies faced consumers’ distrust, but left a legacy of efficiently implementing experiences such as packaging recycling; and the sustainable phase (from 2000 on), when companies incorporated pro-duct consumption requirements that have low impact on the environment, and the green supplies became relevant to corporations.
Studies devoted to the importance of green marketing can be observed in Biloslavo and Trnavcelic (2009); green marketing segmentation in Banyte, Brazioniene and Gadeikiene (2010); green marketing performance impacts in Shang et al. (2010), Fraj et al. (2011), Ham and Lee (2011) and Zhang (2010), who focused specifically on the implementation of green or environmentally sustai-nable residential building. Please note that green marketing activities without grounding in a real differential characterize “greenwashing” (Peattie, 2001; Fur-low, 2010).
Ham and Lee (2011) looked into the connections between green marketing practices and financial performance in the food industry through electronic sites of American restaurants. The results showed negligible effects on the performan-ce of organizations with green practiperforman-ces in their websites. Mathur and Mathur (2000) evaluated the impact of green marketing corporate advertisements on the economic performance, measured by the value of shares. It became clear that the market value of the average company declined over a period of ten days befo-re and ten days after the advertisement. Besides, ads befo-related to gbefo-reen products, recycling efforts and appointments of environmental managers influence the actions to a negligible extent, while the ad green promotional efforts produced significant negative effects on stock prices.
On the other hand, Fraj et al. (2011) indicated that organizations, which adopted green marketing strategies, improved the profitability by optimizing marketing performance and cost reduction. The study also revealed that the envi-ronmentally oriented companies were more likely to achieve both a higher opera-tional performance and environmental marketing practices. Baker and Sinkula (2005) also obtained a positive relationship between environmental marketing and the success of new products, which increased in turn the market share. Thus, it is expected that:
191
2.4
G R E E N M A R K E T I N G M E D I AT I O N B E T W E E N G R E E N S U P P LY C H A I N M A N AG E M E N T A N D O R G A N I Z AT I O N A L P E R F O R M A N C ESeveral studies have been conducted in different markets and countries to verify the direct effect of GSCM and organizational performance such as Wagner, Schaltegger and Wehrmeyer (2001) and Bowen et al. (2001).
Other studies, such as Green Jr, Whitten and Inman (2012), established that supply chain management had an indirect effect on the performance of Ame-rican companies in different fields and concluded that marketing performance was the path that led to financial results. Idar and Mahmood (2011), based on 356 small and medium-sized companies in Malaysia, also found that marketing had a mediating role in the relationship between entrepreneurial orientation and performance. Despite the examples of mediation, in which the antecedent varia-ble was not about green supply chain management, results showed the impor-tance of marketing as a mediating variable between the antecedent variable in supply chain management and performance.
Thus, it is expected that:
H4: Green marketing mediates the relationship between green supply chain management and organizational performance.
3
METHODS
3.1
N AT U R E , T Y P E , S U B J E C T O F T H E R E S E A R C H , S A M P L I N G A N D DATA C O L L E C T I O N I N S T R U M E N T S192
on audio, together with a convenience sample of ten managers who work in the construction business (Malhotra, 2001). The result of this study was used to develop the data collection tool adapted to the reality of Brazilian construction industry scenario.
Before its completion, the data collection tool was evaluated by three experts in the construction market to point out any errors in comprehension and scale codes (Brace, 2004). The collection tool was completed trough the definition of a structured questionnaire consisting of 47 assertions and five blocks. The first block, concerning GSCM with 26 assertions, subdivided into green corporate practices (CP), with eight assertions, green design (GD) with nine assertions, and green construction (GC), with nine assertions. The second block on Green Marketing (GM) with nine assertions, and the third block on the organizatio-nal performance (OP), 12 assertions. In these three blocks, respondents were requested to mark an ‘x’ in each statement, the degree of agreement on a scale of disagreement and agreement ranging from 1 to 5, where 1 = Strongly Disagree and 5 = Strongly Agree. Two other blocks referred to the characteristics of res-pondents and businesses.
Once questionnaire was defined, the choice of companies by judgment was proceed with (Malhotra, 2001), to be part of the sample to collect data from a base of 16,380 e-mail addresses of companies related to construction and deve-lopment in Brazil. The questionnaire was available on the website for the collec-tion of data online, inviting the participants by letter and e-mail accompanied by a presentation of the objectives of the research and targeted at managers (direc-tors, managers and engineers).
3.2
DATA T R E AT M E N T, M E T H O D L I M I TAT I O N S A N D S T U DY B O U N DA R I E SThe following methods were used to treat collected data:
1. Descriptive statistics, to learn about the characteristics of respondents, companies and assertions. With the examination of the data, some questionnai-res were excluded due to atypical information and/or incomplete filling, which could result in errors in data entry or omission of answers by the respondents. In addition, we sought to understand how the distribution of the data collected in the univariate approach (average, standard deviation, and format) and bivariate (correlation).
193 we analyzed the one-dimensionality and validity of composite reliability,
con-vergent and discriminant of measurements of the constructs of the model. The one-dimensionality was evaluated by internal consistency of the factor loadings of each construct, given by α-Cronbach, where the value of 0.7 is the lower limit of acceptability. As the measurement of internal consistency assumes one-dimen-sional, but does not guarantee its existence, the composite reliability was also evaluated, which represents a more robust measurement construct. Both the one-dimensionality and the composite reliability measurements have an accep-table reference value of 0.7, and may be below 0.7 if the research is exploratory in nature.
Convergent validity was assessed by high factor loadings and the average variance extracted (AVE). Both the factor loadings and the average variance extracted (AVE) have the higher reference value of 0.50 (Hair Jr. et al., 2005). In assessing the discriminant validity, we used the criterion of Fornell and Larker (1981), in which it is considered appropriate when the square root of the average variance extracted (AVE) exceeds the shared correlation of the construct with the rest of the measurement model.
3. Structural equation modeling, the method of paths (path analysis) to examine the strengths and statistical significance between the constructs of the model. In structural equation modeling, the PLS-PM (Partial Least Squa-res-Path Modeling) was adopted, which displays the following characteristics: 1. PLS-PM estimation is based on partial least squares; 2. allows the use of small samples (Smith & Langfield-Smith, 2004); 3. admits the absence of pro-bability distribution properties such as, for example, normal, and admits using interval scales (Jöreskog & Wold, 1982); 4. can include indicators of reflective and formative measurements simultaneously (Henseler, Ringle, & Sinkovics, 2009). In this case, the presence of indicators of formative measurements presents multicollinearity problems (Diamantopoulos & Winklhofer, 2001). To detect the presence of multicollinearity, we adopted the limit for tolerance equal to 0.10 as recommended by Hair Jr. et al. (2005), which corresponds to a value of Variance Inflation Factor (VIF) greater than 10; 5. it is recommen-ded for prediction instead of explanation (Henseler et al., 2009, Jöreskog & Wold, 1982); 6. the relative strengths of variables can be inferred by the factor loadings (Fornell & Laker, 1981); 7. it allows the use of bootstrapping to assess the statistical significance of the coefficients; 8. adjustment of the measu-rement model can be obtained by GoF indexes (Goodness-of-Fit) defined as the geometric average of the average variance extracted and the coefficient of determination (R2) (GoF= 2AVE x R2) and the coefficient of determination R2 as suggested by Tenenhaus, Vinzi, Chatelin and Lauro (2005) and Hair Jr.
194
and Van Oppen (2009) suggest the threshold values of 0.26 and 0.36 for GoF and R2, respectively.
4. Iacobucci et al. (2007) approach to test statistically the mediation of GM in the relationship between OP and GSCM. The mediation is detected with the help of weakening the direct relationship between GSCM and OP (path c, Figure 1) where the GM is present. It means that the mediation will have been found if GSCM does not have any effect on OP when GM is controlled. Iacobucci et al.
(2007) demonstrated the superiority of the structural equation modeling in rela-tion to multiple linear regression by Baron and Kenny (1986) to test the effect of the mediating variable in the relationship between independent and dependent variables statistically. The reason, according to Iacobucci et al. (2007), is that the models have become more complex with construct scenarios of multiple indi-cators and additional antecedents and consequents. In this sense, the approach of mediation from the perspective of structural equation modeling of Iacobucci
et al. (2007) is more robust than Baron and Kenny’s approach (1986) developed from the point of view of linear regression.
5. Sobel z test (Sobel, 1982). As a control to verify that the magnitude of diffe-rence in the relationship between GSCM (independent variable) and OP (depen-dent variable), given by paths c and c’, shown in figures 2 and 3, was statistically significant with or without the mediation of GM (moderator variable).
figuRe 2 figuRe 3
PATTERN WITH GM MEDIATION
PATTERN WITHOUT GM MEDIATION
b c
(n.s. expected)
a
GSCM OP
GM
)
a’
(n.s. expected) (n.s.expected)b’
GSCM OP
GM c’
Note: n.s: non-significant
Source: Elaborated by the authors.
Note: n.s: non-significant
Source: Elaborated by the authors.
Sobel z test formula is: z = Standard Errorc – c’ = b
2Sa 2 + a2S
b 2
a x b
Given that:
195 MacKinnon (2008) suggests that the difference between c – c’, shown
in figures 2 and 3, is given by the product [a x b]. The logic behind the magnitude of the mediation coefficients, given by the product [a x b], is that if X affects Y indirectly through M, the mediating effect is also known as the indirect effect. The effect of X on Y after the adjustment for M, c’, is known as the direct effect. The mediating effect is also equal to the difference between the coefficients c and c’ [c – c’]. As a result, the total effect can be subdivided into a direct effect, c’, and an indirect effect, [a x b] = c – c’.
Depending on the statistical significance determined by tests, we conti-nued the classification of the mediation by type, presented by Iacobucci et al.
(2007), determining whether it is complete, partial or there is no mediation. The main limitations of the method of the study were: 1. the use of a non--random sample of Brazilian companies, which gives rise to possible biases in the responses of research subjects; 2. the size of the sample. Although we used the technique of PLS-PM, which does not require the normality of the data, the condition of five respondents per variable has not been reached (Hair Jr et al., 2005), leading to a cautious interpretation of the findings, and; 3. the multidisciplinary aspect of the study involving subjects such as marke-ting, operations, logistics, supply chain and the environment, which makes the analysis more complex.
In addition, the study had the following boundaries: 1. concerning the scope, the study was conducted in the Brazilian civil construction sector, con-sisting of heterogeneity of companies of all sizes, organizational structures, and technologies. However, due to their importance in relation to GDP (9.2% in 2010) and the amount of people employed (10 million people employed part or full time), it represents an important economic sector in the country and one of the sectors that will grow until 2022, with growth projections of 6.1% per year (Construbusiness, 2010); 2. concerning the theme: the GSCM, marketing and performance constructs were examined in the construction sector. Unlike the manufacturing chain, supply chain studies in construction are recent, pointing to the best way to solve problems in construction sites (Vrijhoef, Koskela, & Howell, 2001) and; 3. concerning the conception, the research was conducted through the cross-section, i.e., a reading held in a single period.
4
ANALYSIS OF DATA AND RESULTS
196
engineers). Out of those, 133 were returned (or 9.3% of the total), of which 30 of them by regular mail and 103 by electronic mail. 109 were fully completed and 24 had some unfilled fields. Partially completed questionnaires had the missing information complemented via telephone contact.
4.1
D E M O G R A P H I C P R O F I L E O F S A M P L E1. Regarding the companies, 62.4% are located in the State of São Paulo and 37.6% in 15 other states. 47.5% of companies are in the Metropolitan Area of São Paulo and 67.3% in Southeast Brazil. Although the sample concentrated in the Southeast (with a relatively higher GDP in 2010), it was described as nationwide. Regarding the sector, 75.4% of companies were in land develop-ing and/or construction areas, demonstratdevelop-ing that the sample focused on the last two supply chain links. About size, 16.7% were made up of micro (up to 19 employees), small (20 to 99 employees) and medium companies (between 100 and 499 employees), each of these classifications represented 35.3% of the sample, and 12.7% were large companies (over 500 employees). The classification of companies regarding size was done according to the Instituto Brasileiro de Geografia e Estatística – IBGE (2015) criteria. However, it was not computed if employees were themselves, outsourced or temporary contracts. The respondent was asked to report only the number of people employed by the company at the time of the survey.
2. A share of 68.8% of respondents had worked for more than five years in their respective companies and in the sector, indicating that they know both the market and the company. As for their activities, 45.7% of respon-dents were involved in the execution of works and 31.5% in the project. The remaining 11.7%, 5.5% and 6.3% worked in finance, marketing and product, respectively. As for the training, 54% of respondents attended Engineering, 22% – Management, 15% – Architecture and 9% – other courses.
In summary, the scope of the sample according to geographic region, seg-ment, size and profile of the respondents suggested that the data collected provide minimum conditions of reliability and quality for research.
4.2
VA L I DAT I O N O F M E A S U R E M E N T S A N D S C A L E S O F C O N S T R U C T S197 runs and interactions, it obtained an underlying structure made up of
38 assertions with factor loadings above 0.71, when the recommended value is 0.7, distributed into five constructs called: Corporate Practices (CP) with 8 assertions, Green Project Enterprises (GP) with 5 assertions, Green Cons-truction (GC) with 6 assertions, Green Marketing (GM) with 8 assertions and Organizational Performance (OP) with 11 assertions. Therefore, from 47 assertions, 38 or 80.9% of the total remained. The cut in the assertions (19.1% of total) can be justified by the lack of clarity or understanding of assertions (or biases on the part of respondents) or size of the sample. Among the dis-carded assertions, some were related to power generation within the works and supplier development from an environmental point of view. Suggestions to minimize the discard of assertions are discussed below in the concluding remarks of this article.
Averages, standard deviations and factor loadings of each of the assertions, refined in their respective constructs, are given in Appendix A.
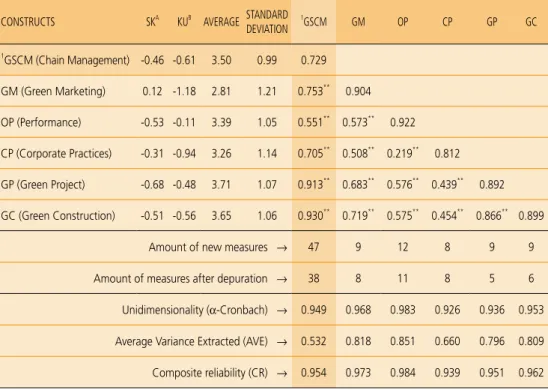
The structure of the constructs obtained by the factorial analysis has been validated as: 1. the one-dimensionality, provided by the α-Cronbach coefficient and the composite reliability, both measurements showed values above the recommended minimum 0.70; 2. the convergent validity, mea-sured by factor loading and average variance extracted (AVE) also achieved values above the recommended minimum of 0.7 and 0.5, respectively, and; 3. the discriminant validity given by shared variances and obtained by the square root of average variance extracted from each construct were higher than the correlations between the constructs, as shown in Table 1 (diagonal matrix in italics).
As for multicollinearity due to the inclusion of formative constructs in the model, Tolerance values were between 0.494 and 1.000 (VIF between 1,000 and 2,026), within the recommended limits (minimum of 0.1 for Tolerance and VIF above 10).
198
table 1
DESCRIPTIVE STATISTICS,
CORRELATION, α-CRONBACH, AVE E CR
CONSTRUCTS SKA
KUB
AVERAGE STANDARD DEVIATION
1
GSCM GM OP CP GP GC
1GSCM (Chain Management) -0.46 -0.61 3.50 0.99 0.729
GM (Green Marketing) 0.12 -1.18 2.81 1.21 0.753** 0.904
OP (Performance) -0.53 -0.11 3.39 1.05 0.551** 0.573** 0.922
CP (Corporate Practices) -0.31 -0.94 3.26 1.14 0.705** 0.508** 0.219** 0.812
GP (Green Project) -0.68 -0.48 3.71 1.07 0.913** 0.683** 0.576** 0.439** 0.892
GC (Green Construction) -0.51 -0.56 3.65 1.06 0.930** 0.719** 0.575** 0.454** 0.866** 0.899
Amount of new measures → 47 9 12 8 9 9
Amount of measures after depuration → 38 8 11 8 5 6
Unidimensionality (α-Cronbach) → 0.949 0.968 0.983 0.926 0.936 0.953
Average Variance Extracted (AVE) → 0.532 0.818 0.851 0.660 0.796 0.809
Composite reliability (CR) → 0.954 0.973 0.984 0.939 0.951 0.962
Note:1 Second order construct; a Sk Value (Skweness) out of range -1 a +1 indicates a substantially
asymmetrical distribution; b positive Ku Value (Kurtosys) indicates a relatively high distribution and a negative value indicates a relatively flat distribution;** indicates that the assertion
coeffi-cient is significant at 1%. Diagonal values in italics represent the square root of Average Variance Extracted (AVE). Average Variance Extracted (AVE) is the same as commonality.
Source: Elaborated by the authors.
After validating the structures of the constructs and their measurements and scales, we proceeded to the evaluation of the relationship between the cons-tructs of the measurement model.
4.3
E VA L UAT I O N O F T H E S T R U C T U R A L R E L AT I O N S O F T H E M E A S U R E M E N T M O D E L199
figuRe 4
MEASUREMENT MODEL:
(A) WITH MEDIATION AND (B) WITHOUT MEDIATION
b. Without mediation
a. With mediation
0,276**
(2,63)
0,368**
0,335**
R2 = 0,36
0,460** Green Project 0,876** 0,877** 0,900** 0,892** 0,915** GP5 GP2 GP1 GP4 GP3 GC1 Green Construction 0,922* 0,877** 0,899**
GC2 GC3 GC4 GC5 GC6 0,928** 0,895** 0,874**
0,926** Performance 0,940** OP1 0,891** 0,910** OP2 OP3 OP4 OP5 0,916** OP6 OP7 OP8 OP9 OP10 OP11 0,919** 0,900** 0,936** 0,938** 0,942** 0,930** Corporate Practices 0,879** 0,839** 0,828** 0,806** 0,838** 0,778** CP6 CP3 CP2 CP1 CP5 CP4 0,806** CP7 CP8 0,715**
GoF = 0,61
GSCM
GM4 GM5 0,940*
0,918**
0,913**
GM1 GM2 GM3 GM6 GM7 GM8 0,918** 0,918** 0,915** 0,853** 0,857**
Green Marketing 0,366** (3,01) 0,753** (17,64)
R2 = 0,57
GSCM Performance
GoF = 0,49
R2 = 0,31
0,559**
(7,84)
Note: ** statistically significant structural coefficient [α≤ 0,01].
Source: Elaborated by the authors.
In Figure 4, the statistical significance of corporate practices (CP), green project (GP) and green construction (GC) constructs can be observed, indicating their importance in the management of green supply chain (GSCM) as presen-ted in arguments by authors such as Srivastava (2007) and Bowen et al. (2001).
200
of the model in Figure 4(b), without mediation, it was 0.31. Although in the model in Figure 4(b), without mediation, the value of R2 determination coeffi-cient was 0.31 (close to the recommended 0.36). In general, it can be considered that there was evidence that the collected data were a good fit for the measure-ment model developed.
As for the measurement model with mediation, shown in Figure 4(a), the GSCM had a direct effect on organizational performance with a structural coeffi-cient of 0.276 and t-statistic equal to 2.63, and supported the hypothesis H1. The GSCM affected the GM with a structural coefficient equal to 0.753 and t-statistic equal to 17.64 and supported the hypothesis H2, which in turn influenced the performance with a structural coefficient equal to 0.366 and t-statistic equal to 3.01 and supported hypothesis H3.
As for the measurement model without mediation in Figure 4(b), it demons-trated that GSCM had a direct effect on operational performance with a structu-ral coefficient of 0.559 and t-statistic equal to 7.84, much higher than Figure 4(a) with a coefficient of 0.276 and t-statistic equal to 2.63. This meant that green marketing as a mediator helped predict organizational performance.
Table 2 presents the structural coefficients, standard error, and the values of t-statistics of the relations in estimation model.
table 2
STRUCTURAL COEFFICIENTS, STANDARD ERROR (S) AND STATISTICS (T)
STRUCTURAL EQUATIONS STRUCTURAL COEFFICIENTS
STANDARD ERROR
S
STATISTICS
T HYPOTHESIS
DECISION (α ≤ 0,05)
With Mediation
Supply management → Performance (c) 0,276 0,105 2,63** H
3 supports
Supply management → Green Marketing (a) 0,753 0,043 17,64** H
1 supports
Green Marketing → Performance (b) 0,366 0,121 3,01** H
2 supports
Without Mediation
Supply management → Performance (c’) 0,559 0,071 7,84**
Source: Elaborated by the authors.
201 of the direct (path c) and indirect (path c’) relationship, shown in figures 2 and 3
were statistically significant.
Applying the Sobel z test (1982), where a = 0.753; b = 0.366; Sa = 0.043; Sb = 0.121, we have:
Sobel z test =
0,3662x 0,0432 + 0,7532x 0,1212 0,753 x 0,366
= 2.98 → value-p = 0.003
Therefore, the difference of the structural coefficients of the paths between GSCM and organizational performance, directly and indirectly, was statistically significant (α≤ 0,01), confirming, in fact, the mediating role of GM in the rela-tionship between GSCM and organizational performance.
In this case, according to the typology of Iacobucci et al. (2007), the media-tion of green marketing was considered partial, with a direct effect on the perfor-mance of GSCM equal to 0.276. The indirect effect was equal to 0.276 [0.753 * 0.366 = 0.276]. The total effect was equal to 0.552 [0.276 + 0.753 * 0.366 = 0.552]. The proportion of mediation in the variance of organizational performance (OP) explained directly and indirectly by the management of green supply chain (GSCM) was 50.0% ([0.753 * 0.366] / [(0.753 * 0.366) + 0.276] = 0 5).
Therefore, the H4 hypothesis was supported partially. The approaches of Baron and Kenny (1986), as well as of Iacobucci et al. (2007), state that for the mediation to be complete, paths a and b should be significant and path c non--significant, which did not occur.
5
CONCLUSION AND SUGGESTIONS
FOR FUTURE RESEARCH
Results revealed that green marketing partially mediates the relationship between the management of the supply chain and green organizational perfor-mance. The implications of theoretical and practical nature of the results obtai-ned are discussed below.
202
of 1 to 5, as shown in Table 1, green marketing obtained a weighted average of 2.81 and GSCM obtained 3.50.
Among the many positive influences observed, an important one is the need to use new technologies in the GSCM practices, which resulted in considerable costs. Nevertheless, there is the recognition that many companies prefer out-of--the-box or less disturbing solutions, suggesting more investment in end-of-pipe technologies, which keep production processes or products with low changes (Vachon & Klassen, 2006).
In general, green investments in construction, in spite of market imperfec-tions, favor the internalization of compatible costs to preserve the environment. The acceptance of certifications such as LEED (Leadership in Energy and Environmen-tal Design) or ecolabels may minimize market failures. In this sense, green marke-ting helps to correct market imperfections or asymmetry of information through the collection and provision of information to consumers (Giordano, 2000).
Theoretical implications: The study, conducted in the Brazilian civil cons-truction economic segment, adds to other existing studies which demonstrated in different fields of activities, regions or countries: 1. the relationship between GSCM and performance, such as Alvarez Gil et al. (2001), and Chien and Shih (2007), Kim et al. (2011), Rao and Holt (2005), Shang et al. (2010) and Zhu
et al. (2005); 2. the relationship between green marketing and performance investigated by Baker and Sinkula (2005), Fraj et al. (2011) Ham and Lee (2011) and Dahstrom (2011); 3. the importance of green marketing as a mediating factor between SCM and performance, approached by Idar and Mahmood (2011) and Green Jr. et al. (2012).
As noted, there are several estimation models for the constructs of this study: GSCM, organizational development and green marketing. In essence, what we sought in theory was to understand the importance of the mediation of green marketing in the relationship between GSCM and organizational perfor-mance. To this end, we used models previously developed that, combined, could be reproduced or distorted (Popper, 1977), to obtain convergent measurement models. Towards the convergence of supply chains and environmental sustai-nability (ecological or green), Linton, Klassen and Jayaraman (2007) argued that the operations are moved from local optimization of environmental factors to the entire supply chain for the production, consumption, customer service and elimination of waste products. However, because of the diversity of measure-ments and scales and the geographic location of companies, obtaining a conver-ged model still requires a lot of research and time, especially due to the need for comparison or building alternative models.
203 direct and indirect (partially moderated by green marketing), show that the green
marketing in construction companies still has room to improve communication and image, to foster both the supply and the consumption of green products.
Construction incorporates a huge dispersion of competitive conditions such as size, control of the property of company capital, technological upgrading and asymmetry in financial leverage capabilities that generate different competi-tion standards. Thus, this study helped minimize these differences, through an understanding of the impact of marketing due to the assumption of a new appro-ach to corporate responsibility for the environment in the supply chain manage-ment, as well as, expanding the literature and GSCM practices integrated with green marketing and environmental management.
Finally, the following is suggested to improve the study:
1. Increase the size of the sample to improve the power of generalization and possibly classify the adoption in different locations (region or country) and type of construction (commercial or residential building). The obtaining of more respondents can be accomplished by replicating the electronic data collection tool, making use of qualified databases with promoters working at events in the construction area, forums, trade and professional associations; 2. Develop a research with a longitudinal concept. By conducting research at
certain intervals of time, it is possible to analyze changing processes in a broader, social, economic and political context surrounding the company. Thus, explanations should arise from the examination of changing proces-ses patterns (Easterby-Smith, Thorpe, & Lowe, 1999); and
3. Carry out research on innovative and emerging topics such as “enviropre-neurial” marketing strategy, as a combination of ecological concerns with marketing strategy, greening the supply chain, where the buyer uses their purchasing power to demand a better environmental performance of the supplier (upstream supply chain).
MARKETING VERDE COMO MEDIADOR ENTRE
GESTÃO DA CADEIA DE SUPRIMENTOS
E DESEMPENHO
RESUMO
204
Originalidade/lacuna/relevância/implicações: Pretendeu-se preencher uma lacuna de natureza epistemológica sobre o marketing verde, constatando-se que este, por estar presente na regressão, diminui a magnitude do relacionamento entre gestão da cadeia de suprimentos e desempenho nas empresas da construção civil brasileira. Principais aspectos metodológicos: Utilizou-se o método quantitativo de natureza exploratória e descritiva. Do estudo exploratório participaram dez gestores. No des-critivo, precedido de pré-testes junto a três especialistas, contou-se com uma amostra de 133 respondentes. Os dados foram tratados por técnicas de estatística descritiva, análise fatorial, regressão linear múltipla e modelagem em equações estruturais. Síntese dos principais resultados: Os dados evidenciaram que o marketing verde medeia, parcialmente, a relação entre gestão da cadeia de suprimentos e o desempenho das empresas.
Principais considerações/conclusões: Como implicações teóricas, o estudo refor-ça correlações positivas entre os constructos utilizados no setor pesquisado. Recorreu-se a modelos previamente desenvolvidos que, combinados, poderiam ser reproduzidos ou falseados, para no final se obter modelos de mensuração convergentes. Como aplicação prática, identificou-se o envolvimento de funcio-nários em temas ambientais, missões e visões com declarações explícitas sobre economizar energia e água e ações de marketing verde para melhoria da ima-gem corporativa, como a obtenção de certificações ambientais. Como conclu-são, verifica-se que as empresas da construção civil têm espaço para melhorar a comunicação e a imagem para estimular tanto os suprimentos como o consumo de produtos verdes.
PALAVRAS-CHAVE
Marketing verde. Desempenho organizacional. Gestão de cadeia de suprimento. Cadeia de suprimento verde. Cadeia de suprimento na construção civil.
MARKETING VERDE COMO UN MEDIADOR ENTRE
LA GESTIÓN DE CADENA DE SUMINISTRO
Y EL DESEMPEÑO
RESUMEN
205 Originalidad/laguna/relevancia/implicaciones: se tenía intención de llenar un
vacío epistemológico sobre el marketing verde. La presencia de marketing verde en la regresión Disminuye la magnitud de la relación entre la administración y rendimiento de la cadena de suministro en empresas constructoras brasileñas. Principales aspectos metodológicos: Se utilizó el método cuantitativo de carácter exploratorio y descriptivo. El estudio exploratorio se llevó a cabo con 10 gerentes. El estudio descriptivo, precedido por pruebas previas con tres expertos, se hizo a través de una muestra de 133 participantes. Los datos se analizaron mediante técnicas de estadística descriptiva, regresión lineal múltiple y modelos de ecua-ciones estructurales.
Síntesis de los principales resultados: Los datos indican que marketing verde media, en parte, la relación entre la gestión de la cadena de suministro y el ren-dimiento empresarial.
Principales consideraciones/conclusiones: Como implicaciones teóricas, el estu-dio refuerza correlaciones positivas entre las construcciones utilizadas en el sec-tor observado. Recurrido a modelos desarrollados previamente que, en conjunto, podrían ser reproducidos o falsificado, el fin de obtener modelos de medición convergentes. Como aplicación práctica, se identificó la implicación de los tra-bajadores en temas ambientales, misiones y visiones con las declaraciones explí-citas sobre la energía y el ahorro de agua y de las iniciativas de marketing verde para mejorar la imagen corporativa, tales como la obtención de certificaciones ambientales. En conclusión, parece que las empresas de construcción civil tie-nen espacio para mejorar la comunicación y la imagen de estimular tanto la oferta y el consumo de productos ecológicos.
PALABRAS CLAVE
Marketing verde. Desempeño organizacional. Gestión de la cadena de suminis-tro. Cadena de suministro verde. Cadena de suministro en la construcción.
REFERENCES
Alvarez Gil, M. J., Jimenez, J. B., & Lorente, J. C. (2001). An analysis of environmental manage-ment, organizational context and performance of Spanish hotels. Madrid: Omega, 29(6), 457-471. Azambuja, M., & O’Brien, W. J. (2009). Construction supply chain modeling: issues and perspec-tives. In W. J. O’Brien, C. T. Formoso, V. Ruben & K. A. London. Construction supply chain mana-gement handbook. London: Taylor & Francis Group.
206
Banyte, J., Brazioniene L., & Gadeikiene A. (2010). Investigation of green consumer profile: a case of Lithuanian market of eco-friendly food products. USA: Ekonomikair Vadyba – Economics and Management, 1(15), 374-383.
Baron, R. M., & Kenny, D. A. (1986). The moderator-mediator variable distinction in social psycho-logical research: conceptual, strategic, and statistical considerations. Washington: Journal of Perso-nality and Social Psychology,51(6), Dec. 1986, 1173-1182.
Biloslavo, R., & Trnavcevic, A. (2009). Web sites as tools of communication of a “green” company. USA: Management Decision, 47(7), 1158-73.
Banco Nacional de Desenvolvimento Econômico e Social (BNDES). (2015). BNDES e o Desenvolvi-mento Sustentável. Retrieved January 11, 2015, from http://www.bndes.gov.br/SiteBNDES/bndes/ bndes_pt/Areas_de_Atuacao/Meio_Ambiente/Rio20/desenvolvimento_sustentavel.htm.
Bowen, F. E., Cousins, P. D., Lamming, R. C., & Faruk, A. C. (2001). The role of supply manage-ment capabilities in green supply. USA: Production and Operations Management, 10(2), 174-189. Brace, I. (2004). Questionnaire Design: How to Plan, Structure and Write Survey Material for Effective Market Research, MRS. Market Research in Practice. UK: London & Sterling, British Library Press. VA: London. United Kingdom.
Burgess, K., Singh, P. J., & Koroglu, R. (2006). Supply chain management: a structured literature review and implications for future research. Bradford: International Journal of Operations & Produc-tion Management,26(7), 703-39.
Chakraborty, S. (2010). Concise Chronological road map of evolving green supply chain manage-ment concepts: a review. USA: IUP Journal of Supply Chain Management, III(4), 7-25.
Chien, M. K., & Shih, L. H. (2007). An empirical study of the implantation of green supply chain management practices in the electrical and electronic industry and their relation to organizational performances. USA: International Journal of Environment Science and Technology, 4(3), 383-394. Coelho, L. (2010). Certificação ambiental. Revista Téchne,155. Retrieved July 2, 2012, from http:// www.revistatechne.com.br/engenharia-civil/155/artigo162886-1.asp.
Cohen, J. (1977). Statistical power analysis for the behavioral sciences (Revised Edition). New York: Academic Press.
Construbusiness. (2010). Segundo Seminário da Indústria Brasileira de Construção. FIESP/CIESP. São Paulo.
Dahlstrom, R. (2011). Green marketing management. Masom, Ohio/USA: Southwestern.
Diamantopoulos, A., & Winklhofer, H. M. (2001). Index construction with formative indicators: an alternative to scale development. USA: Journal of Marketing Research,38(2), 269-277.
Easterby-Smith, M., Thorpe, R., & Lowe, A. (1999). Pesquisa gerencial em Administração. São Paulo: Pioneira.
Furlow, N. E. (2010). Greenwashing in the new millennium. USA: The Journal of Applied Business and Economics, Marymount University, 10(6).
207 Green Jr K. W., Whitten, D., & Inman, R. A. (2012). Aligning marketing strategies throughout the
supply chain to enhance performance. USA: Industrial Marketing Management, 41(6), 1008-1018. Hair Jr, J. F., Anderson, R. E., Tatham, R. L., & Black, W. C. (2005). Análise multivariada de dados (5nd ed.). Porto Alegre: Artmed.
Ham, S., & Lee, S. (2011). US restaurant companies’ green marketing via company websites: impact on financial performance. USA: Tourism Economics, October 2011, 17(5), 1055-1069. Henseler, J., Ringle, C. M., & Sinkovics, R. R. (2009). The Use of Partial Least Squares Path Mode-ling in International Marketing. Advances in International Marketing, 20, 277-319.
Iacobucci, D., Saldanha, N., & Deng, X. (2007). A meditation on mediation: evidence that structu-ral equations models perform better than regressions: Pennsylvania: Journal of Consumer Psycho-logy, 17(2), 140-154.
Idar, R., & Mahmood, R. (2011). Entrepreneurial and market orientation relationships to perfor-mance: The SME perspective. Interdisciplinary Review of Economics and Management, 1(2), 1-8. Jöreskog, K. G., & Wold, H. (1982). The ML and PLS Techniques for Modeling with Latent Varia-bles: Historical and Comparative Aspects. In K. G. Jöreskog & H. Wold (Eds.). Systems under indirect observation: causality, structure, prediction. Part I. Netherlands: North-Holland Publishing Company. Kim, J., Youn, S., & Roh, J. (2011). Green supply chain management orientation and firm perfor-mance: evidence from South Korea. USA: International Journal of Services and Operations Manage-ment,8(3), 283-304.
King, B., Felin, T., & Whetten, D. (2009). Finding the organization in organizational theory: a meta-theory of the organization as a social actor. Organization Science, Articles in Advance, 1-16. Koskela, L. (1992). Application of the new production philosophy to construction. Stanford: Stanford University, Center of Integrated Facility Engineering. Technical Report 72, 1-75.
Lambert, D. M. (1993). Strategic logistics management. Homewood: R. D. Irwin.
Linton, J. D., Klassen, R., & Jayaraman, V. (2007). Sustainable supply chains: An introduction. USA: Journal of Operations Management, 25(6), 1075-1082. DOI: 10.1016/j.jom.2007.01.012. MacKinnon, D. P. (2008). Introduction to statistical mediation analysis. New York: Taylor & Francis Group.
Malhotra, N. K. (2001). Pesquisa em marketing: uma orientação aplicada. Porto Alegre: Bookman. Mathur, L. K., & Mathur, I. (2000). An analysis of the wealth effects of green marketing strategies. USA: Journal of Business Research, 50(2), 193-200.
Mentzer, J., Stank T., & Esper T. (2008). Supply chain management and its relationship to Logis-tics, Marketing, Production and Operations Management. Journal of Business Logistics. 29(1), 31-46. Murphy, R., Graber, M., & Stewart, A. (2010). Green marketing: a study of the impact of green marketing on consumer behavior in a period of recession. The Business Review,16(1), 134-140. Peattie, K. (2001). Towards sustainability: the third age of green marketing. The Marketing Review, 2(Winter), 129-146.
Popper, K. R. (1977). A lógica da pesquisa social. São Paulo: Editora Cultrix.
208
Smith, D., & Langfield-Smith, K. (2004). Structural Equation Modeling in Management Accoun-ting Research: Critical Analysis and Opportunities. Journal of Accounting Literature, 23, 49-86. Sobel, M. E. (1982). Asymptotic intervals for indirect effects in structural equations models. In S. Leinhart (Ed.). Sociological methodology 23,(Vol. 13, pp.290-312). San Francisco: Jossey-Bass. Srivastava, S. (2007). Green supply chain management: a state of the art literature review. USA: International Journal of Management Review, 9(1), 53-80.
Tenenhaus, M., Vinzi, V. E., Chatelin, Y., & Lauro, C. (2005). Pls – Path Modeling. Computational Statistics & Data Analysis, 48(1), 159-205.
Vachon, S., & Klassen, R. D. (2006). Green project partnership in the supply chain: the case of the package printing industry. USA: Journal of Cleaner Production, 14(6/7), 661-671.
Vaz, H. (2014). Cliente quer economia e sustentabilidade. São Paulo: OESP. Economia e Negócios, Edição Especial, 13 de abril de 2014, p. H2.
Vrijhoef, R., Koskela, L. J., & Howell, G. (2001). Understanding construction supply chains: an alternative interpretation. National University of Singapore: 9th International Group for Lean Construction Conference.
Wagner, M., Schaltegger, S., & Wehrmeyer, W. (2002). The relationship between the environ-mental and economic performance of firms: what does theory propose and what does empirical evidence tell us? Greener Management International, 34, 95-118.
Wetzels, M., Odekerken-Schröder, G., & Van Oppen, C. (2009). Using PLS path modeling for assessing hierarchical construct models: guidelines and empirical illustration. USA: MIS Quarter-ly, 33(1), 177-195.
Yudelson, J. (2006). Marketing green business. Guide for engineering, construction and architectu-re. Boca Raton, FL/USA: The Fairmont Press.
Zhang, J. (2010). Green marketing strategy analysis of real estate based on low-carbon economy. International Journal of Business and Management, 5(12), 2010.
Zhu, Q., Sarkis, J., & Geng, Y. (2005). Green supply chain management in China: pressures, practices and performance. International Journal of Operations and Production Management, 25(5), 449-468.
•
RAM, REV
. ADM. MACKENZIE,
17
(3), 183-211
•
AULO, SP • MAIO/JUN. 2016 • ISSN 1518-6776 (impr
esso) • ISSN 1678-6971 (
on-line
)
•
GREEN MARKETING AS A MEDIA
TOR BETWEEN SUPPL
Y CHAIN MANAGEMENT
...
•
table 1
CONSTRUCTS, MEASURES AND ASSERTIONS
CONSTRUCT/ASSERTION AVERAGE S.D. LOADING
a) Corporate Practices: in the last 2 years, the company has adopted the following green practices Corporate
Practices
CP1 Include environmental concerns as core value in mission and vision statements 3,56 1,31 0,828** CP2 Have a system of prevention of environmental emergencies 3,14 1,44 0,838** CP3 Encourage the involvement of all employees in environmental issues 3,65 1,29 0,839** CP4 Obtain environmental certification 3,15 1,47 0,806** CP5 Important weight of environmental criteria in corporate decisions 3,36 1,35 0,879** CP6 Voluntarily participate in environmental practices beyond legal obligations 3,20 1,37 0,778** CP7 Provide training in environmental management for employees 3,19 1,45 0,806** CP8 Have a formal Environmental Management System (EMS) 2,89 1,55 0,715** b) Green Projects: in the last 2 years, the company has adopted the following practices in venture green projects
Green Project
GP1 Energy-saving devices use (e.g. low-energy bulbs, motion sensors, efficient air conditioners) 4,23 1,14 0,892** GP2 Water-saving devices use (e.g. individual metering of water, rainwater or sewage reuse) 3,82 1,36 0,877** GP3 Devices to generate less pollution use 3,50 1,41 0,900** GP4 Material consumption minimization (e.g. structural optimization, wall filling practices) 3,60 1,23 0,876** GP5 Green criteria in material selection (e.g. materials with low emissions during use,
suitable for recycling, which do not emit toxic gases and volatile) 3,42 1,24 0,915**
•
RAM, REV
. ADM. MACKENZIE,
17
(3), 183-211
•
SÃO P
AULO, SP • MAIO/JUN. 2016 • ISSN 1518-6776 (impr
esso) • ISSN 1678-6971 (
on-line
)
•
EDNEI ROGÉRIO DE SOUZA ZAMPESE
•
OBER
TO GIRO MOORI
•
ADILSON CALDEIRA
•
table 1 (continuation)
CONSTRUCTS, MEASURES AND ASSERTIONS
CONSTRUCT/ASSERTION AVERAGE S.D. LOADING
c) Green Construction: in the last 2 years, the company has adopted the following practices in work execution Green
Construction
GC1 Reduce waste of materials in construction site 4,04 1,20 0,899** GC2 Reusing materials on construction site 3,90 1,23 0,877** GC3 Replacing, reducing or minimizing the use of toxic substances (eg paints and solvents) 3,54 1,28 0,922** GC4 Actions to reduce liquid waste (e.g., leak containment or flushing with water) 3,72 1,30 0,928** GC5 Reduce energy use at the construction site 3,48 1,22 0,895** GC6 Actions to improve supply chain environmental efficiency (e.g. cooperation to reduce
packaging, economic transport, technological synergie) 3,22 1,37 0,874** d) Green Marketing: in the last 2 years, the company has adopted the following green marketing practices
Green Marketing
GM1 Use of market monitoring tools aiming to follow green-competitive practices 2,88 1,41 0,913** GM2 Market segmentation looking for customers interested in green specifications
(e.g. market research driving to detect green demands in the market) 2,57 1,35 0,918** GM3 Apply tools to define the market positioning of green products company 2,64 1,35 0,940** GM4 Adopt pricing strategies based on differentials in green product 2,77 1,31 0,918** GM5 Adopting green features in the product advertising (e.g. in sales argument, website,
sales materials and advertising in specialized media) 3,18 1,42 0,918** GM6 Adopt green features as a way to improve the corporate image 3,36 1,45 0,915**
•
RAM, REV
. ADM. MACKENZIE,
17
(3), 183-211
•
AULO, SP • MAIO/JUN. 2016 • ISSN 1518-6776 (impr
esso) • ISSN 1678-6971 (
on-line
)
•
GREEN MARKETING AS A MEDIA
TOR BETWEEN SUPPL
Y CHAIN MANAGEMENT
...
•
CONSTRUCT/ASSERTION AVERAGE S.D. LOADING
Green Marketing
GM7 Sponsoring groups and environmental events 2,52 1,46 0,853** GM8 Green form alliances or collaboration agreements with government agencies 2,51 1,45 0,857** e) Organizational Performance: in the last 2 years, there was an improvement in company’s performance in the following aspects
Organizational Performance
OP1 Sales increase 3,41 1,38 0,919** OP2 Market share increase 3,34 1,35 0,900** OP3 Corporate image improvement 3,55 1,26 0,936** OP4 Environmental performance improvement in related businesses or buildings regarding
to the reduction of water consumption 3,36 1,39 0,938** OP5 Environmental performance improvement in related businesses or buildings regarding
to energy efficiency 3,30 1,27 0,940** OP6 Environmental performance improvement in related businesses or buildings regarding
to the use of materials 3,39 1,29 0,926** OP7 Financial results improvement 3,39 1,21 0,910** OP8 Revenue increase 3,42 1,26 0,891** OP9 Reductions of risk of environmental legal penalties 3,55 1,29 0,916** OP10 Improvement in company operation (e.g., building efficiency indicators) 3,27 1,14 0,942** OP11 Operational management of the supply chain improvement 3,22 1,19 0,930**