Determination of genetic variation in
Rhodiola crenulata
from
the Hengduan Mountains Region, China using inter-simple sequence repeats
Yidong Lei
1,2, Hong Gao
2, Tashi Tsering
3, Suhua Shi
4and Yang Zhong
21
Fudan University, Department of Environmental Science and Engineering, Shanghai, China.
2
Ministry of Education, Fudan University, School of Life Sciences, Key Laboratory for Biodiversity Science
and Ecological Engineering, Shanghai, China.
3Tibet University, Department of Biology, Lhasa, Tibet, China.
4
Ministry of Education, Zhongshan University, Key Laboratory of Gene Engineering, Guangzhou, China.
Abstract
The plantRhodiola crenulatais a perennial herbaceous species distributed in the plateau region of southwestern China, especially the Hengduan Mountains region. It has been one of the most important traditional herbal remedies in Tibet for more than one thousand years, but the accelerated and uncontrolled collection of this plant since the 1980s has lead to deforestation. We used inter-simple sequence repeats (ISSR) to assess levels of genetic variation inR. crenulatafrom nine diverse natural populations in eastern Tibet and northern Yunnan, the first time such a study has been carried out. The 12 primers we used were able to detect 184 polymorphic loc. Analysis of molecular vari-ance (AMOVA) indicated that species level genetic diversity was relatively high (p = 97.83%, andH
o= 0.464) and
analysis using Shannon’s index showed that the within and between genetic diversity ofR. crenulataare approxi-mately equal. Nei’s genetic distance and unweighted pair-group method with arithmetic averages (UPGMA) cluster analysis showed that the three populations from Tibet and the six populations from Yunnan form two major clusters. The Yunnan populations from three locations were further divided into three corresponding groups, indicating that genetic differentiation was correlated to geographic distribution. Understanding the genetic structure ofR. crenulata provides insight for the conservation and management of this endangered species.
Key words:genetic diversity, Hengduan Mountains region, ISSR,Rhodiola crenulata. Received: January 1, 2005; Accepted: November 16, 2005.
Introduction
The plantRhodiola crenulata is a perennial
herba-ceous plant mainly distributed in the high plateau region of southwestern China, especially the Hengduan Mountains region including eastern Tibet, northern Yunnan and west-ern Sichuan. Thriving at high elevations (2800-5600 m) in cold, moist climatic areas of the Northern hemisphere near the tundra,R.crenulatagrows exceptionally well in a
vari-ety of habitats including meadows, rocky crevices, cliffs and slopes, dunes and sandy soils. A cluster ofR. crenulata
plants often grows to several tens of square meters and pro-duces reptant, succulent rhizomes and red extracting solu-tions from flowers, roots and stems (Fu and Fu, 1984; Wu and Raven, 2001). As one of the most important traditional herbal remedies, R. crenulata has long been used in the
treatment of long-term illnesses and weaknesses due to in-fection in Tibet and other regions for more than 1000 years (Xiong, 1995; Zhao et al., 1998; Rohloff, 2002). Recent pharmacological studies have found that this plant contains many ingredients such as salidrosides which are highly ac-tive against anoxia, fatigue, toxic reactions, radiation sick-ness, tumors and aging as well as presenting active-oxygen scavenging properties (Kurkin and Zapesochnaya, 1986; Penget al., 1996; Ohsugiet al., 1999). Lei et al.(2003, 2004) investigated the interpopulation chemical variability of essential oils fromR. crenulatarhizomes from Tibet and Yunnan and found that there were two main chemotypes of the essential oils in Tibetan (geraniol-rich) and Yunnan (n-octanol- and geraniol-rich) R. crenulata populations which can be used for identifying the source ofR. crenulata
genetic resources.
Since 1980s, the accelerated and uncontrolled use of
R. crenulatain southwestern China has been leading to de-forestation, with a number ofRhodiolaspecies, including
R. crenulata, considered for inclusion in the National Class www.sbg.org.br
Send correspondence to: Yang Zhong. Ministry of Education, Fudan University, School of Life Sciences, Key Laboratory for Biodiversity Science and Ecological Engineering, 200433 Shang-hai, China. E-mail: [email protected].
One Endangered Species in China checklist for conserva-tion purpose. Little is known about the genetic background ofR. crenulataand there is a need for more information on
genetic variability and the population structure of natural populations to supportR. crenulataconservation and
man-agement programs.
In recent years a number of molecular markers such as random amplified polymorphic DNA (RAPD) (Hu and Quiros, 1991; Munthaliet al., 1992), amplified fragment
length polymorphism (AFLP) (Voset al., 1995), simple
se-quence repeats (SSR) (Zietkiewiczet al., 1994) and
inter-simple sequence repeats (ISSR) (Salimath et al., 1995;
Wolfe and Randle, 2001) have been widely used to detect genetic diversity in plants (Karpet al., 1996; Wolfe and
Liston, 1998; Nanet al., 2003; Tanget al., 2003). In
partic-ular, ISSR markers can be highly variable within a species and have the advantage over RAPD markers that they use longer primers that allow more stringent annealing temper-atures and reveal many more polymorphic fragments. In this study, ISSR markers were used to analyze the genetic diversity and genetic structure of naturalR. crenulata
popu-lations from the Hengduan Mountains region, China. The objectives of the research described in this paper was to evaluate the population-level genetic diversity of R. crenulatafor the first time, to determine the genetic
differ-entiation between the populations from Tibet and Yunnan, China, and to assess the implications of our study for future
Rhodiolaconservation and management programs.
Materials and Methods
Sample collection
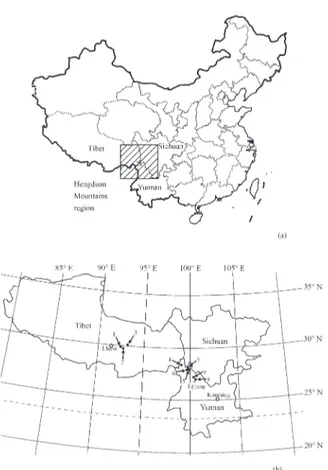
A total of 164Rhodiola crenulataplants, represent-ing nine diverse natural populations, were sampled from the Hengduan Mountains region, China (Figure 1). FreshR. crenulata leaves were collected from the following four sets of sites: (1) Kongpojiangda (Kongpo Gyamda) County, Linzhi (Nyingchi) District, Tibet in August 2002 from Mount Mila, eastern side at 4670 m (sample P1), western side at 5150 m (sample P2) and western side at 3890 m (sample P3); (2) Deqin County, Diqing District, Yunnan, China in September 2002 from Mount Meili Snow at 4650 m (sample P4); (3) the mining region, Shangri-la County, Diqing District, Yunnan in August 2003 from Mt. Hong at 4390 m (sample P5), 4420 m (sample P6) and 4420 m (P7); and (4) Lijiang, Yunnan in July, 2003 from Mount Jade Dragon Snow at 5100 m (P8) and 4100 m (P9). The leaves were collected from 12 - 23 randomly selected plants in each site (population) at intervals of at least 4 m. Samples were stored with silica gel in zip-lock plastic bags until DNA isolation. Vouchers of the samples were depos-ited at the Ministry of Education Key Laboratory for Bio-diversity Science and Ecological Engineering at Fudan University, Shanghai 200433, China.
DNA extraction and ISSR assay
A modified DNA mini-prep procedure of Doyle and Doyle (1990) was used to extract DNA, the quality of which was checked on 1% (w/v) agarose gel and its concen-tration determined using a Hoeffer fluorometer.
Ninety primers from the University of British Colum-bia, Canada set 9 of ISSR primers (http://www. michaelsmith.ubc.ca) were tested and 12 primers were se-lected for PCR (Table 1). Reaction volumes were 10µL, and consisted of 1µL 10 x reaction buffer, 0.1µL 10 mM dNTPs, 0.25µM primer, 2% (w/v) formamide, 10 ng DNA template and 1 unit of Taq DNA polymerase (Genda Tech Corp, Canada). The thermocycler program was 5 min at 94 °C followed by 40 cycles of 1 min at 94 °C, 1 min an-nealing at 51 or 54.5 °C (Table 1) and 2 min extension at 72 °C, and a final 7 min extension at 72 °C.
Amplification products were resolved electrophore-tically on 1.5% (w/v) agrose gels in 0.5 x TBE buffer by loading the entire reaction volumes into prepared wells. Gels were run until a bromophenol blue indicator dye ran 10 cm from the well. Gels were stained with ethidium bro-mide and bands were visualized and photographed under
UV light. Molecular weights were estimated using a 100 bp DNA ladder (Shengong Inc., Shanghai, China).
Scoring and data analysis
All ISSR bands were scored as present (1) or absent (0). From banding patterns of the nine populations, the number of polymorphic loci and the percentage of poly-morphic loci (p) at population and species level were calcu-lated. The degree of within-population diversity was quantified using Shannon’s index of phenotypic diversity (Ho), estimated as -Σp3 log2pi,wherepiwas the frequency
of the presence or absence of a band (Lewontin 1972; King and Schaal 1989). The average diversity over the different populations (Hpop) and the diversity calculated from the
phenotypic frequenciespin all populations considered to-gether (Hsp) was calculated from -Σp log2p. It was then
pos-sible to calculate the proportion of diversity within (Hpop
/Hsp) and between populations [(Hsp- Hpop)/Hsp].
A dendrogram based on Nei’s (1978) unbiased ge-netic distances and the unweighted pair-group method with arithmetic averages (UPGMA) was constructed using the
TFPGA program version 1.3 (Miller, 1997). Marker fre-quencies were estimated based on Lynch and Milligan’s (1994) frequency correction for dominant markers. Boot-strapping over loci was also performed with TFPGA with 1000 permutations.
The correlation between the genetic distance and geo-graphic distance matrices was investigated using the Man-tel test of matrix correspondence (ManMan-tel, 1967) implemented in the NTSYSpc 2.0 package (Rohlf, 1998). Statistical significance of the Mantel test was determined using 1000 random permutations.
Analyses of molecular variance (AMOVA) based on the pairwise squared Euclidean distances between molecu-lar phenotypes were carried out to partition the genetic diversity between populations using the WINAMOVA pro-gram version 1.55 (Excoffieret al., 1992). Gene flow as
number of migrants per generation (Nm) between
popula-tions was estimated based uponΦST(analogous toFST),
us-ing the method of Wright (1951).
Results
For the 164 R. crenulata specimens tested the 12
primers produced 184 bands, 180 of which were polymor-phic. The size of the amplified DNA fragments ranged from 190bp to 2600bp and the average number of bands per primer was 15.3. The number of bands and polymorphic bands produced by each primer varied, the highest number of bands (20) being produced by primer 845 and the lowest number of bands (11) by primer 807. We observed 164 unique ISSR banding patterns, i.e., each specimen
pre-sented a unique ISSR phenotype, indicating extensive ge-netic variation in the individual plants analyzed. There were no population-specific markers,i.e.markers present
in one population but absent in the others.
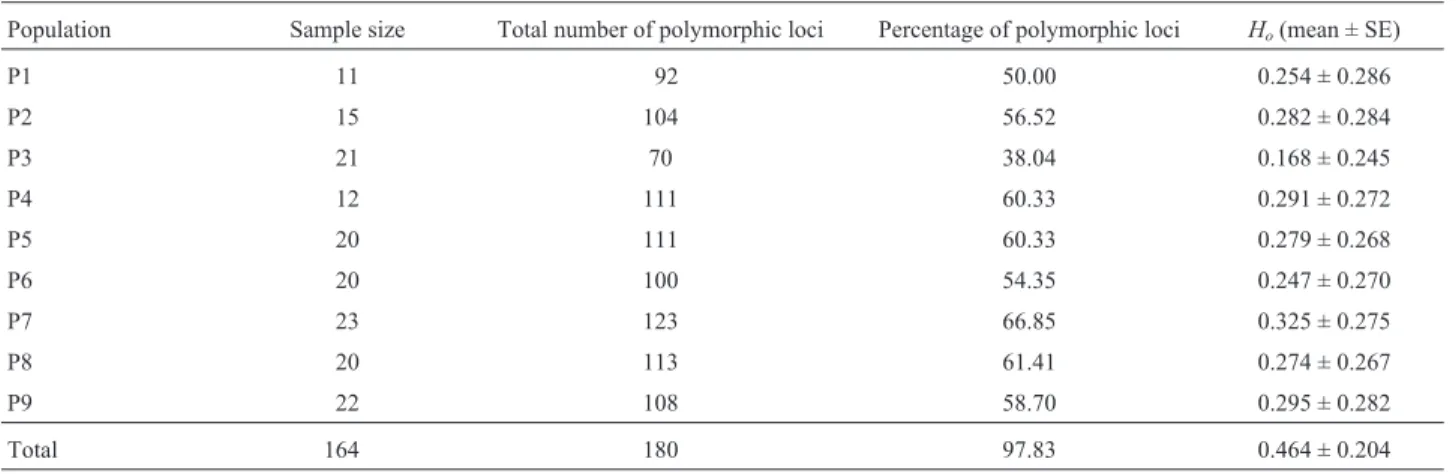
The percentage of polymorphic loci ranged from 38.04% for population P3 to 66.85% for population P7, with a mean of about 56.28% (Table 2). The percentage of polymorphic bands at species level for each primer combi-nations ranged from about 92.31% to 100%. Estimates of
Table 1- Primers used for ISSR amplification.
Primer Sequence Annealing temperature (°C)
807 (AG)8T 53
810 (GA)8T 52
811 (GA)8C 52
823 (TC)8C 52
834 (AG)8(CT)T 54.5
840 (GA)8(CT)T 53
841 (GA)8(CT)C 53
845 (CT)8(AG)G 52
857 (AC)8(CT)G 53
864 (ATG)6 52
873 (GACA)4 51
887 (AGT) (ACG) (AGT) (TC)7 51
Table 2- Genetic variation between populations ofRhodiola crenulatabased on 184 ISSR markers.
Population Sample size Total number of polymorphic loci Percentage of polymorphic loci Ho(mean ± SE)
P1 11 92 50.00 0.254 ± 0.286
P2 15 104 56.52 0.282 ± 0.284
P3 21 70 38.04 0.168 ± 0.245
P4 12 111 60.33 0.291 ± 0.272
P5 20 111 60.33 0.279 ± 0.268
P6 20 100 54.35 0.247 ± 0.270
P7 23 123 66.85 0.325 ± 0.275
P8 20 113 61.41 0.274 ± 0.267
P9 22 108 58.70 0.295 ± 0.282
Shannon’s index of phenotypic diversity (Ho) ranged from
0.168 for population P3 to 0.325 for population P7 with an average of 0.268, which was consistent with the variance of the percentage of polymorphic bands. At species level,Ho
was 0.464 (Table 2).
Partitioning of genetic variability by analysis of mo-lecular variance revealed that most of the ISSR diversity was distributed between individual plants within popula-tions (52.62 %), with the remaining diversity distributed between populations within locations (25.36 %) and be-tween locations (22.02 %) (Table 3). Of the total genetic di-versity, 44.86% resided in populations and the rest (55.14%) in individual plants within populations. We also found that 32.92 % of the variance was between locations and 67.08 % within locations. The estimated population differentiation (ΦST= 0.474) for this phenetic treatment of
the data was close to the coefficient of Shannon’s index. Based on theΦSTvalue, the gene flow (Nm) was 0.277.
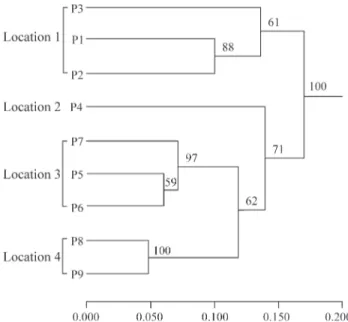
A dendrogram generated using the Nei’s (1978) ge-netic distance and the UPGMA method showed that the Ti-betan populations and Yunnan populations form two major clusters, implying that the genetic differentiation of R. crenulatais correlated to its geographic distribution. The Yunnan populations were divided into three groups (Fig-ure 2): population P4 from Meili snow mountain; three closely related populations from Mt. Hong (P5, P6, and P7); and populations P8 and P9, which were also similar to each other, from Lijiang (Jade Dragon Snow Mountain).
The Mantel test revealed that there was significant correlation between pairwise genetic distance and corre-sponding geographic distance for all nine populations (r= 0.677, p = 0.0060), consistent with the UPGMA
den-drogram that clusters closely-related populations.
Discussion
This study is the first application of ISSR markers to the assessment of genetic diversity inR. crenulata. The par-tition of genetic diversity using both Shannon’s index and AMOVA indicated that genetic diversity inR. crenulatais distributed equally within and between populations. Since the population genetic structure of a species is affected by multiple evolutionary factors including the mating system,
gene flow, mode of reproduction and natural selection (Hamrick and Godt, 1989), it could be speculated thatR. crenulatamight have a mixed mating system, partial
out-crossing by pollen and seed dispersal and partial selfing by sprouting prostrate rhizomes. In general, the detection of high levels of polymorphism makes ISSR analysis a power-ful tool for assessing genetic diversity in R. crenulata.
None of the individual plants were genetically identical ac-cording to ISSR analysis, indicating that the level of resolu-tion in our study was sufficient to distinguish all genotypes.
Accurate estimates of genetic diversity are useful for optimizing sampling strategies and for conserving and managing the genetic diversity of trees (Godt and Hamrick, 1996). In the present study, the genetic diversity indices (p = 97.83%,Ho= 0.464) revealed that genetic diversity of
R. crenulata from the Hengduan Mountains region in southwestern China is relatively high in comparison to that recorded forRhodiola angusta(p = 46.7%, H = 0.195) and
Rhodiola sachalinensis(p = 30.7%, H= 0.122) based on
Figure 2- Dendrogram showing the relationships between nineRhodiola crenulata populations. The dendrogram was generated using the
un-weighted pair-group method with arithmetic averages (UPGMA) method using the genetic distances matrix based on 184 inter-simple sequence re-peat (ISSR) markers produced by 12 single primers. Bootstrap support values are indicated above the branches.
Table 3- Analysis of Molecular Variance (AMOVA) ofRhodiola crenulatabased on 184 inter-simple sequence repeat (ISSR) markers.
Source of variation
Degrees of freedom
Sum of squared deviation
Mean of squared deviation
Variance component Coefficient of
intraclass correlation
p*
Absolute (%)
Between locations 3 1339.1320 446.377 7.38 22.02 Φct= 0.220 < 0.001
Between populations 5 879.7345 175.947 8.50 25.36 Φsc= 0.325 < 0.001
Within populations 155 2733.5420 17.63 17.64 52.62 Φst= 0.474 < 0.001
Total 163 4952.4085 30.383 33.52 100
isozyme markers (Yanet al., 1999; Zuet al., 1998). TheR. crenulata genetic diversity detected in our study also
agrees with the life history traits and geographical distribu-tion of this species. Although the genusRhodiolaoriginates
in the mountainous regions of Southwest China and the Hi-malayas, botanists have established that various species of this genus naturally display a circumpolar distribution in the mountainous regions at the very high latitudes and ele-vations of the Northern Hemisphere (Ohba, 1987; Darbi-nyanet al., 2000).
It is known thatR. crenulatareproduces both sexually
and vegetatively by sprouting prostrate rhizomes, and this can be considered as a strategy for both maximal hetero-zygosity and reproductive success. The high genetic diver-sity observed in our investigation indicates that the populations studied have adapted to environmental changes. One of the reasons is that the locations of the sam-ple collection were in the Hengduan Mountains region, which is one of the biodiversity hotspots of the world and the current distribution and differentiation center for the ge-nusRhodiola. However, the fact thatRhodiolanatural
re-sources have decreased remarkably recently, owning to over-exploitation for medicine and shrinkage of their natu-ral habitat, indicates that the threats to the survival of spe-cies of this genera mainly come from human activity and not genetic variation.
Andrew (1999) states that understanding the evolu-tionary role of gene flow or the migration of individual specimens and the subsequent transfer of genes between populations is also pivotal to the management of endan-gered species. The indirect estimate of gene flow (Nm)
be-tweenR. crenulatapopulations was extremely low (0.277),
implying that genetic drift could be the dominant evolu-tionary factor that shapes the population structure ofR. crenulata according to Wright (1931). Moderate to high
rates of gene flow between populations help prevent subpopulation isolation and thereby maintain genetic varia-tion and prevent inbreeding depression (Franklin, 1980; Frankel and SouleÄ, 1981). Thus with a very low migration rate, genetic drift could have effectively isolated and differ-entiated theR. crenulatapopulations after a long period,
consistent with the almost equal percentage of within and between populations genetic variation. Another potential factor affecting the loss of genetic variation is habitat frag-mentation, which could have restricted gene flow between
R. crenulatapopulations as evidenced by the fact that this
species could only be found in the high and cold mountain-ous regions.
TheR. crenulatapopulation structure revealed by our research has apparent conservation and management impli-cations. An important goal for the conservation of this spe-cies is to preserve more individual plants than populations. Accordingly, in a situation of limited collection and man-agement capacity in germplasm conservation, our recom-mendation is to collect more individual plants from each
population but fewer populations. Although loss of individ-ual plants or populations in some locations may not cause the immediate loss of genetic diversity, it might result in the decreased potential ofR. crenulatato adapt to
environmen-tal changes in the long term. If the goal of rehabilitation and restoration is functionally equivalent with native local ulations, the donor propagules should be selected from pop-ulations that have high genetic similarity to one another. For example, in plantingR. crenulatain China, propagules
collected from ecologically similar populations should be used to increase their potential for survival. In contrast, if the sites are to be planted with propagules from donor pop-ulations, then sampling strategies should focus on small collections spreading across populations and covering sev-eral sites on a regional scale to obtain the maximum repre-sentation of genetic diversity.
Acknowledgments
We thank Mr. Shuangquan Duan (Tibet University, TU) and Zhankui Bai (Fudan University, FU) for their help in fieldwork, Miss FengxiaoTan (Zhongshan University, ZU) and Li Wang (FU) for ISSR technical assistance, and Miss TianTang (ZU) for data analysis and critical com-ments on previous versions of this paper. This research was partially supported by the National Natural Science Foun-dation of China (grant numbers 30360011, 30230030) and the Chinese National Key Project for Basic Research (973) (grant number 2002 CB 512801).
References
Andrew S (1999) Gene flow and endangered species translo-cations: A topic revisited. Biolo Conserv 87:173-180. Darbinyan V, Kteyan A, Panossian A, Gabrielian E, Wikman G
and Wagner H (2000)Rhodiola roseain stress induced fa-tigue: A double blind cross-over study of a standardized ex-tract SHR-5 with a repeated low-dose regimen on the mental performance of healthy physicians during night duty. Phytomedicine 7:365-71.
Doyle JJ and Doyle JL (1990) Isolation of plant DNA from fresh tissue. Focus 12:13-15.
Excoffier L, Smouse PE and Quattro JM (1992) Analysis of mo-lecular variance inferred from metric distances among DNA haplotypes: Application to human mitochondria DNA re-striction sites. Genetics 131:479-491.
Frankel OH and SouleÄ ME (1981) Conservation and Evolution. Cambridge University Press, UK, 327 pp.
Franklin IR (1980) Evolutionary change in small populations. In: Soule ME and Wilcox BA (eds) Conservation Biology: An Evolutionary-Ecological Perspective. Sinauer Associates, Massachusetts, pp 135-150.
Fu SX and Fu KJ (eds) (1984) Flora Republicae Popularis Sinicae. Science Press, Beijing, v. 34, pp 159-220.
Godt MJW and Hamrick JL (1996) Genetic diversity and morpho-logical differentiation in Liatris helleri (Asteraceae), a threatened plant species. Biodiv Conserv 5:461-471 Hamrick JL and Godt MJW (1989) Allozyme diversity in plant
(eds) Plant Population Genetics, Breeding, and Genetic Re-sources. Sunderland, MA, Sinauer Associates, pp 43-63. Hu J and Quiros CF (1991) Identification of broccoli and
cauli-flower cultivars with RAPD markers. Pl Cell Rep 10:505-511.
Karp A, Seberg O and Bulatti M (1996) Molecular techniques in the assessment of botanical diversity. Ann Bot 78:143-149. King L M and Schaal BA (1989) Ribosomal DNA variation and distribution in Rudbeckia missouriensis. Evolution 43:1117-1119.
Kurkin VA and Zapesochnaya GG (1986) Chemical composition and pharmacological studies ofRhodiolaplants. Khim Farm Zh 20:231-1244 (in Russian).
Lei YD, Nan P, Tsering T, Bai ZK, Tian CJ and Zhong Y(2003) Chemical composition of the essential oils of twoRhodiola species from Tibet. Z Naturforsch 58c:161-164.
Lei YD, Nan P, Tsering T, Wang L, Liu SP and Zhong Y(2004) Interpopulation variability of rhizome essential oils in Rhodiola crenulata from Tibet and Yunnan, China. Biochem Syst Ecolo 32:611-614.
Lewontin RC (1972) The apportionment of human diversity. Evol Biol 6:381-398.
Lynch M and Milligan BG (1994) Analysis of population genetic structure with RAPD markers. Mol Ecol 3:91-99.
Mantel NA (1967) The detection of disease clustering and a gen-eralized regression approach. Cancer Res 27:209-220. Miller MP (1997) Tools for Population Genetic Analyses
(TFPGA), Version 1.3. Department of Biological Sciences, Northern Arizona University, Flagstaff, AZ.
Munthali M, Ford-Lloyd BV and Newbury HJ (1992) The random amplification of polymorphic DNA for fingerprinting plants. PCR Methods Appl 1:274-276.
Nan P, Shi SH, Peng SL, Tian CJ and Zhong Y (2003) Genetic di-versity inPrimula obconica(Primulaceae) from central and south-west China as revealed by ISSR markers. Ann Bot 91:329-333.
Nei M (1978) Estimation of average heterozygosity and genetics distance from a small number of individuals. Genetics 89:583-590.
Ohba H (1987) Biogeography of genusRhodiola(Crassulaceae). Acta Phytotax Geobot 38:211-223.
Ohsugi M, Fan W, Hase K, Xiong Q, Tezuka Y, Komatsu K, Namba T, Saitoh T, Tazawa K and Kadota S (1999) Ac-tive-oxygen scavenging activity of traditional nourishing-tonic herbal medicines and active constituents ofRhodiola sacra. J Ethnopharmacol 67:111-119.
Peng JN, Ge YC and Li XH (1996) Studies on the chemical con-stituents ofRhodiola fastigita.Acta Pharm Sin 31:798-800. Rohlf FJ (1998) NTSYSpc: Numerical Taxonomy and
Multi-variate Analysis System, version 2.02. Exeter Software, Setauket, NY.
Rohloff J (2002) Volatiles from rhizomes ofRhodiola roseaL. Phytochemistry 59:655-661.
Salimath SS, De Oliverira AC, Godwin ID and Bennetzen JL (1995) Assessment of genomic origins and genetic diversity in the genusEleusinewith DNA markers. Genome 38:757-763.
Tang T, Zhong Y, Jian SG and Shi SH (2003) Genetic diversity of Hibiscus tiliaceus (Malvaceae) in China assessed using AFLP markers. Ann Bot 92:409-414.
Vos P, Hogers R, Bleeker M, Reijans M, vander der Lee T, Hornes M, Frijters A, Pot J, Wheeler T and Peleman J (1995) AFLP: A new technique for DNA fingerprinting. Nucl Acid Res 23:4407-4414.
Wolfe AD and Liston A (1998) Contributions of PCR-based methods to plant systematics and evolutionary biology. In: Soltis PS, Soltis DE and Doyle JJ (eds) Molecular Systemat-ics of Plant: DNA Sequencing. Kluwer, New York, pp 43-86.
Wolfe AD and Randle CP (2001) Relationships within and among species of the holoparasitic genus Hyobanche (Oroban-chaceae) inferred from ISSR banding patterns and nucleo-tide sequences. Syst Bot 26:120-130.
Wright S (1931) Evolution in Mendelian populations. Genetics 16:97-159.
Wright S (1951) The genetical structure of populations. Ann Engen 15:323-354.
Wu Z and Raven PH (eds) (2001) Flora of China. Science Press, Beijing, and St. Louis. Missouri Botanical Garden Press, v 8, pp 251-268.
Xiong RX (1995) An investigation of the resources ofRhizoma rhodiolaein Tibet. WCJ PS 10:187-188.
Yan TF, Zhou FJ, Yan XF and Zu YG (1999) Genetic diversity and population differentiation ofRhodiola angusta. Bull Bot Res 19:189-194.
Zhao YH, Liu CH and Wu TH (1998) Researches and uses of Rhodiolaplants. Forest By-Prod. Special. China 3:44-45. Zietkiewicz E, Rafalski A and Labuda D (1994) Genome
finger-printing by simple sequence repeats (SSR)-anchored PCR amplification. Genomics 20:176-183.