Diffusive emission of methane and carbon dioxide
from two hydropower reservoirs in Brazil
Marcelino, AA.
a*
, Santos, MA.
b, Xavier, VL.
b, Bezerra, CS.
b, Silva, CRO.
b,
Amorim, MA.
b, Rodrigues, RP.
band Rogerio, JP.
baPrograma de Planejamento Energético – PPE, Instituto Alberto Luiz Coimbra de Pós-Graduação e Pesquisa de Engenharia
– COPPE, Universidade Federal do Rio de Janeiro – UFRJ, Centro de Tecnologia, bloco C, sala 211, CEP 21949-972, Cidade Universitária, lha do Fundão, Rio de Janeiro, RJ, Brazil
bLaboratório de Energias Renováveis e Estudos Ambientais – LEREA, Centro de Tecnologia, bloco I, sala I 211,
CEP 21949-972, Cidade Universitária, Ilha do Fundão, Rio de Janeiro, RJ, Brazil *e-mail: [email protected]
Received: July 16, 2013 – Accepted: May 15, 2014 – Distributed: May 31, 2015
(With 4 figures)
Abstract
The role of greenhouse gas emissions from freshwater reservoirs and their contribution to increase greenhouse gas concentrations in the atmosphere is currently under discussion in many parts of the world. We studied CO2 and CH4 diffusive fluxes from two large neotropical hydropower reservoirs with different climate conditions. We used floating
closed-chambers to estimate diffusive fluxes of these gaseous species. Sampling campaigns showed that the reservoirs studied were sources of greenhouse gases to the atmosphere. In the Serra da Mesa Reservoir, the CH4 emissions ranged
from 0.530 to 396.96 mg.m–2.d–1 and CO
2 emissions ranged from –1,738.33 to 11,166.61 mg.m
–2.d–1 and in Três Marias
Reservoir the CH4 fluxes ranged 0.720 to 2,578.03 mg.m–2.d–1 and CO
2 emission ranged from -3,037.80 to 11,516.64 to
mg.m–2.d–1. There were no statistically significant differences of CH
4 fluxes between the reservoirs, but CO2 fluxes from the two reservoirs studied were significantly different. The CO2 emissions measured over the periods studied in Serra da
Mesa showed some seasonality with distinctions between the wet and dry transition season. In Três Marias Reservoir the CO2 fluxes showed no seasonal variability. In both reservoirs, CH4 emissions showed a tendency to increase during
the study periods but this was not statistically significant. These results contributed to increase knowledge about the
magnitude of CO2 and CH4 emission in hydroelectric reservoirs, however due to natural variability of the data future
sampling campaigns will be needed to better elucidate the seasonal influences on the fluxes of greenhouse gases.
Keywords: hydropower, dissolved organic carbon, greenhouse gas effect, lakes, reservoirs, CO2 emissions.
Emissões difusivas de metano e de dióxido de carbono oriundas de dois
reservatórios hidrelétricos
Resumo
Atualmente, em diversas partes do mundo, tem-se discutido muito sobre a contribuição das emissões de gases de efeito
estufa oriundas de reservatórios hidrelétricos. Neste trabalho foram medidos fluxos difusivos de CO2 e CH4 em dois grandes reservatórios hidrelétricos neotropicais com diferentes condições climáticas (UHE Serra da Mesa e UHE Três Marias). Utilizamos câmaras flutuantes para estimar os fluxos difusivos de CO2 e CH4. As campanhas de amostragem mostraram que os dois reservatórios estudados apresentaram-se como fontes emissoras de gases por mecanismo de
difusão. No reservatório de Serra da Mesa as emissões de CH4 variaram entre 0,530 e 396,96 mg.m–2.d–1 e as emissões
de CO2 variaram entre –1.738,33 a 11.166,61 mg.m–2.d–1. No reservatório de Três Marias os fluxos de CH
4 variaram
entre 0,720 e 2.578,03 mg.m–2.d–1. Já os fluxos de CO
2 variaram de -3.037,80 à 11.516,64 mg.m
–2.d–1. Não houve diferença estatisticamente significativa dos fluxos de CH4 entre os reservatórios estudados, entretanto os fluxos de
CO2 foram significativamente diferentes. As emissões de CO2 medidas ao longo dos períodos estudados em Serra da Mesa mostrou certa sazonalidade, com distinções entre o período de transição seco e úmido. No reservatório de
Três Marias os fluxos de CO2 não apresentaram variabilidade sazonal. Em ambos os reservatórios, as emissões de CH4 apresentaram aumento do fluxo ao longo dos períodos de estudo, mas isso não foi estatisticamente significativo. Estes resultados contribuíram para aumentar o conhecimento sobre a variabilidade das emissões difusivas de CO2 e CH4 em reservatórios de usinas hidrelétricas. Entretanto, novas campanhas de amostragem serão necessárias para
melhor estudar as influências sazonais sobre os fluxos dos gases de efeito estufa.
1. Introduction
Methane (CH4) is the most abundant organic gas in Earth’s atmosphere and has an important role to tropospheric and stratospheric chemistry, affecting for example, tropospheric ozone, hydroxyl radicals and carbon monoxide concentrations, stratospheric chlorine and ozone chemistry and, through its infrared properties, Earth’s energy balance (Cicerone and Oremland, 1988).
Wuebbles and Hayhoe (2002) have estimated that up to 0.6 Gt of methane are emitted annually into the atmosphere; moreover about 75% of this is produced exclusively by strictly anaerobic methanogenic microorganisms present in anoxic environments (Segers, 1998; Whitman et al., 2006). In the same way CO2 plays an important role not only for atmospheric chemistry but also to the chemistry of the biosphere due to its availability as a carbon source for photosynthesis. CH4 is the third most important greenhouse gas after water vapor and CO2 and has a Global Warming
Potential (GWP) 25 times greater than CO2 on a 100 year
timescale (IPCC, 2007). According Dlugokencky and Tans
(2012) and IPCC (2007) global concentrations of CH4 and CO2 in the atmosphere were 1,775 ppb and 394 ppm while in pre-industrial era no more than 715 ppb and 280 ppm, respectively. This trend of increased concentration in the
atmosphere is more and more linked to anthropogenic activities such as livestock, changes in land use and mainly
energy use (IPCC, 2007).
Hydro power reservoirs as artificial aquatic systems
represent an important part of the Earth’s continental territory. They have an important role in the aquatic biogeochemistry and have also many effects on the environment. Recently another important negative impact of dam construction has been reported: emission of greenhouse gases generated by
flooding organic matter during reservoir formation. Since
the beginning of the 1990’s several scientists have argued that hydropower reservoirs, as well as natural ecosystems, emit biogenic gases by bubbling and by molecular diffusion (Rudd et al., 1993; Bartlett and Harriss, 1993; Kelly et al., 1997; Hamilton et al., 1995; Abril et al., 2005). Furthermore, several authors suggest that different environmental variables are related to greenhouse gas emission from a reservoir, such as input of carbon species by rivers and streams (Del Giorgio et al., 1999;
Tranvik et al., 2009), meteorological factors (Striegl
and Michmerhuizen, 1998; Cole and Caraco, 1998), and
biological influences (Dumestre et al., 1999, 2002). Knowledge of greenhouse gases emissions from hydroelectric reservoirs in Brazil becomes important since 83% of Brazilian electricity is produced by hydraulic sources (Brasil, 2012) and Brazil is the second largest producer of hydroelectricity, after China (IEA, 2012).
Research conducted by national and international teams has given successive contributions to the understanding of greenhouse gases emissions from Brazilian hydroelectric reservoirs (Rosa et al., 1994, 2003; Guerin et al., 2006;
Santos et al., 2006; Roland et al., 2010).
This study presents the results of measurements of CH4 and CO2 diffusive emissions from two large hydroelectric reservoirs at in the Brazilian Cerrado, in an attempt to improve quantity and quality of data available. 1.1. Site location
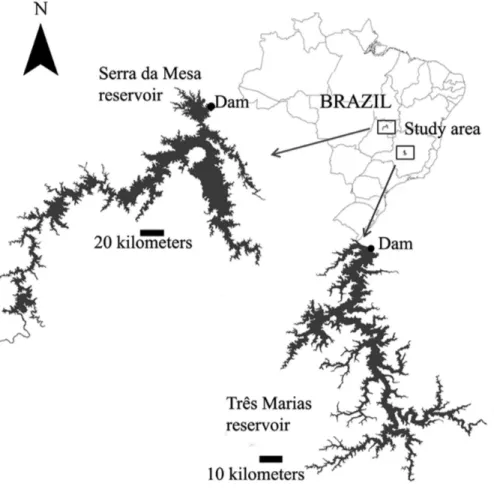
The present study was carried out at the Serra da Mesa Reservoir (15° 50’ 01,6” S 48° 18’ 13,6” W), located in
the Midwest region of Brazil in the Tocantins River – ,
Goiás State, and the Três Marias Reservoir (18° 12’ 50,8” S 45° 15’ 45,9” W) located in southeastern Brazil in the São Francisco River – Minas Gerais State, both in the Brazilian Cerrado Biome (central high plain bush country)
(see Figure 1).
The Serra da Mesa Reservoir is 15 years old and is
the largest by volume in Brazil with 54.4 billion m³, an
average surface area of 1,784 km2 and very important in
the Brazilian energy scenario with 1,275 MW installed capacity. The Três Marias Reservoir has 396 MW installed
capacity and 1,040 km2 flooded area with 21 billion m3 volume and has been working since 1921.
Serra da Mesa is located approximately 580 km north of Três Marias. The climate in both reservoirs is classified
as tropical seasonal dry winters. The average annual temperature is about 25 °C, however the monthly absolute maximum can reach 40 °C. The rains are concentrated in the period between October to March and may reach zero during the dry season which runs from May to August.
2. Experimental Methods
Four sampling campaigns were conducted for each reservoir in order to collect data covering all the hydrologic
periods. Sampling sites was undertaken in Três Marias and Serra da Mesa in different seasons (Table 1).
In order to determine the CH4 and CO2 diffusive
flux, a PVC chamber with a volume of 1000 mL and area
of 0.047 m2 was placed floating on the water surface.
The method was described by Devol (1988, 1990) and
Bartlett et al. (1988, 1990). All the samples were taken
in vegetation-free areas both in the middle of reservoir
and near the edges. One gas sample was taken from the
chamber initially after 2, 4 and 8 minutes, counting from the initial moment when the chamber was placed on the water/air interface. A single sampling was used for each
floating chamber point. The air samples inside the chambers (30mL) were collected by 60 mL polyethylene syringes
and transferred to glass gasometric ampoules. All samples
were taken between 9:00 and 17:00 h, local time.
CH4 and CO2 concentrations were determined in a field
laboratory within 8 hours after collection, using a Varian
CP-3800 chromatograph, with a thermal conductivity
detector (TCD), FID (Flame Ionization Detector) and a
PoraPLOT column. The chromatograph was calibrated
using certified standards purchased from White Martins (Praxair). We use three calibration ranges for each gas: certified standard n. 2432/11 (1,98 mg/L for CH4 and
for CH4 and 602 mg/L for CO2) and certified standard n. 2442/11 (50,2 mg/L for CH4 and 998 mg/L for CO2)
The rate of gas concentration increase within the
chamber, and thus the diffusive flux, was determined by
linear regression of concentration/time data sets (IEA, 2012). According to the IEA guidelines, fluxes were
considered valid only when the regression coefficient (R2)
was greater than 0.85 the root-mean-square error was less than 0.11 (IEA, 2012). The samples that not meet these requirements were discarded.
The Kruskal-Wallis test was used to verify possible
differences in emissions between the two reservoirs and
to check for differences among the sampling campaigns of
each reservoir. “R statistic” software was used for statistical assessment (The R Foundation, 2012).
3. Results
Of 162 fluxes for each gas has measured at Serra da Mesa Reservoir, 5% of fluxes of CH4 and 9% of CO2 were
discarded. Considering the whole sample period, CH4 emissions ranged from 0.530 to 396.96 mg.m–2.d–1 and CO
2 emissions
ranged from –1,738.33 to 11,166.61mg.m–2.d–1.
In Três Marias Reservoir we have measured 186 CH4 fluxes for each gas, of which, 10% of fluxes of CH4 and 13% of CO2 were discarded. CH4 emissions in Três Marias ranged from 0.720 to 2,578.03 mg.m–2.d–1 and
CO2 emission ranged from –3,037.80 to 11,516.64 mg.m–2.d–1. The fluxes measurements from four field campaigns are
shown in Table 2.
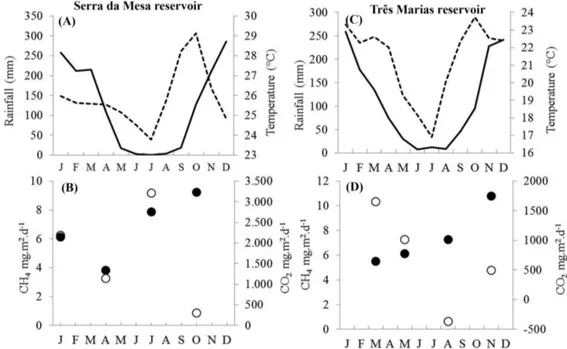
Figure 2 shows historical data series of the rainfall distribution 17 years (from 1975 to 1992 and 2011 to Figure 1. Geographical locations of Serra da Mesa and Três Marias Reservoirs.
Table 1. Sampling sites of reservoirs studied.
Três Marias Reservoir Serra da Mesa Reservoir
2012 of Três Marias and from 1994 to 2012 of Serra da Mesa) (ANA, 2013) and other series of 7 years (2004 to
2010 in both reservoirs) for temperature (INMET, 2013) in regions of the reservoirs as well as the median emission measurements. And as shown in Figure 3 we can see the median values and the outliers of CH4 emissions in both reservoirs. The use of median results as robust description
of gas fluxes and comparison of others central tendency
statistical descriptors can be read in (Damazio et al., 2013). In this current study we have made comparisons of
measured fluxes among the period studied. Regarding
the comparison of CH4 fluxes, statistically significant distinctions between the periods studied were not found in Três Marias Reservoir (see Table 3).
We can say the same thing for the comparisons of CH4 fluxes among sampling campaigns in the Serra da
Mesa Reservoir. An exception was observed in the fluxes
Table 2. Median values of diffusive fluxes (mg.m2.d–1).
CH4 emission Range CO2 emission Range
Serra da Mesa
Reservoir
Jan/12 6.13(36) 3.82-10.88 2,185.41(32) –1,542.51-9,526.49
Apr/11 3.83(37) 2.13-7.43 1,145.66(37) –1,738.33-4,570,52
Jul/11 7.87(42) 0.530-396.96 3,215.39(36) 870,82-11,166.61
Out/11 9.22(39) 1.73-68.77 306,81(41) –776,34-1,349.58
Três Marias Reservoir
Mar/12 5.51(40) 1.53-172.53 1,655.21(35) –3,037.80-11,516.64
May/11 6.12(43) 0.720-150.16 1,014.21 (44) –721,29-7,860.39
Aug/11 7.27(45) 0.890-2,578.03 –370.15 (39) –873,46-9,776.49
Nov/11 10.78(38) 2.73-85.81 497.62 (43) –1,417.57-11,068.53
( ) The numbers in parentheses represent samples valid in each sampling campaign.
Figure 2. (A) and (B) refer to Serra da Mesa Reservoir while (C) and (D) Tres Marias Reservoir. In the horizontal axes are
the months of the year. Solid lines represent monthly average rainfall and the lines segmented monthly average temperature. The blacks circles represent the medians of CH4 emissions and the open circles the median of CO2 emissions.
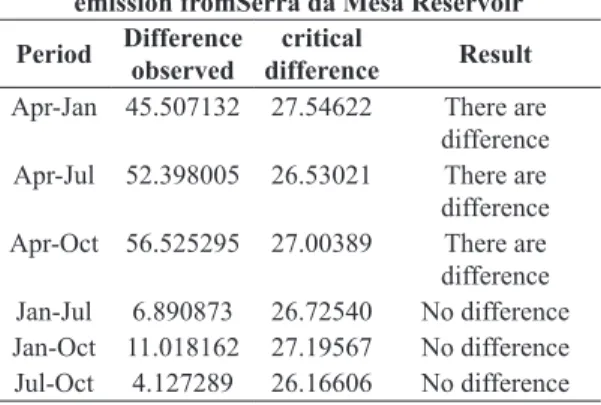
measured in April, which was particularly lower than in other periods (see Table 4).
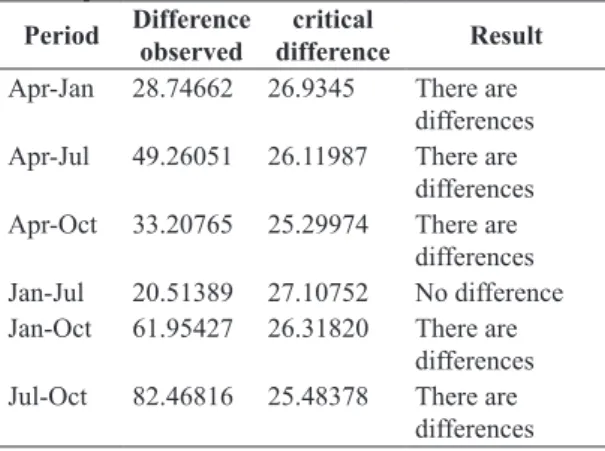
The Figure 4 suggest a certain seasonality of CO2 emission
in the Serra da Mesa Reservoir’, due to differences among the fluxes from rainy-transition (January vs. April and October) and dry-transition (April vs July and October).
Furthermore, emissions measured in transition months
are different between themselves (April vs. October).
(see Table 5).
The Três Marias Reservoir showed no seasonality with regards to CO2 emission, since we found no statistically
significant difference, except for the emissions measured
in May and August (see Table 6).
4. Discussion
In 1998 and 1999, Santos et al. (2006) measured
diffusive emission at Serra da Mesa (range from –6,048 to
10,178 mg.m–2.d–1 to CH
4 and –5,360 to 5,903 mg.m –2.d–1 to
CO2) and Três Marias Reservoir (range from 0.660 to 241 mg.m–2.d–1 to CH
4 and -10,060 to 7,346 mg.m –2.d–1 to
CO2). Thus, the highest emissions that we found in the present study were higher than those found by Santos et al. (2006) in the previous study, with the exception of CH4 emissions
in Serra da Mesa, which in this study had lower values. The emissions peak in the first years after filling
a reservoir tends to decrease and to stabilize over the
subsequent years. In older reservoirs (over 10 years) in boreal
and temperate regions, emissions of greenhouse gases are
similar to natural lakes. However, in the tropics, the time
to return to natural values may be longer, depending on the water quality (Tremblay et al., 2005). We suggest that both the natural variations and external anthropogenic factors, such as the organic material supply, are contributing to
maintain high value in the Serra da Mesa Reservoir and Três
Marias Reservoir, even 13 years after these early studies (Santos et al., 2009; Fonseca, 2010; Chandrasekera, 2000).
The results shown in Figure 2 suggest that there is a general trend of increase in median values of CH4 emissions
Table 3. Results of comparisons of CH4 fluxes between the sampling campaigns conducted in Três Marias Reservoir. P-value 0.06.
Três Marias Reservoir - Kruskal-Wallis multiple comparison test
Period Difference
observed
critical
difference Result
Aug-Marc 1.288889 27.53579 No difference Aug-May 6.317829 27.85413 No difference Aug-Nov 21.425439 28.77596 No difference Mar-May 5.02894 27.85413 No difference Mar-Nov 22.714327 28.77596 No difference May-Nov 27.743268 29.08073 No difference
Figure 4. Box plot showing CO2 emissions along the sampling campaigns in the two reservoirs studied.
Table 4. Results of comparisons of CH4 fluxes among
the sampling campaigns in the Serra da Mesa Reservoir.
P-value < 0.05.
Kruskal-Wallis multiple comparison test to CH4
emission fromSerra da Mesa Reservoir
Period Difference
observed
critical
difference Result
Apr-Jan 45.507132 27.54622 There are difference Apr-Jul 52.398005 26.53021 There are difference Apr-Oct 56.525295 27.00389 There are difference Jan-Jul 6.890873 26.72540 No difference Jan-Oct 11.018162 27.19567 No difference Jul-Oct 4.127289 26.16606 No difference in both reservoirs throughout the year, recording the lowest in April and highest in October despite being in the
same hydrologic period and confirmed by the statistically significant differences in the flow of CH4. However in Três Marias Reservoir, the lowest value was recorded in March (end of the rainy season and very close to the rainy-dry
transition season) and the highest in November (beginning
of the rainy season and the end of the period of dry-rainy
transition). We suggest that this trend of emissions are
somehow related to transitional periods due to changes in the pattern of temperature and rainfall.
When we compare the CH4 emission shown in Figure 3,
considering the significance level of <0.05, we found no statistically significant difference between the two reservoirs studied (Kruskal-Wallis chi-squared = 3.8217, df = 1, p-value = 0.0509). However, this value was considered
borderline for the test, since the observed value of the test statistic is slightly smaller than the critical value and this must be exceeded to be considered a statistically
= 3.17–6) possibly due to the median values obtained in
the months of August in Três Marias Reservoir and July
in Serra da Mesa reservoir (Table 2).
Greenhouse gases fluxes from both hydroelectric reservoirs and natural lakes showed great variability in their
values. For example, Galy-Lacaux et al. (1997) measured CH4 diffusive fluxes in Petit Saut (French Guiana) that ranged from 120 to 3.230 mg.m–2.d–1; Roehm and Tremblay (2006), measured CO2 fluxes two large dams in Canada
(La Grande 2 and La Grande 3) with ranges between
80 and 1,800 mg.m–2.d–1 and 400 and 1,500 mg.m–2.d–1; Therrien et al. (2005) measured CO2 flux in Arizona – USA that ranged between –1,116 and 3,104mg.m–2.d–1 and Duchemim et al. (2001) measured CH4 fluxes in the range 12 to 65 mg.m–2.d–1 in an old reservoir in the Amazon
region, Brazil.
In the present study, the CO2 fluxes measured in January
(rainy season) and July (dry season) in Serra Mesa Reservoir
(as shown in Figure 4) proved to be indistinguishable from each other, but they are different when compared to April and October which are transition months from wet to dry and from dry to wet season, respectively. Moreover, the
CO2 emission measured in April and October also showed differences between themselves. We attribute this large
natural range of data as well as specific characteristics of
each study period, for example, by the fact that it rains more in October than in April, even though these two months are in transition periods.
Thus, we believe that this natural variability of the phenomenon of gas emissions in the air-water interface
contributes to find results that are discordant at first glance, like an apparent lack of seasonality of CH4 emission in
both reservoirs, even though they almost doubled over the
months analyzed. Also relevant was the fact that the Serra
da Mesa reservoir and the Três Marias Resevoir showed negative CO2 emissions by 3 of the 4 campaigns in Serra da Mesa and all periods in Três Marias (Table 2). This
fact is linked to the intense metabolism of CO2 convert
it to organic matter by photosynthetic organisms and
thus they influence the chemical gradient of CO2 in the air-water interface.
5. Conclusion
We concluded that the CH4 fluxes were statistically indistinguishable in all analyzed hydrological periods, although the median have increased over the periods studied in both reservoirs. However during the month
of April, which is a transition period in Serra da Mesa, fluxes were shown to be distinct from other periods
studied, suggesting that there may be some component
in this period that somehow influences the changes in
CO2 emissions standards.
Corroborating with this idea, the CO2 fluxes measured
in Serra da Mesa reservoir were distinct when comparing
the periods of transition versus rainy and dry periods.
We believe that perhaps this is due to seasonal influences
changes in rainfall and temperatures.
Finally, the hydropower reservoirs are emitters or absorbers of carbon as CO2, which may in the long term
balance the positive emissions beginning of the filling
period. We believe that further measurements in greenhouse gas emissions are needed in order to better understand the variability of emissions.
In addition, other factors must be better analyzed as the input of different carbon fractions and their concentrations
in the lake, the influence of meteorological factors, the
human interventions such as land use basin which can exert
influence and contribution with this allocthonus organic
matter on greenhouse gases emissions.
Acknowledgements
CHESF, which financed this research study through the
Project Greenhouse Gas Emission Monitoring from for Hydropower Reservoirs and the National Council for
Scientific and Technological Development (CNPq) for awarding a doctoral study grant to the first author of this paper. We thank the National Council for Scientific and Technological Development (CNPq) for the research
Table 5. Comparison of CO2 emissions among sampling
campaigns from Serra da Mesa Reservoir. p-value < 0.05.
Kruskal-Wallis multiple comparison test to
CO2 emissions from Serra da Mesa Reservoir
Period Difference
observed
critical
difference Result
Apr-Jan 28.74662 26.9345 There are differences Apr-Jul 49.26051 26.11987 There are
differences Apr-Oct 33.20765 25.29974 There are
differences Jan-Jul 20.51389 27.10752 No difference Jan-Oct 61.95427 26.31820 There are
differences Jul-Oct 82.46816 25.48378 There are
differences
Table 6. Comparison of CO2 emissions among sampling campaigns from Três Marias Reservoir. P-value < 0.05.
Kruskal-Wallis multiple comparison test to CO2
emissions from Três Marias Reservoir
Period Difference
observed
critical
difference Result
Aug-Mar 18.08718 28.63825 No difference Aug-May 34.28263 27.05063 There are
productivity grant awarded to the second author of this
paper. We thank the National Science and Technology Institute (INCT – Climate Change – Emissions from Lakes and Reservoirs Sub-Project) for awarding a grant to the fifth and sixth authors of this paper. We thank Dr. John Edmund Lewis Maddock for his important discussion
on this paper.
References
ABRIL, G., GUÉRIN, F., RICHARD, S., DELMAS, R., GALY-LACAUX, C., GOSSE, P., TREMBLAY, A., VARFALVY, L.,
SANTOS, MA. and MATVIENKO, B., 2005. Carbon dioxide and methane emissions and the carbon budget of a 10-year
old tropical reservoir (Petit Saut, French Guiana). Global
Biogeochemical Cycles, vol. 19, no. 4, p. GB4007. http://dx.doi. org/10.1029/2005GB002457.
Agência Nacional de Águas – ANA, 2013. Hidro Web Sistema de Informações hidrológicas. ANA. Available from: <http:// hidroweb.ana.gov.br/>. Access in: 4 Feb. 2013.
BARTLETT, KB. and HARRISS, RC., 1993. Review and Assessment of Methane Emissions from Wetlands. Chemosphere, vol. 26, no. 1-4, p. 261-320. http://dx.doi.org/10.1016/0045-6535(93)90427-7.
BARTLETT, KB., CRILL, PM., BONASSI, JA., RICHEY, JE. and HARRISS, RC., 1990. Methane flux from the Amazon River floodplain: emissions during the rising water. Journal of Geophysical Research, vol. 95, no. D10, p. 16773-16788. http:// dx.doi.org/10.1029/JD095iD10p16773.
BARTLETT, KB., CRILL, PM., SEBACHER, DI., HARRISS, RC., WILSON, JO. and MELACK, JM., 1988. Methane flux from the central Amazonian floodplain. Journal of Geophysical Research, vol. 93, no. D2, p. 1571-1582. http://dx.doi.org/10.1029/ JD093iD02p01571.
Brasil. Ministério de Minas e Energia – MME, 2012. Balanço Energético Nacional 2012: Ano base 2011. Rio de Janeiro: Empresa de Pesquisa Energética.
CHANDRASEKERA, CMMMK., 2000. Investigation of Hydrological Responses to Land Use Changes in Two Sub Catchments of the Upper Mahaweli Catchment. Sri Lanka: Postgraduate Institute of
Agriculture, University of Peradeniya. Unpublished M. Phil Thesis.
CICERONE, RJ. and OREMLAND, RS., 1988. Biogeochemical aspects of atmospheric methane. Global Biogeochemical Cycles, vol. 2, no. 4, p. 299-327. http://dx.doi.org/10.1029/GB002i004p00299.
COLE, JJ. and CARACO, NF., 1998. Atmospheric exchange of
carbon dioxide in a low wind oligotrophic lake measured by the addition of SF6. Limnology and Oceanography, vol. 43, no. 4, p. 647-656. http://dx.doi.org/10.4319/lo.1998.43.4.0647.
DAMAZIO, JM., SANTOS, MA., XAVIER, VL., MEDEIROS, AM., MARCELINO, AA., AMORIM, MA., BEZERRA, CS., ROGERIO, JP., SIKAR, DM., SIKAR, EM. and MATVIENKO, B., 2013. Uso da mediana para estimativa robusta de taxa de emissão difusiva de gases de efeito estufa em reservatórios a
partir de medições pontuais com câmaras flutuantes espacialmente distribuídas. In XX Simpósio Brasileiro de Recursos Hídricos,
2013. Bento Gonçalves. Bento Gonçalves: Associação Brasileira de de Recurso Hídricos.
DEL GIORGIO, PA., COLE, JJ., CARACO, NF. and PETERS,
RH., 1999. Linking planktonic biomass and metabolism to net gas fluxes in northern temperate lakes. Ecology, vol. 80, no. 4, p.
1422-1431. http://dx.doi.org/10.1890/0012-9658(1999)080[1422:LP BAMT]2.0.CO;2.
DEVOL, AH., RICHEY, JE., CLARK, WA., KING, SL. and MARTINELLI, LA., 1988. Methane emission to the troposphere from the Amazon floodplain. Journal of Geophysical Research, vol. 93, no. D2, p. 1583-1592. http://dx.doi.org/10.1029/ JD093iD02p01583.
DEVOL, AH., RICHEY, JE., FORSBERG, BR. and MARTINELLI,
LA., 1990. Seasonal dynamics in methane emissions from
the Amazon River floodplain to the troposphere. Journal of Geophysical Research, vol. 95, no. D10, p. 16417-16426. http:// dx.doi.org/10.1029/JD095iD10p16417.
DLUGOKENCKY, E. and TANS, P., 2012. Trends in Atmospheric Carbon Dioxide. Avaiable from: http://www.esrl.noaa.gov/gmd/ ccgg/trends. Access in: 25 Feb. 2013.
DUCHEMIM, E., LUCOTTE, M., CANUEL, R., QUEIROZ, AG., ALMEIDA, DC., PEREIRA, HC. and DEZINCURT, J., 2001. Comparison of greenhouse gas emissions from an old tropical reservoir with those from other reservoirs worldwide. Verhandlungen des Internationalen Verein Limnologie., vol. 27, p. 1391-1395.
DUMESTRE, JF., CASAMAYOR, EO., MASSANA, R. and
PEDRÓS-ALIÓ, C., 2002. Change in bacterial and archaeal assemblages in an equatorial river induced by the water eutrophication
of Petit Saut dam reservoir (French Guiana). Aquatic Microbial Ecology, vol. 26, p. 209-221. http://dx.doi.org/10.3354/ame026209.
DUMESTRE, JF., VAQUER, A., GOSSE, P., RICHARD, S. and LABROUE, L., 1999. Bacterial ecology of a young equatorial
hydroelectric reservoir (Petit Saut, French Guiana). Hydrobiologia, vol. 400, p. 75-83. http://dx.doi.org/10.1023/A:1003707129170.
FONSECA, GAB., 2010. Contribuição antrópica na poluição de reservatórios hidrelétricos: o caso da usina de São Simão-GO/
MG. Rio de Janeiro: Universidade Federal do Rio de Janeiro. Dissertação de Mestrado em Planejamento Energético.
GALY-LACAUX, C., DELMAS, R., JAMBERT, C., DUMESTRE, JF., LABROUE, L., RICHARD, S. and GOSSE, P., 1997. Gaseous emissions and oxygen consumption in hydroelectric dams: a case study in French Guyana. Global Biogeochemical Cycles, vol. 11, no. 4, p. 471-483. http://dx.doi.org/10.1029/97GB01625.
GUÉRIN, F., ABRIL, G., RICHARD, S., BURBAN, B., REYNOUARD, C., SEYLER, P. and DELMAS, R., 2006. Methane
and carbon dioxide emission from tropical reservoir: Significance
of downstream rivers. Geophysical Research Letters, vol. 33, no. 21, p. L21407. http://dx.doi.org/10.1029/2006GL027929.
HAMILTON, SK., SIPPE, SJ. and MELACK, JM., 1995. Oxygen depletion and carbon dioxide and methane production in waters of the Pantanal wetlands of Brazil. Biochemistry, vol. 30, no. 2, p. 115-141.
Instituto Nacional de Metereologia – INMET, 2013. Banco de dados meteorológicos para ensino e pesquisa. INMET. Avaiable
from: http://www.inmet.gov.br/portal/index.php?r=bdmep/bdmep.
Access in: 4 Feb. 2013.
Intergovernmental Panel On Climate Change – IPCC., 2007. Fourth Assessment Report: Climate Change. Cambridge: Working Group I: The Physical Science Basis.
Hydropower technologies and Programmes. Paris: International Energy Agency.
KELLY, CA., RUDD, JWM., BODALY, RA., ROULET, NP., ST.
LOUIS, VL., HEYES, A., MOORE, TR., SCHIFF, S., ARAVENA, R., SCOTT, KJ., DYCK, B., HARRIS, R., WARNER, B. and
EDWARDS, G., 1997. Increases in fluxes of greenhouse gases and methyl mercury following flooding of an experimental reservoir. Environmental Science & Technology, vol. 31, no. 5, p. 1334-1344. http://dx.doi.org/10.1021/es9604931.
ROEHM, C. and TREMBLAY, A., 2006. Role of turbines in the carbon dioxide emissions from two boreal reservoirs, Quebec, Canada. Journal of Geophysical Research, vol. 111, no. D24, p. D24101. http://dx.doi.org/10.1029/2006JD007292.
ROLAND, F., VIDAL, LO., PACHECO, FS., BARROS, NO.,
ASSIREU, A., OMETTO, JPHB., CIMBLERIS, ACP. and COLE,
JJ., 2010. Variability of carbon dioxide flux from tropical (Cerrado)
hydroelectric reservoirs. Aquatic Sciences, vol. 72, no. 3, p. 283-293. http://dx.doi.org/10.1007/s00027-010-0140-0.
ROSA, LP. SCHAEFFER, R. and SANTOS, MA., 1994. Projeto ambiental das hidrelétricas na Amazônia: emissões de metano e dioxido de carbono de hidrelétricas na Amazônia comparada às da termelétricas equivalents. Rio de Janeiro: PPE, ELETROBRAS.
Relatório 1-94.
ROSA, LP., SANTOS, MA., MATIVIENKO, B., SIKAR, E., LOURENÇO, RSM. and MENEZES, CF., 2003. Biogenic gas production from major Amazon reservoirs, Brazil. Hydrological Processes, vol. 17, no. 7, p. 1443-1450. http://dx.doi.org/10.1002/ hyp.1295.</jrn>.
RUDD, JWM., HARRIS, R., KELLY, CA. and HECKY, RE., 1993. Are hydroelectric reservoirs significant sources of greenhouse gases? Ambio, vol. 22, p. 246-248.
SANTOS, EO., SILVA, C., SANTOS, MA., MATVIENKO, B., ROCHA, CHEDA., ROSA, LP., SIKAR, E., SILVA, MB. and BENTES, AMP., 2009. The importance of land use change analysis in the greenhouse gases emissions from hydroelectric reservoirs. Verhandlungen des Internationalen Verein Limnologie, vol. 30, no. 6, p. 845-849.
SANTOS, MA., ROSA, LP., SIKAR, B., SIKAR, E. and SANTOS, EO., 2006. Gross greenhouse gas fluxes from hydro-power reservoir compared to thermo-power plants. Energy Policy, vol. 34, no. 4, p. 481-488. http://dx.doi.org/10.1016/j.enpol.2004.06.015.
SEGERS, R., 1998. Methane production and methane consumption: a review of processes underlying wetland methane
fluxes. Biogeochemistry, vol. 41, no. 1, p. 23-51. http://dx.doi. org/10.1023/A:1005929032764.
STRIEGL, RG. and MICHMERHUIZEN, CM., 1998. Hydrologic influence on methane and carbon dioxide dynamics at two north
- central Minnesota lakes. Limnology and Oceanography, vol. 43, no. 7, p. 1519-1529. http://dx.doi.org/10.4319/lo.1998.43.7.1519.
The R Foundation, 2012. R: A language and environment for statistical computing. Vienna: R Foundation for Statistical
Computing. Available from: <http://www.R-project.org/>. Access in: 13 Mar. 2013.
THERRIEN, J., TREMBLAY, A. and JACQUES, RB., 2005. CO2 emissions from semi-arid reservoirs and natural aquatic ecosystems.
In TRAMBLAY, A., VARFALVY, L. and ROEHM, C. (Eds.).
Greenhouse gas emissions: fluxes and processes, hydroelectric reservoirs and natural environments. Berlin: Springer-Verlag.
p. 233-250. http://dx.doi.org/10.1007/978-3-540-26643-3_10.
TRANVIK, LJ., DOWNING, JA., COTNER, JB., LOISELLE,
SA., STRIEGL, RG., BALLATORE, TJ., DILLON, P., FINLAY, K., FORTINO, K., KNOLL, LB., KORTELAINEN, PL., KUTSER, T., LARSEN, S., LAURION, I., LEECH, DM., MCCALLISTER,
SL., MCKNIGHT, DM., MELACK, JM., OVERHOLT, E., PORTER, JA., PRAIRIE, Y., RENWICK, WH., ROLAND, F.,
SHERMAN, BS., SCHINDLER, DW., SOBEK, S., TREMBLAY, A., VANNI, MJ., VERSCHOOR, AM., VON WACHENFELDT, E. and WEYHENMEYER, GA., 2009. Lakes and reservoirs as regulators of carbon cycling and climate. Limnology and Oceanography, vol. 54, no. 6part2, p. 2298-2314. http://dx.doi. org/10.4319/lo.2009.54.6_part_2.2298.
TREMBLAY, A., THERRIEN, J., HAMLIN, B.,WICHMANN, E. and LEDREW, LJ., 2005. GHG from boreal reservoirs and natural
aquatic ecosystems. In: TREMBLAY, A., VARFALY, L., ROEHM, C. and GARNEAU, M. (Eds). Greenhouse gas emissions: fluxes and processes, hydroelectric reservoirs and natural environments.
New York: Springer-Verlag Berlin Heidelberg. http://dx.doi. org/10.1007/978-3-540-26643-3_9.
WHITMAN, WB., BOWEN, TL. and BOONE, DR., 2006.
The methanogenic bacteria. In: DWORKIN, M., FALKOW, S., ROSENBERG, E., SCHLEIFER, KH. and STAKERBRANDT, E. (Eds). The prokaryots: an evolving electronic resource for the microbiological community. New York: Springer.