http://dx.doi.org/10.1590/S1982-21702014000100004
THE USE OF THREE-DIMENSIONAL VISUALIZATION
TOOLS TO DETECT DEFICIENCIES IN GEOMETRIC
ROADWAY DESIGNS
O uso de ferramentas de visualização tridimensionais para detectar deficiências geométricas em projetos de rodovias
AURENICE DA CRUZ FIGUEIRA1 ANA PAULA C. LAROCCA2 JOSÉ ALBERTO QUINTANILHA3
FELIPE ISSA KABBACH JR4
1,2University of São Paulo
Dept. of Transportation Engineering – São Carlos Engineering School 400 Trabalhador SãoCarlense Avenue – São Carlos – SP - Brazil
3,4University of São Paulo
Dept. of Transportation Engineering - Polytechnic School 380 Professor Luciano Gualberto Avenue - São Paulo – SP - Brazil.
[email protected]; [email protected]; [email protected]; [email protected]
ABSTRACT
creation of a video of the trajectory of the targeted road. Subsequently, the participants answered a questionnaire that aided the interpretation of the results regarding the design deficiencies in road layouts perceived from the 3D visualization of the roadways.
Keywords: Geometric Design; 3D Visualization; Highway; Video Simulation;
Drive Through.
RESUMO
A utilização de tecnologias de visualização tridimensional aplicada à área de Transportes tem contribuído não só para avaliar o impacto de um projeto de rodovia na região de seu entorno, mas também, no desenvolvimento e estudo dos elementos do próprio projeto geométrico. A pesquisa busca avaliar a eficiência de ferramentas de visualização tridimensional (3D) na detecção de deficiências de coordenação entre os alinhamentos horizontal e vertical de um projeto rodoviário. A avaliação será conduzida por meio de testes com grupos de indivíduos (estudantes do curso de Engenhara Civil – sem experiência na área de desenvolvimento de projeto geométrico de rodovias). Estes indivíduos avaliaram trechos de vias em duas situações distintas – com correta coordenação dos alinhamentos verticais e horizontais e posteriormente com distorção desta coordenação. Foi utilizado um software aplicativo na área de projeto geométrico de vias terrestre que permite criar um vídeo do drive through da via em questão. Em seguida os avaliadores responderam a um questionário que auxiliou a interpretar os resultados acerca da percepção de deficiências no traçado com a visualização 3D do projeto.
Palavras-chave: Projeto Geométrico; Visualização 3D; Rodovia; Vídeo–
Simulação; Drive Through.
1. INTRODUCTION
The use of computer imaging technologies in the field of transportation sciences has contributed not only to the three-dimensional (3D) visualization of the impact that a rural road project may cause in the surrounding region but also to the development and study of the elements of the geometric design itself, which must be suited to the topography and normative guidelines (JANIKULA & GARRICK, 2002).
required for its construction and to estimate the possible environmental impacts (MANORE, 2007; DOUG et al., 2006).
Nevertheless, almost a decade has passed since the U.S. transportation agencies first invested in the use of 3D visualization technologies in road projects, and there are still few projects, including academic projects, that effectively apply them. These technologies have continued to evolve at a considerable pace, and they can now be complemented with tools and techniques for rendering, animation and multimedia interaction in the form of immersive environments.
Roadway projects in Brazil, both public and private, are almost always conducted in three distinct stages, comprising the vertical (profile) and horizontal (layout plan) alignment projections followed by the design of the cross section, using computer programs to solve problems in two dimensions (2D). Three-dimensional visualization is especially important for cross section design because this aspect of the design provides the platform characteristics such as the lane width, shoulder, parkway and other elements that will constitute the digital model of the design.
Because road users and designers perceive 3D images when driving, it is more interesting and closer to the reality of the driver to use 3D visualization in all three of the design phases from the outset of the project (HOBSON et al., 2009; KÜHN and JHA, 2006). The compatibility of the vertical alignment with the horizontal alignment provides a sense of comfort and safety to the driver.
However, the adoption of 3D visualization tools is still lagging in Brazil because the commercial and academic application of visualization tools in projects simply for aesthetic purposes is much more common than their technical application for the conception of the geometric design. There is resistance to the use of 3D tools partly because of the need for investments in new software, which inevitably requires more powerful computers, and the subsequent need for an evaluation of the new software acquired.
2. OBJECTIVE
The main objective of the present study was to use visualization tools, such as video simulations of the driver's view of road segments, to detect deficiencies in the geometric design of roadway projects due to poor compatibility between the horizontal and vertical alignments, which can affect the stopping sight distance.
3. BACKGROUND
Geometric roadway projects are traditionally conceived in 2D, and the horizontal projection, the vertical projection and the cross section are planned in three distinct stages.
The use of parametric 2D computer programs facilitates the dynamic analysis of design alternatives by making it possible to observe the changes in the terrain as the horizontal alignment is altered. However, the coordination between alignments is generally performed based on a planimetric diagram of each tangent, which indicates the beginning and end of each curve. The horizontal alignment is compared with the vertical alignment of the design while also taking into account the volume of soil displaced.
The availability of computer programs with 3D visualization tools may contribute to the identification and elimination of poorly coordinated alignments in rural roadway designs, thus promoting the development and application of the present research.
It is expected that the results obtained will demonstrate the advantages of using 3D visualization tools. In turn, this will stimulate other research projects in Brazil and will encourage professionals in the field of transportation engineering to incorporate the use of this software in roadway projects.
4. DEFICIENCIES IN THE GEOMETRIC DESIGN OF ROADS
The conception of a road comprises a series of phases that are interrelated, beginning with the design phase and ending with the implementation of the design, accordingly with road agencies standards (DNER, 1999, AASHTO, 2003).
Currently, the majority of road project designs begin with the terrain surface, from which the designer determines the initial trajectory of the roadway, representing the first approximation of the projection of the road axis onto the horizontal plane. When the trajectory study is completed, the horizontal and vertical alignment phases are performed. After the planimetric elements of the project are defined, the geometric elements in the vertical plane are determined in the next phase. Finally, the cross section of the design is determined.
The representation of the geometric project with a set of designs—the plan, the longitudinal profile and the cross section—is normally sufficient to define the road to be built. However, this type of representation does not allow the designer to completely visualize the project.
Poor coordination between the design of the vertical and horizontal alignments affects the continuity and the sight distance, resulting in safety problems (JANIKULA & GARRICK, 2002).
4.1 Coordination of Horizontal and Vertical Alignments and Sight Distance
Driving errors usually result from errors of judgment by the driver. These errors result from superimposed horizontal and vertical alignment elements that create an inconsistency in the alignment of the road and impair the visual perception of the driver (MERTIZANIS & HATZI, 2011).
Some recommendations should be followed to avoid creating poorly coordinated alignments and to maintain consistency in the geometric patterns of roadway designs. For example, short circular curves between tangents appear as optical breaks when viewed from a long distance. Therefore, the use of long curves between tangents is recommended (SMITH & LAMM, 1994).
Typical design errors, particularly those related to safety aspects, such as dips in blind spots or curves, may be detected through perspective images and eliminated by changing elements of the horizontal or vertical alignment (KUHN, 2005). Consequently, visibility is limited by changes in the direction and slope along the course of the road, especially by horizontal curves in cut stretches and by convex vertical curves that reduce the visibility, in plan and profile, which is necessary for the driver to perceive obstacles and stop the vehicle in time.
The use of 3D models allows the designer to analyze safety issues from different perspectives than when using traditional 2D visualization, including the perspective of the end user, i.e., a driver, cyclist or pedestrian. Among the advantages of 3D visualization is the enhanced capability for the analysis of the linear or point-to-point stopping distance visibility, the overtaking distance, intersections and directional decision making (TAYLOR and MOLER, 2010).
5. VISUALIZATION AS A TOOL IN GEOMETRIC ROADWAY DESIGN
Visualization is a simulated representation of proposed transportation improvements and their impacts on the surroundings in a manner that is sufficient to convey to the layperson the full scope of improvements (AASHTO, 2003; NCHRP, 2006). This definition has also been applied to the term project visualization (PV) used by the Federal Lands Highway Division (FLH) of the U.S.
Several authors emphasize the importance of evaluating the geometric project from the point of view of the driver (HAN et al., 2005; KÜHN & JAH, 2006; KUHN & HENDRICK, 2010; WINNER et al., 2012) to aid in the detection of flaws or inconsistencies in the project by the designer (VAN DER HORST & HOGEMA, 2011). Using a 3D model can also improve the process of creating an optimized design according to geometric criteria, from the design conception to the safety check (KUHN et al., 2011; NGUYEN et al., 2011).
6. MATERIALS AND TESTING METHODOLOGY
The testing methodology included the 3D visualization of stretches of the geometric design of a roadway developed with appropriate software, the video simulation of a drive-through of the roadway, questionnaires, the tabulation of data in an Excel spreadsheet and the statistical analysis of results.
6.1 Materials
The participants were tested at the Transport Information Technology Laboratory of the Department of Transport of the Polytechnic Institute of USP (Escola Politécnica da Universidade de São Paulo – USP). This laboratory currently has 20 desktop computers, each with a Core 2 Duo processor, 4 GB RAM, 320 GB hard drive, NVidia video driver, Windows XP operating system, LCD monitor, keyboard and mouse.
The tests were created using an application program for geometric roadway design with a 3D visualization tool. The CLIP program was provided free of charge for use in the study. This software had a 3D module with which it was possible to conduct a drive-through of the projected road.
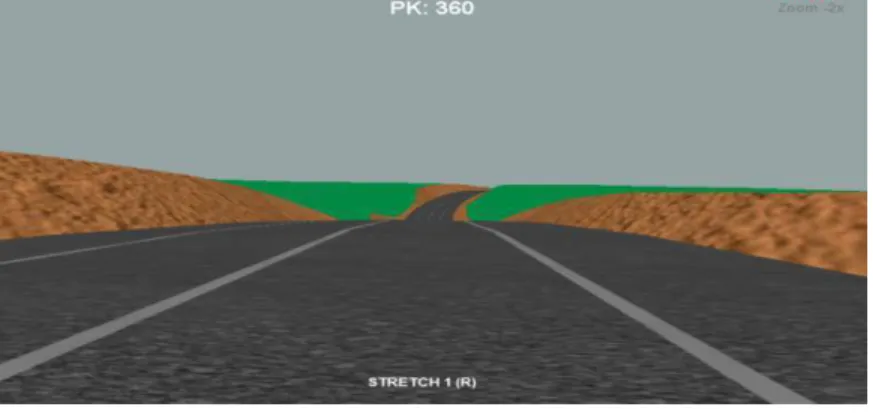
There were six videos developed, each displaying a drive-through of a different road stretch, with an average of 2 minutes view at a constant speed of 60km/h. Road stretches A, B and C were unflawed and demonstrated good compatibility between the horizontal and vertical alignments. Road stretches 1, 2 and 3 had deliberate distortions inserted into them, thus creating flaws in the coordination between the horizontal and vertical alignments and reducing the visible distance.
In the vertical alignment of stretch 1 was inserted a sequence of concave and convex curves preceding the horizontal curve, giving a feeling of jumping in the stretch because of the oscillations in the stretch, complicating the driver’s evaluation of the segment ahead. The composition of part 1 can be seen in Figure 1.
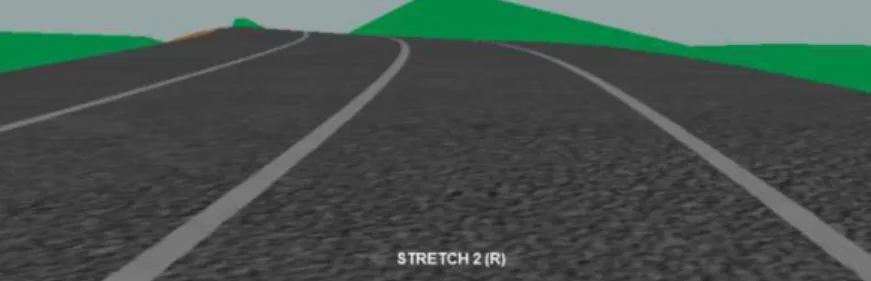
The vertical alignment of stretch 2 followed the terrain elevations, creating points of visual concealment in the stretch, giving an impression of diving ahead. The display of stretch 1 can be seen in Figure 2.
Figure 2 – Dip flaw introduced in road stretch 2.
In stretch 3 the visibility of the stretch in the left horizontal curve is reduced because of the cut slope, which hides the cars in the opposite direction. Dangerous situation when overtaking maneuvers are made.
The assessment questionnaire was developed with objective questions and was divided into two parts. The first part consisted of questions related to the participant, to identify factors that might influence the assessment. In the second part, the participant analyzed the road stretch they had viewed.
6.2 Methodology
After the definition of the geometric elements and the specification of parameters such as color, texture and trajectory data, a 3D view was created that allowed a stretch of the road to be traversed from the viewpoint of the driver. The resulting drive-through of the stretch was exported to a multimedia file in the audio-video interleave (AVI) format. The files for each stretch were inserted into an interface developed in PowerPoint to facilitate conducting the tests and to direct the participant to the videos to be evaluated.
consisted of 98 students who had completed the full course workload, including both theoretical and practical activities, at the time that the tests were conducted. These students had also covered the topic of the coordination of horizontal and vertical alignments in the class.
The participants were divided randomly into nine groups, with each group viewing one of the nine possible pairings of the unflawed and flawed road stretches. The stretch pair viewed by each group was allocated randomly.
After watching the two videos, the individual marks in the questionnaire if the stretch evaluated presents problems or not, regarding the coordination between horizontal and vertical alignments or visibility distance.
The tests were conducted simultaneously by two groups arranged in alternating rows so that participants were not influenced by the participant to their side. Although a time limit of 10 minutes was imposed, the participants required only an average of four minutes to assess the road stretches, indicating that most of the participants only watched the video of each road stretch once.
7. STATISTICAL ANALYSIS AND RESULTS
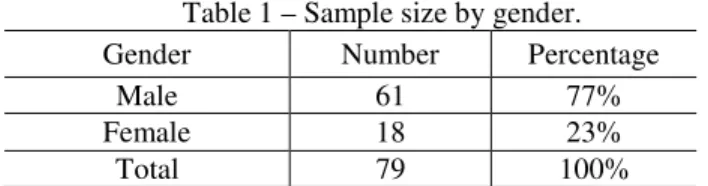
The sample is composed of 82 individuals, 62 men and 20 women. As all of them have a similar age, this information was not relevant in this assessment.
The completed tests that were relevant for the study were determined, and only three questionnaires were discarded because they were incomplete, corresponding to 3.7% of the sample and therefore not affecting the final analysis of the study,
Table 1 – Sample size by gender.
Gender Number Percentage
Male 61 77%
Female 18 23%
Total 79 100%
The questionnaire data were tabulated in an Excel spreadsheet, and the following hypotheses were tested.
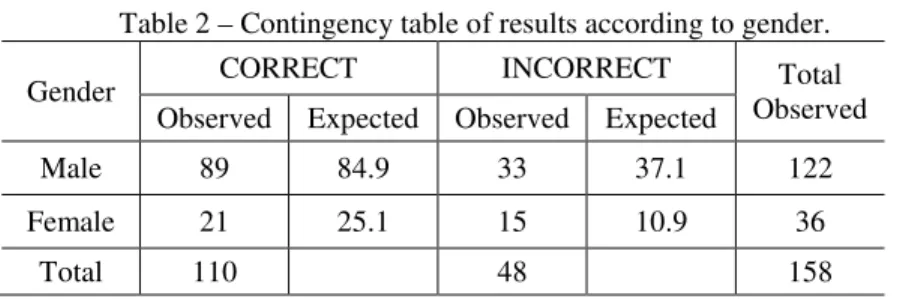
To test the hypotheses, it was necessary to analyze the independence of the results obtained for the different variables by comparing the observed and expected frequencies. The Chi-Squared Test of independence was used with a 95% confidence interval (α = 5%), and in the case of frequencies that were equal to zero, Fisher’s Exact Test was used.
The value of the χ2 (calculated) statistic for the data in Table 2 is 2.81, and the critical value for α = 5% with one degree of freedom is χ2(critical)= 3.84. Because χ2(calculated) is lower than χ2(critical), null hypothesis 1 is supported, and it is concluded that gender did not influence the results obtained in the assessment of road stretches. This result may be related to the fact that women evaluated belong to a specific group - engineering students.
Table 2 – Contingency table of results according to gender.
Gender CORRECT INCORRECT Observed Total Observed Expected Observed Expected
Male 89 84.9 33 37.1 122
Female 21 25.1 15 10.9 36
Total 110 48 158
Information was collected from the participants to determine the influence of certain forms of experience on the results of the assessment. However, according to the data shown in Table 3, there were no significant differences between participants in the sample for most variables. The only exception was the driving frequency variable, with 76% of the total sample claiming to drive often.
Table 3 – Information on the participants. Information on the Participants Yes % No % Visualization Experience 75 95% 4 5%
Driver 69 87% 10 13%
Drives Often 60 76% 19 24%
Knowledge on Horizontal and
Vertical Alignment Coordination 70 89% 9 11% Knowledge on Visible Distance 77 97% 2 3%
In a quantitative analysis of the unflawed road stretches, stretch A had the most correct identifications. Among the flawed stretches, stretch 3 had the most correct identifications. Regarding the stretches with the most incorrect identifications, stretch C had the highest number among the unflawed road stretches, and stretch 2 had the most incorrect identifications among the flawed stretches (Figure 3).
Figure 3 – Test results according to stretch.
To test null hypothesis 3, it was necessary to analyze the dependence between the correct and incorrect identifications only of the unflawed road stretches. The value of χ2(calculated) is 7.10. However, although the sample size was greater than 40, one of the results had a value lower than 5; therefore, the Yates correction was used, resulting in a χ2(calculated) of 5.62. The critical value for α = 5% with two degrees of freedom is χ2(critical)= 5.99. Although the fact that χ2(calculated) is greater than χ2(critical) should lead to the rejection of null hypothesis 3 and the conclusion that there is no dependence between the rate of correct and incorrect identifications of the unflawed road stretches, the value of χ2(calculated) is very close to the critical value. Therefore, it is preferable not to affirm that there is independence between the identifications of the unflawed stretches.
independence between the correct and incorrect identifications of the flawed road stretches.
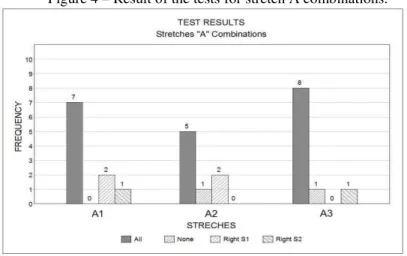
The next analysis aimed to confirm the combinations of stretches assessed by the participants. The results are shown in Figures 4, 5 and 6, which illustrate the performance of the groups.
Figure 4 – Result of the tests for stretch A combinations.
In a quantitative analysis of the combinations formed with road stretch A, considering the number of correct and incorrect identifications, the combination of stretches A and 3 produced the best results.
Of the stretch B combinations, the combination of stretches B and 3 produced the highest number of correct assessments and the lowest number of incorrect assessments.
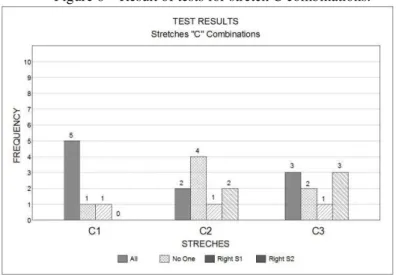
Figure 6 – Result of tests for stretch C combinations.
In the analysis of combinations with stretch C, the combination producing the best performance was stretches C and 1, with more correct identifications and fewer errors during the assessment.
Given these results, the next hypotheses aimed to analyze the possible dependence between the combinations and the results obtained.
To test null hypothesis 5, the results in which the participants accurately identified the unflawed and flawed stretches were analyzed - correctly indicating the two results.
The value of χ2(calculated) is 1.57, and the critical value for α = 5% with four degrees of freedom is χ2(critical)= 9.49. Therefore, null hypothesis 5 is supported, and it is concluded that there is no dependence between the correct identifications and the combinations tested.
The test of null hypothesis 7 consists in the dependence analysis of results, in which the participants correctly assessed only the unflawed stretches (A, B, C) and incorrectly assessed the flawed stretches (1, 2, 3). A P(calculated) of 8.57% was obtained. Because this value is greater than α = 5%, null hypothesis 7 is rejected, and there is no dependence between the results and the combinations. However, the sample evaluated is very small, and therefore, it is not substantial enough to affirm the independence between the combinations of the stretches evaluated.
Regarding null hypothesis 8, it is investigated the dependence between the results of the participants who incorrectly assessed the unflawed stretches (A, B, C) and correctly assessed the flawed stretches (1, 2, 3). The value obtained for P(calculated) is 4.76%, and because this value is smaller than α = 5%, the hypothesis of independence is rejected in this case. However, the difference between the calculated probability and the critical probability is very small. When a quantitative analysis is conducted, it is possible to see that in this combination of results, stretch C yielded the most incorrect assessments and stretch 3 yielded the most correct assessments.
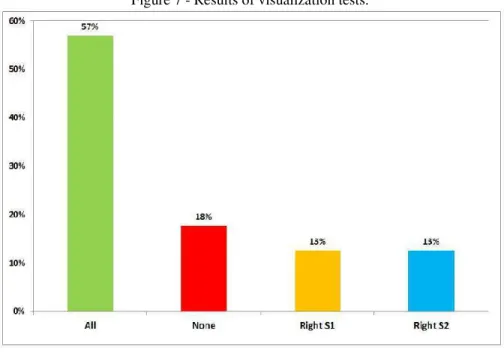
A general analysis of the results showed that 57% (45 participants) correctly assessed the two stretches, indicating good performance in the visualization tests, as shown in Figure 7.
8. CONCLUSIONS
Traditionally, transportation planning projects, from their conception to improvement projects, were designed in 2D. Today, there are technologies that allow for transportation planners to create realistic, and even interactive, visualizations, facilitating the decision-making process and making it possible to display preliminary designs to the public.
To avoid potential geometric design errors caused by the independent processing and superposition of plans, visualization tools enabling perspective or drive-through views can be used to analyze the resulting combination of these design elements, as well as better solutions to problems that cannot be measured bi-dimensionally, as is the case of cut slopes that impair the visibility distance but that can be detected by a three-dimensional visualization
In general, the research demonstrated the satisfactory detection of geometrical design deficiencies using visualization tools, given that 57% of the participants correctly evaluated both unflawed and flawed road stretches, even when they did not have access to any other information about the design being evaluated. It is considered that the number of correct answers could be higher if there was more commitment from the evaluators (students).
It is presumed that the availability of other information that would complement the analysis, used in the same way as in the actual design process, would contribute to better results in the visualization tests, being necessary to conduct further tests with a comparison between the 2D and 3D visualization.
The traditional approach currently used in the teaching of engineering in Brazil does not correspond to accurately representing reality, and more contemporary and contextualized approaches are necessary to meet the needs of the present. Without intending to disparage the teaching of geometric design with a 2D approach, it is believed that the implementation of 3D tools may significantly contribute to the learning and retention of the content reviewed, aiding the student in developing the skills of spatial visualization within the field of geometric design.
With the availability of software and appropriate technologies, it is expected that visualization will be more frequently incorporated not only in the public participation stage but in all stages of the project and in government agencies in Brazil, as has been done in the departments of transportation of other countries with successful case studies (NCHRP, 2006; DTMR, 2010).
Finally, the lessons learned during the development of the present study will be valuable for the future development of visualization applications in several fields of transportation science.
ACKNOWLEDGMENTS
through the UNIVERSAL 2010/470075/2010-4 and the Research Productivity Grant (PQ 300446/2010-1); VETEC Engenharia Ltda; Doctor Professor Linda Lee Ho; ARTERIS-BRASIL and National Agency of Land Transportation (Agência Nacional de Transportes Terrestre - ANTT).
REFERENCES
AASHTO. American Association of State Highway and Transportation Officials. A Policy on Geometric Design of Highways and Streets. Washington, D.C. 2003. DNER. Departamento Nacional de Estradas de Rodagem, Diretoria de
Desenvolvimento Tecnológico. Manual para Projeto Geométrico de Rodovias Rurais. Rio de Janeiro, 1999, 228 p.
DOUG, E., D., GILSON, K., BRINCKERHOFF, P. Advanced 3D/4D Modeling and Real-time Visualization in Transportation. 5th International Visualization
in Transportation Symposium and Workshop. 23-26 October, Denver,
Colorado, EUA. 2006
DTMR. Department of Transport and Main Roads. Drafting and Design Presentation Standards Manual – A Guide to the Standards for Presentation of Road Infrastructure Projects covering the full preconstruction and construction delivery process. Engineering & Technology Group. Brisbane, Australia. 3rd Edition, January 2010.
HAN, K; MIDDLETON, D.; MUZYCZKA, W. J.; MINTY, S.; CLAYTON, A. Developing Virtual Reality Visualizations to Support Highway Geometric Design. 3rd International Symposium on Highway Geometric Design, June 29–July 1, 2005.
HOBSON, A.; SPARROW, M.; SHANNON, T.; BROWN, P. Choosing the Right Visual Products. PbNetwork. Vol. 70, Novembro 2009. http://www. pbworld.com/.
JANIKULA, T; GARRICK, N. W. Three-Dimensional Visualization Approach to Illustration Esthetic Concepts for Highway Design. Transportation Research Record: Journal of the Transportation Research Board. Volume 1796. Pag 35-40. 2002.
KUHN, W.; HENDRICK, V. The new design work – place for the geometric design engineer. 4th International Symposium on Highway geometric design. June 2, 2010. Valencia, Espanha.
KÜHN, W.; JHA, M. K. Using Visualization for the Design Process of Rural Roads. 5th International Visualization in Transportation Symposium and Workshop. October 23-26, 2006, Denver, Colorado. 10p.
KÜHN, W.; VOLKER, H.; KUBIK, R. Workplace Simulator for Geometric Design of Rural Roads. Transportation Research Board, No. 2241, Transportation Research Board of the National Academies, Washington, D.C., 2011, pp. 109– 117.
MERTZANIS, F. S.; HATZI, V. J. Model for sight distance calculation and three-dimensional alignment evaluation in divided and undivided highway. 3rd International Conference on Road Safety and Simulation. Indianapolis. USA. September, 2011.
NCHRP. Visualization for Project Development. A synthesis of Highway Practice. Transportation Research Record. Synthesis 361. 2006
NGUYEN, T.; MONDRAGON, F.; O'BRIEN, W.J; JACKSON, K.; ISSA, R. R. A.; ROJAS, E. M. Student Background and Implications for Design of Technology Enhanced Instruction. Journal of Computing in Civil Engineering. American Society of Civil Engineers. 2011.
SMITH, B. L.; LAMM, R. (1994). Coordination of Horizontal and Vertical Alinement with Regard to Highway Esthetics. Transportation Research Record. 1445.
TAYLOR, M.; MOLER, S. Visualization's Next Frontier. Public Roads. Federal Highway Administration, vol. 73, no. 4, Jan./Feb. 2010.
VAN DER HORST, A. R. A.; HOGEMA, J. H. Driving Simulator Research on Safe Highway Design and Operation. Transportation Research Board, No. 2248, Transportation Research Board of the National Academies, Washington, D.C., 2011, pp. 87–95
WINNER, B. H.;ANCOCHEA, M.; GRAUPNER, M. Motion Analysis of a Wheeled Mobile Driving Simulator for Urban Traffic Situations. Proceedings of The Driving Simulation Conference Europe 2012. Arts et Métiers Paris Tech, Paris, France. 2012.
ZIMMERMANN, M.; ROOS, R. Quantitative methods for evaluation of spatial alignment of roads. Publications of the Institute of Highway and Railroad Engineering, Universität Karlsruhe (TH). Vol. 51. Karlsruhe, Alemanha. 2001.