Brazilian Journal of Physics, vol. 35, no. 3B, September, 2005 771
Evaluation of the Divergence of a Thermal Neutron
Beam using a Position Sensitive Detector
Gevaldo L. de Almeida, Maria Ines Silvani, Rosanne C. A. A. Furieri,
Instituto de Engenharia Nuclear - CNEN, C.P. 68550, Ilha do Fund˜ao, 21945-970, Rio de Janeiro, RJ, Brazil
Marcelo J. Gonc¸alves, and Ricardo Tadeu Lopes
Universidade Federal do Rio de Janeiro - COPPE, Bloco 6, 21945-970, Rio de Janeiro, RJ, Brazil
Received on 6 July, 2005
The divergence of the thermal neutron beam available at the main outlet channel of the Argonauta Reactor in the Instituto de Engenharia Nuclear has been measured by using a Position Sensitive Detector. The measurement process addressing a proper beam characterization has been conducted under several geometric arrangements, including attempts to reduce the beam divergence by using a honeycomb-type gadolinium collimator. Since the detector presents finite resolution, each measured position spectrum is a convolution of the true Rocking Curve expressing the beam divergence with the function that describes the detector response. Therefore, those spectra have been submitted to an unfolding process to recover the concealed Rocking Curve. Prior to undertake this task however, the detector Line Spread Function - LSF was determined as required by the unfolding process. This was done by taking the response of the detector to a line source simulated by a narrow slit-collimator placed at several distances from the detector window. After a Lorentzian fitting to the acquired position spectra, the related FWHM were plotted against the source-detector distance. An extrapolation to zero furnishes then the width of the unknown LSF expressed as a normalized Lorentz function, which was then incorporated to a computer program developed to perform the unfolding. The final Rocking Curve emerges then as a normalized Lorentzian function properly defined by its width and a zero offset, showing that the beam diverges about 2.2 cm in 1 meter. The honeycomb collimator could not reduce this divergence due to its low aspect ratio.
I. INTRODUCTION
A full characterization of a neutron field requires the kno-wledge of several parameters such as its energy spectrum fur-nishing the contribution of thermal and epithermal neutrons, the neutron-to-gamma ratio, the beam intensity and its diver-gence expressed as its related Rocking Curve. All these pa-rameters depend upon the specific arrangement used to mo-derate and collimate the neutron beam. The knowledge of the beam divergence is specially important whenever the di-rection of the incoming neutron plays a significant role in an experiment or measurement process, as in the Computer Assisted Tomography - CAT for instance, a growing field of non-destructive analysis in science and engineering where the image-reconstructing algorithms need this information to per-form their tasks properly. Recent works [1-5] concerning the development and application of a Position Sensitive Detector - PSD to thermal neutron tomographic systems stimulated a work [6] which has shown the need to determine the diver-gence of the neutron beam and the viability to accomplish this task by using that kind of detector.
II. FUNDAMENTALS
While a non-divergent beam would cast a point-like sha-dow on a 2D-detector, a divergent one would draw a blurred spot with a higher density occurring at its center. An ideal de-tector would response to this neutron distribution with fidelity reproducing the very same pattern. A cross-section of the spa-tial distribution yields the Rocking Curve, henceforth in this
work called RC for short.
For the particular case when the RC is independent from the spatial orientation, or when it is only needed for a specific one, then an 1D-PSD with its axis aimed at the desired direction and a slit collimator simulating a line source placed at a given distance from the detector and perpendicular to its axis could be used to assess the RC.
An infinitely narrow slit-collimator would be required to si-mulate a line source, but since this is unfeasible, in practice a certain finite aperture should be allowed. Under such a cons-traint, the single true RCs produced by the infinity number of imaginary line sources constituting the slit would convo-lute with each other to yield a curve broader than the true RC. Utilizing however a large detector-to-collimator distance this undesirable effect can be minimized to an acceptable level.
Besides this interference, the detector itself will spoil that RC through the convolution with its own Line Spread Function-LSF broadening the RC even more. This is a ma-jor problem specially for a low divergence beam, as it would preclude a direct determination of the RC.
This difficulty could be mitigated by placing the detector very far away from the collimator but practical limits would soon emerge as low counting statistics and detector length li-mitations. Indeed the detector should be long enough to con-tain a substantial portion of the RC, which would grow with the distance.
772 Gevaldo L. de Almeida et al.
III. EXPERIMENTAL
The experimental arrangement used to carry out the me-asurements to determine the LSF and the convoluted RC is shown in Fig.1. Further details concerning the PSD, its basic structure, operational principles and the associated ancillary electronics can be found elsewhere [1-4].
FIG. 1: Experimental arrangement used to determine the LSF and the RC. The beam divergence behavior for a given spatial direction is expressed by its Rocking Curve.
The neutrons emerging from the core of the Argonauta Reactor at the Instituto de Engenharia Nuclear are collima-ted with graphite blocks inside that channel. A 25 mm-deep honeycomb-type gadolinium collimator has been used as an attempt to improve the beam parallelism. Since the side of the hexagon cell is 2 mm -long, the collimator aspect ratio corresponds to an angle within the range 8-9 degrees.
The cadmium slit collimator simulates a line source emit-ting thermal neutrons. The beam divergence is exaggerated for illustration purposes only. Actually, it diverges only about 2.2 cm in 1 meter. The honeycomb collimator didn’t change significantly this figure, for its aspect ratio was not tight enough for this divergence magnitude.
Determination of the Line Spread Function
The response of a PSD to a parallel infinitely narrow beam hitting it at a plane perpendicular to its axis is a somewhat blurred image instead of a sharp line. A plot of the apparent beam intensity hitting the detector along its axis constitutes the Line Spread Function-LSF [7].
There is thus a major difficulty to obtain the LSF: the pro-duction a parallel beam which additionally should be infini-tely narrow. The first requirement can be reasonable fulfilled by using a high aspect ratio collimator or through the extrapo-lation procedure used in this work as follows.
In order to eliminate the impact of the unknown beam di-vergence, the detector-collimator gap should be zeroed. This zero-gap however cannot be reached due to the physical di-mension of the detector itself. Indeed, the events registered by the detector occurs somewhere within the volume of its ionization chamber. Besides that, the thickness of the
de-tector window adds an extra distance between the site where the events occurs and the slit collimator. Therefore, there is always a non-zero unknown gap allowing the divergence to play its unavoidable and undesirable role.
Assuming that the average event takes place at the middle of the ionization chamber, i.e., in the neighborhood of the anode wire it is reasonable to extrapolate the straight line expressing the apparent FWHM of the LSF versus distance to the anode to get the FWHM there. This value would not be affected by the beam divergence except that associated to the distance between the detector front face - where the collimator is pla-ced - and the anode wire.
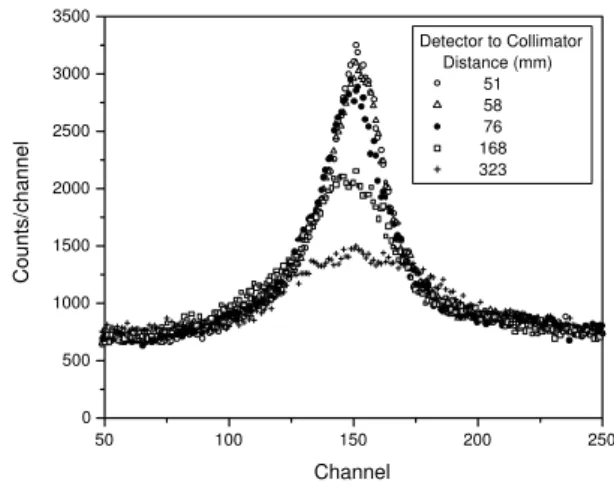
To carry out the above mentioned extrapolation, several spectra have been taken under different detector-to-collimator distances as shown in Fig.2.
50 100 150 200 250
0 500 1000 1500 2000 2500 3000 3500
Counts/channel
Channel
Detector to Collimator Distance (mm)
51 58 76 168 323
FIG. 2: Position spectra for several Detector-Collimator distances. The 51 mm distance corresponds to the collimator placed directly on the detector window, assuming that the effective detector position corresponds to that of its anode wire.
After a Lorentzian fitting, the width w for those spectra were plotted against that distance as shown in Fig.3. The in-tercept of a straight line fit with the vertical line at x=0 - where the anode is located - as zoomed in the Fig. 4, furnishes the width of the Lorentzian expressing the detector LSF. The per-formed extrapolation solely corrects the influence of the beam divergence. The obtained Lorentzian still exhibits a FWHM, ws, which is larger than the valuew0produced by an infinitely
narrow beam. Since the widthwcof the slit is known, one can
recoverw0, as follows:
w0=|
(w2
s−w2c)| (1)
and the normalized Lorentzian with a zero offset is written as:
y= y0
4(x−x0)2+w02
(2)
wherex0is the central channel determined by the non-linear
Brazilian Journal of Physics, vol. 35, no. 3B, September, 2005 773
It is worthwhile to stress that the real LSF profile remains unknown, for rigorously no experimental data is available for x=0. Nevertheless, a Lorentzian function is a fair good approximation. Gaussians functions have been as well tested, but the chi-square and correlation were worst.
FIG. 3: The FWHM growth with the collimator-detector gap indica-tes a divergent beam. The zero-gap furnishes a LSF width of 1.69 mm after the straight line fit.
FIG. 4: Zoom of Fig.3 in the detector neighborhood, exhibiting its cross-section. The LSF width is determined assuming that the ave-rage ionization occurs at the anode.
Determination of the Convoluted Rocking Curve
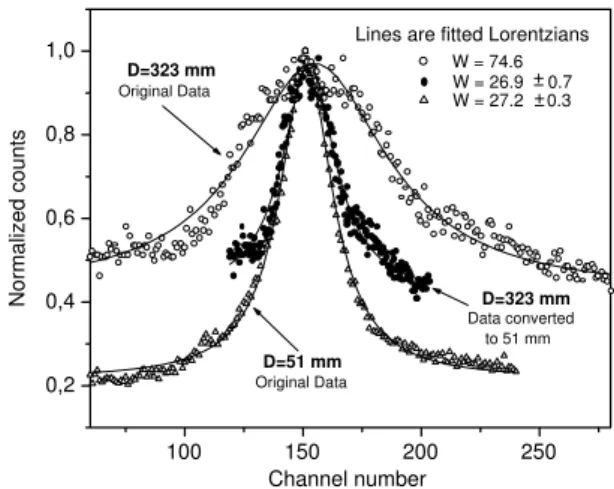
All the spectra shown in Fig. 2 are convoluted RCs. The growth of the spectra width with the detector-collimator gap is a pure geometric effect caused by the beam divergence. When converted to the same gap they exhibit the same width as shown in Fig. 5, where they were normalized to make the
comparison easier.
100 150 200 250
0,2 0,4 0,6 0,8
1,0 Lines are fitted Lorentzians
0.3 0.7
± ±
W = 74.6
W = 27.2 W = 26.9
Original Data Original Data
Data converted to 51 mm
D=323 mm
D=51 mm D=323 mm
Normalized counts
Channel number
FIG. 5: Normalized position spectra for two different detector-collimator gaps confirms a beam divergence. The width of both spectra coincide when converted to the same gap, showing the pure geometric character of the observed broadening.
The larger offset yielded by the larger gap is caused by the normalization process. The unfolding in the next section will be performed by using both the LSF and the convoluted RC with a zero-offset.
IV. MATHEMATICAL UNFOLDING
A single point of the Rocking Curve at a given position can be regarded as a very sharp peak reminding a Dirac function having however a finite amplitude. Due to their finite resolu-tion, no detector can reproduce such a sudden event, which is degraded into a bell-shaped curve resembling a Gaussian or Lorentzian with an area equivalent to that original amplitude. All the other points of the original spectrum have as well their own spoiled curves with their tails invading all the spectrum and contributing to the final amplitude of every single point. This convolution is mathematically expressed as:
C=A.Y (3)
where:
C = Convoluted RC vector (experimentally acquired). A = Matrix of the coefficients for the linear system.
Y = Unfolded RC vector (unknown).
The matrix elements for a convolution involving two nor-malized Lorentzian functions, both having a zero offset, are readily deduced as:
aij= 2.w
1+Int(2−j).{[4(i−j)
2+w2]−1+ [
4(i+j)2+w2]−1}
774 Gevaldo L. de Almeida et al.
where:
i, j= 0, 1, 2, 3,...m.
m+1 = Number of channels in the spectrum. w= Detector resolution in channels (LSF width). Int= Integer part.
It is easily figured out that the better the detector resolution, the closer the convoluted and unfolded curves would stay from each other.
V. RESULTS AND CONCLUSIONS
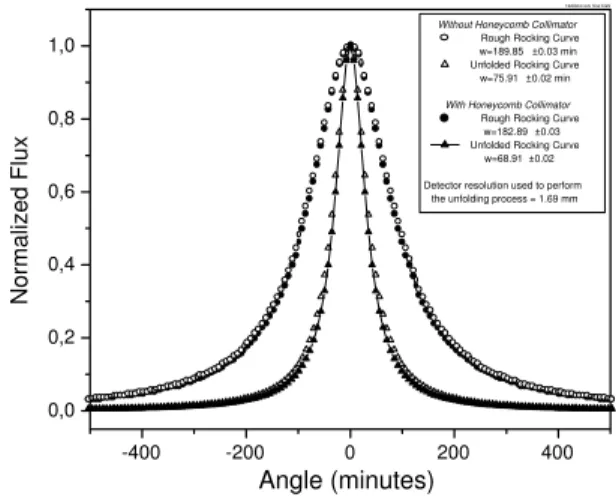
The unfolded RCs determined with and without the honey-comb collimator are shown in Fig. 6, where the original con-voluted RCs (Lorentzian fittings to the experimental data) are as well presented for comparison. After the unfolding, the horizontal scale originally expressed in channels, was trans-formed into angles by using the spectrum gain (channel/mm) and the detector-collimator gap used to acquire the position spectrum. One can observe that the impact of the collimator on the RC is very slight. This happens because its aspect ratio corresponds to an angle in the range 8-9o, while the RC has a
FWHM of 1o16’, i.e., the beam diverges roughly 2.2 cm in 1 m. These figures refer to a divergence in the horizontal plan.
For other plans a somewhat different profile cannot be ruled out since the reactor channel has a rectangular cross-section.
-400 -200 0 200 400 0,0
0,2 0,4 0,6 0,8 1,0
12AG04 rock final C&S
Without Honeycomb Collimator
Rough Rocking Curve w=189.85 ±0.03 min Unfolded Rocking Curve w=75.91 ±0.02 min
With Honeycomb Collimator
Rough Rocking Curve w=182.89 ±0.03 Unfolded Rocking Curve
w=68.91 ±0.02 Detector resolution used to perform
the unfolding process = 1.69 mm
Normalized Flux
Angle (minutes)
FIG. 6: Convoluted and unfolded RCs acquired with and without a honeycomb collimator. The beam divergence expressed by its RC has a FWHM of 1o16’.
[1] M. I. Silvani, Computed Tomography with thermal neutrons and a Position Sensitive Detector, DSc. Thesis, COPPE/UFRJ-Brazil(2001).In Portuguese.
[2] M. I. Silvani, R. T. Lopes, E. F. Jesus, G. L. de Almeida, and A. F. Barbosa, Nucl. Instr. Meth. in Phys. Research A505, 568 (2003).
[3] M. I. Silvani, G. L. de Almeida, R. C. A. A. Furieri, R. T. Lopes, E. O. de Jesus, and A. F. Barbosa, Braz. J. Phys.33, 286 (2003). [4] M. I. Silvani, R. T. Lopes, E. F. Jesus, G. L. de Almeida, A. F. Barbosa, and D. Braz, Conversion of a X-ray Position Sensitive Detector for use in Thermal Neutron Tomographic Systems, V
International Topical Meeting on Industrial Radiation and Radi-oisotope Measurement Applications, Bologna, Italy (2002). [5] M. J. Gonc¸alves, R. T. Lopes, M. I. Silvani, G. L. Almeida, and
R. Furieri, Braz. J. Phys.34, 756 (2004).
[6] G. L. de Almeida, M. I. Silvani, R. C. A. A. Furieri, R. T. Lopes, and M. J. Gonc¸alves, Braz. J. Phys.34, 767 (2004).