434 QUÍMICA NOVA, 21(4) (1998) X-RAY FLUORESCENCE DETERMINATION OF ADSORBED COPPER ON ACTIVATED CHARCOAL AFTER GLYCERIN COMPLEXATION
Maria Izabel Maretti Silveira Bueno e Lêda Cristina do Amaral
Departamento de Química Analítica - Instituto de Química - Universidade Estadual de Campinas - CP 6154 - 13083-970 - Campinas - SP
Recebido em 23/6/97; aceito em 6/11/97
X-This work shows an alternative method to copper determination by X-Ray Fluorescence (XRF). Since copper concentration in natural waters is not enough to reach XRF detection limit, a liquid-solid preconcentration procedure was proposed. Glycerin was used to complex the metal increas-ing its adsorption on activated charcoal. The solid phase was used to XRF determination. Several parameters were evaluated, such as, the complexation pH, the charcoal adsorption limit and the glycerin concentration. The interferences are lead and bismuth and the sensitivities decreased in the order Cu2+, Bi3+ and Pb2+. The advantages of the method are its simplicity, low cost and low spectral interference.
Keywords: X-ray fluorescence; liquid-solid extraction; glycerin complexation and charcoal adsorption. ARTIGO
INTRODUCTION
X-rays are defined as short-wavelength (0.1 to 25 Å) electromagnetic radiation produced by the deceleration of high energy electrons or by electronic transitions involving electrons in the inner orbitals of atoms. X-rays so produced may be useful to identify elements if their energies are measured, that is, they are element characteristics. The derived analytical technique is the so called X-ray Spectrometry (1).
Energy Dispersive X-Ray Spectrometry (EDXRF) is an analytical branch that differs from the more traditional one, Wavelength Dispersive (WDXRF), in some aspects, such as, the EDXRF detector (a solid phase one), its optical geometry and optical apparatus and the analytical time spent to have a spectrum. Whereas WDXRF is a sequential spectrometry, EDXRF is a simultaneous one. In EDXRF, characteristic X-ray emission results from the excitation of elements in the specimen using primary radiation from ray tubes, or X-ray emitted radioisotope sources. X-X-rays emitted from elements in the specimen are absorved by a solid-state detector that re-solves energies of X-ray photons with suficient precision to provide a spectral distribution of intensities versus energy. Computer-based multichannel analyzers are then used to acquire and display spectra and to perform data analysis. The method is generally applicable to the determination of elements of atomic number equal or greater than 11 (Na). Thin solid samples are ideal for analysis, but bulk solid and liquid specimens can be analysed as well. Detection limits in bulk material are typically a few parts per million, but obtaining these results depends on such factors as the element under analysis and the composition of the matrix (2).
Copper is considered an essential element to human being, performing an important role in the hemoglobin synthesis as well as in the tissue’s development. Its deficiency may lead to weight loosing, anemia and bad bone formation. The excessive uptake of copper may cause its accumulation in liver and, at long term, in brain and kidney, causing anemia, hepatic and renal problems. Copper and its compounds are used in the production of electrical equipments, of enamel and dyes, of thermal conduction equipments and of pesticides and fungicides (3,4).
This work uses the EDXRF advantages in the determination of copper concentration in water. Its direct natural water determination is not possible since EDXRF detection limit is
not low enough, and so a preconcentration step has to be performed. Whereas other analytical methods require the samples in liquid phase (1), as Atomic Absorption Spectrosco-py (AAS) and Inductively Coupled Plasma (ICP), EDXRF may have solid samples. This feature makes EDXRF one of the few analytical techniques that permits a liquid-solid preconcentrati-on step to be dpreconcentrati-one with no further dissolutipreconcentrati-on step of the solid phase (5).
Activated charcoal was chosen as the solid phase and glycerin, a very popular and low cost substance, was used as the metal complexant to be adsorbed on the charcoal. The final procedure is very simple, fast and showed appreciable copper concentration rate when compared to direct water analysis.
EXPERIMENTAL
Preconcentration procedure
All reagents were of analytical grade. The 1,468 mg.L-1
copper stock solution was prepared by dissolution of CuSO4.5H2O in water and it was standardized by iodometry. A
44.04 mg.mL-1 copper solution was prepared daily to perform
the experimental parameters optimization.
The preconcentration step consisted of adding ten drops of glycerin:water, 1:1 solution, to 10 mL of the working sample and the total volume was elevated to 50 mL with water. 0.2000 g of activated charcoal was added to the solution so prepared and stirred for 2 minutes in erlenmeyer. After filtering on quantitative paper, it was dried in an oven at 120ºC for one hour. Then the irradiation measurements of the sample+paper were made in a Spectrace 5000 Energy Dispersive X-Ray Spec-trometer. The following conditions were selected for sample irradiation: tube voltage = 20 kV; tube current = 0,25 mA; atmosphere = air; irradiation filter = 0.05 mm of rhodium film and irradiation time = 50 seconds. The integration of the Cu Kα line at 8.047 keV was used to monitor the Cu concentrati-on. This was the standard procedure before parameters optimization was performed.
RESULTS AND DISCUSSION
QUÍMICA NOVA, 21(4) (1998) 435 It may be observed peaks referent to iron that is a charcoal
contamination, however they do not interfere in the copper determination since it was always used the same charcoal. No signal for Cu Kα was observed when a blank solution was treated in the same way as were the Cu(II) solutions.
Parameters Optimization
The influence of the pH on the metal liquid-solid extraction was verified by preparing buffered solutions of pH from 1 to 10 (6), before adding the charcoal. Figure 2 shows the variation of the signal intensity (cps, counts per second) as a function of pH values. It may be observed that a more complete metal complexation and adsorption is reached at pH 8.5.
standard copper solutions [I(cps) = 0.22 + 0.15 mg Cu2+.L-1].
Figure 4 shows the results and, by means of the angular coefficients, it may be calculated a concentration rate of near 20 times.
Figure 1. Typical X-ray fluorescence spectrum for copper complexed with glycerin and adsorbed on charcoal. Irradiation conditions are described in the text. Iron emission peaks are seen as a charcoal contamination.
Figure 2. The effect of pH on the copper adsorption. The pH is controled by buffers.
When the volume of added glycerin was varied from 0.25 to 12 mL, no variation on the signal intensity was observed, indicating an adsorbing saturation on the charcoal surface, even at low glycerin concentrations.
The copper-glycerin complex saturation on the charcoal surface was verified supposing that the glycerin was always in excess in solution. So the copper concentration was varied and a constant signal intensity was observed from 2500 mg.L-1 Cu2+
and up. This value was considered adequate since the mass of charcoal is only of 0.2000 g. The mass relation between copper and charcoal in the adsorption may be attributed as 1:1. Figure 3 shows more clearly this affirmation.
Copper Calibration Curve
Under the optimized conditions, copper calibration curves were obtained in the concentration range of 14.68 to 293.6 mg.L-1, using
the solid phases after the concentration step [I(cps) = 8.18 + 2.87 mg Cu2+.L-1] and making the measurements directly in the
Figure 3. Charcoal adsorption limit. The charcoal mass is kept constant whereas the copper concentration is varied.
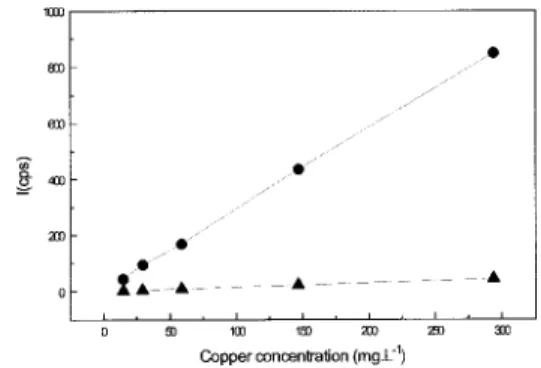
Figure 4. Calibration curves of copper in water (-▲-) compared to calibration curve of copper complexed in glycerin and adsorbed on charcoal (-●-). It may be attributed a concentration rate of 20 times.
Bismuth and Lead Interferences
It is far known that the elements bismuth and lead are subjected to glycerin complexation and so they may be consi-dered potential interferences to the developed method for copper (7). Under the same irradiation conditions, solutions having constant copper concentrations and variable bismuth and lead concentrations were submitted to the preconcentration method and the Cu Kα intensity was monitored. Figure 5 shows a greater bismuth interference than lead.
Figure 5. Bismuth (-▲-) and lead (-●-) interferences on the copper signal.
436 QUÍMICA NOVA, 21(4) (1998) made for the two elements using the analytical lines of Bi
Lαat 10.836 keV and of Pb Lα at 10.549 keV. The line equations are respectively [I (cps) = 29.39 + 2.09 mg Bi3+.L-1] and [I (cps) = 18.57 + 1.24 mg Pb2+.L-1]. Figure
6 shows the three calibration curves. It is easily seen that the sensitivities decrease in the order Cu2+, Bi3+ and Pb2+.
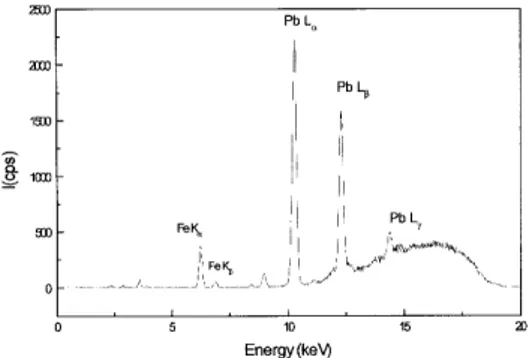
Figures 7 and 8 show typical X-ray fluorescence spectra for the two elements, lead and bismuth, respectively, complexed with glycerin and adsorbed on charcoal. The irradiation conditions were the same as for copper. Lead and bismuth interferences may be eliminated by reduction of their species Pb2+ and Bi3+ to their volatile hydrides,
using for example sodium tetrahydridoborate, NaBH4, as
reagent (1b).
Figure 6. Calibration curves for copper (-■-), bismuth (-▲-) and lead (-●-), showing this order of sensitivity . The irradiation conditions were the same as for copper, described in the text.
Figure 7. Typical X-ray fluorescence spectrum for lead complexed with glycerin and adsorbed on charcoal. Irradiation conditions were the same as for copper, described in the text. Iron emission peaks are seen as a charcoal contamination.
Figure 8. Typical X-ray fluorescence spectrum for bismuth complexed with glycerin and adsorbed on charcoal. Irradiation conditions were the same as for copper, described in the text. Iron emission peaks are seen as a charcoal contamination.
CONCLUSIONS
It was proposed here a simple and accessible method to perform the determination of Cu2+ in water. The interferences
of bismuth and lead were evaluated and it was verified they may also be determined by EDXRF, with the sensitivities decreasing in the order Cu2+, Bi3+ and Pb2+. The advantages of
the developed method are mainly its simplicity, low cost and low spectral interference when compared to Atomic Absorption Spectroscopy (AAS) and Induced Coupled Plasma (ICP).
ACKNOWLEDGMENTS
This work was supported by grants from CNPq, FAPESP and FAEP-Unicamp. L.C.A. is grateful to CNPq-Pibic-Unicamp for a fellowship at her graduation level.
REFERENCES
1a. Skoog, D. A.; Leary, J. J.; In Principles of Instrumental Analysis, 4th Edition; Saunders College Publishing,
Orlando, FL, 1992; p 357. 1b. Ibdem, p 222.
2. Leyden, D. E.; In Fundamentals of X-Ray Spectrometry as Applied to Energy Dispersive Techniques; Tracor
X-Ray Incorporated, 1984.
3. Seiler, H. G.; Sigel, H. and Sigel, A.; Handbook of Toxicity of Inorganic Compounds; Marcel Dekker, Inc.,
New York, 1988, p 56.
4. Tsalev, D. L.; Zaprianov, Z. K.; Atomic Absorption Spectro-metry in Occupational and Environmental Health Practice;
volume 1; CRC Press, Inc., Cleveland, OH, 1984; p 120. 5. Lau, O. W. and Ho, S. Y.; Anal. Chim. Acta1993, 280 ,269.
6. Gabb, M. H.; Latchem, W. E.; A Handbook of Laboratory Solutions; Chemical Publishing Company, Inc.; New
York, NY, 1968, p 35.