Article
Printed in Brazil - ©2015 Sociedade Brasileira de Química0103 - 5053 $6.00+0.00A
*e-mail: [email protected]
Noteworthy Method for Direct Determination of Sb
IIIand Total Inorganic Antimony
in Natural Waters
Thaís S. Neri,a Dayene C. Carvalho,a Vanessa N. Alvesb and Nívia M. M. Coelho*,a
aInstitute of Chemistry, University of Uberlândia, Av. João Naves de Ávila 2121,
38400-902 Uberlândia-MG, Brazil
bDepartment of Chemistry, University of Goiás, Av. Dr. Lamartine Pinto de Avelar,
1120 Setor Universitário, 75704-020 Catalão-GO, Brazil
A procedure was developed for the direct determination of SbIII and total inorganic Sb in
water samples by hydride generation atomic absorption spectrometry (HG AAS), without pre-reduction of SbV. The NaBH
4 concentration was maintained at 0.4% (m/v) to perform the selective
generation of stibine from SbIII and online stibine generation was carried out with 5.0% (m/v)
NaBH4 to obtain the total antimony concentration. SbV was calculated as the difference between the
values obtained for total Sb and SbIII. In both cases, the procedure did not appear to be adversely
affected by potential interferents such as SbV, AsIII, AsV, CaII, NaI, chloride and phosphate at a
concentration of 0.5 mg L−1. For the proposed procedure, the detection limits were 0.2 µg L−1 for
SbIII and 0.3 µg L−1 for total Sb, while the relative standard deviations were 0.1% for 10.0 µg L−1
SbIII and 0.4% for 10.0 µg L−1 total Sb. A sampling rate of approximately 30 determinations per hour
was achieved, requiring 300 mL of NaBH4, and the amount of waste generated was in order of
960 mL, indicating that this analytical procedure can be considered as green. The method was shown to be satisfactory for the determination of trace levels of antimony in water samples. The result obtained for the assaying of certified drinking water samples was 9.7 ± 0.1 µg L−1 (certified
value 10.0 ± 0.5 µg L−1).
Keywords:antimony speciation, selective generation, HG AAS, water analysis
Introduction
The toxicity of antimony and its compounds is a matter
of concern worldwide.1 The World Health Organization2
and United States Environmental Protection Agency3
have established maximum admissible concentrations for
antimony in drinking water of 20 and 6 µg L−1, respectively.
In general, inorganic antimony is more toxic than organic antimony and, moreover, the trivalent species is 10 times more toxic than the pentavalent species. This is because
SbIII shows a high affinity for red blood cells and sulfhydryl
groups in cell constituents, while erythrocytes are almost
impermeable to SbV.4
Nowadays, this metalloid is widely employed in several applications including in brake linings and as an additive in
the rubber vulcanization process.5-8 Also, organic antimony
compounds are used for the preparation of flame retardants. In the biomedical field, antimony compounds are used
as therapeutic agents to treat parasitic diseases such as
Leishmaniasis and Bilharziasis.9 Antimony is found in
nature mainly as sulfide stibnite (Sb2S3). Considering
the widespread industrial use of the various forms of Sb and their differences in toxicity, it is essential to develop analytical methods for their quantification.
Some previous papers describe experimental procedures
for the determination of SbIII and SbV, where SbV was
determined after pre-reduction to SbIII.10,11 The reducing
agents typically applied to convert SbV to SbIII are
potassium iodide and L-cysteine, and the former is the most widely used even though it is associated with several
problems.12 Potassium iodide requires relatively strong
because it allows the reduction to proceed under mildly
acidic conditions.13-15
HG combined with AAS as the detection technique has been frequently used for the direct determination of Sb in
several different types of samples.16-23 Some authors have
demonstrated that the response obtained for SbV is around
50-80% lower than that obtained for SbIII and it has been
suggested that in the process of stibine formation from
SbV, the SbV is firstly reduced to SbIII with the subsequent
formation of SbH3.24
The aim of this study was to develop a method for the
direct determination of trace amounts of SbIII and total Sb
by hydride generation atomic absorption spectrometry (HG
AAS) without an SbV pre-reduction step. The determination
of inorganic antimony species in water matrices using the proposed method is recommended, based on the fact that the
SbIII species shows significantly higher signal intensity at
low sodium tetrahydroborate (NaBH4) concentrations than
the SbV species. The sodium tetrahydroborate concentration
used for the determination of SbIII was 0.4% (m/v) and
notable interference was not observed at a concentration
of 0.5 mg L−1 SbV. Since a flow system was employed, it is
possible to perform the online generation of stibine with
5.0% (m/v) NaBH4 in the same system used to obtain the
total antimony concentration. The SbV is determined as
the difference between the values obtained for the total
antimony and SbIII. The optimal conditions for the hydride
generation and atomization of SbIII were investigated. The
method is suitable for application in routine analysis and monitoring studies.
Experimental
Instrumentation
For the antimony determination, a flame atomic absorption spectrophotometer (Varian, SpectrAA-220, Victoria, Australia) equipped with a continuous flow Varian VGA 77 vapor generation accessory was used. The VGA system consists of a three-channel peristaltic pump equipped with Tygon and polyethylene tubes that carry the sample through a reaction coil, where it is acidified and mixed with a suitable reductant. The stibine vapor formed is transferred to an absorption cell for determination by the spectrometer. The antimony hollow cathode lamp (Varian, Victoria, Australia) was operated at 7.0 mA, the wavelength was set at 217.6 nm and the spectral band pass was set at 0.1 nm. The analysis was carried out with a burner height of 17 mm, acetylene
flow rate of 2.0 L min−1 and air flow rate of 13.5 L min−1.
The sample, HCl, NaBH4, and nitrogen gas were introduced
at flow rates of 4.0, 7.0, 5.0 and 100 mL min−1, respectively.
The instrumental parameters used for the VGA 77 were those recommended by the manufacturer. The reaction time obtained after optimization was 60 s.
Reagents and solutions
All chemicals and reagents used were of analytical grade or higher purity and deionized water obtained from a water purification system (Gehaka, São Paulo, Brazil) was used throughout. Before use, laboratory glassware was kept overnight in 10% (v/v) nitric acid (aqueous solution) followed by ultra-sonication for 1 h and final rinsing with
deionized water. Working standard solutions of SbIII and
SbV were all prepared daily through the appropriate dilution
of 1000 mg L−1 SbCl
3 (Merck, Darmstadt, Germany) and
1000 mg L−1 SbCl
5 (Merck, Darmstadt, Germany) stock
solutions, respectively. These solutions were stored in polyethylene bottles in a refrigerator at 4 °C. Sodium tetrahydroborate solutions were prepared daily from 97%
NaBH4 (Fluka, Switzerland) in 0.4% (m/v) NaOH (Merck,
Darmstadt, Germany) solution to give stability since
NaBH4 decomposes easily. A solution of 5% (v/v) HCl was
prepared through dilution of concentrated hydrochloric acid in water (Merck, Darmstadt, Germany).
Study of the experimental variables
Since NaBH4 is used directly in the HG system for
stibine generation and high concentrations of reductant are
able to reduce total Sb to SbIII and, in turn, to stibine, a study
was conducted to compare the analytical signal obtained
from SbV and SbIII solutions, separately. In order to evaluate
the effect of sodium tetrahydroborate concentration on the
analytical signal for solutions containing 10 µg L−1 SbIII
or SbV, the sodium tetrahydroborate concentration was
evaluated in the range of 0.1 to 10.0% (m/v). The sodium
tetrahydroborate flow rate was maintained at 5.0 mL min−1
and the HCl concentration at 5.0% (v/v). The optimization of the parameters affecting the antimony determination by HG AAS was performed using a univariate method. Other variables studied were the sample and sodium tetrahydroborate flow rates and the HCl concentration.
Study on interfering ions
In order to investigate the selectivity of the proposed
method, the determination of SbIII in the presence of possible
interferences was investigated. For this purpose, experiments
were conducted using a 27-3 fractional factorial design and
the results analyzed by calculating the interference factor.
CaII, NaI, Cl−, PO
43−) was verified by comparing the analytical
signals of a solution containing only SbIII and a solution
containing SbIII ions together with potentially interfering
ions. In this study, a specie was considered as an interferent
in the SbIII determination by the proposed procedure when
the difference between the analytical signal for the solution
containing only SbIII ions and that also containing the possible
interfering ions was higher than 10%. Thus, the interference factor, IF, is defined by equation 1:
IF = A'/A (1)
where A' is the analytical signal for the solution containing the analyte in the presence of possible interferents, and A
is the analytical signal for the solution containing SbIII in
the absence of possible interferents. An interference factor of 1.00 indicates that there is no interference, while factors greater than 1.10 or smaller than 0.90 indicate an increase or a decrease in the analytical signal due to interference. Other ions present in the certified sample (APS 1075), such as Ni, Cu and Zn, showed no interference in amounts 6, 2 and 7-fold higher than the total Sb value, respectively.
Samples
Mineral water samples were obtained from local store.
For the recovery tests, the samples were spiked with SbIII
and SbV at a concentration of 10.0 µg L−1. The accuracy was
also determined using samples of certified drinking water (APS-1075). This certified reference material was obtained from Alpha Resources Inc. (Stevensville, Michigan, USA). The proposed procedure was also applied to sea water samples from Itaguá Beach (Ubatuba, SP, Brazil), Lamberto Beach (Ubatuba, SP, Brazil) and Fortaleza Beach (Ubatuba, SP, Brazil) and river water samples of two different locations along the Uberabinha River, which runs through an urban zone in the city of Uberlândia (Minas Gerais, Brazil). In addition, the proposed procedure was also applied to sediment samples collected from Itaguá Beach (Ubatuba-SP). These samples were subjected to the Bureau Commune de Reference (BCR) sequential
extraction method (4th extraction stage) proposed by the
European Community Bureau of Reference.25
Results and Discussion
Evaluation of antimony hydride generation conditions
The conditions for HG were optimized to obtain maximum sensitivity and reproducibility of the method. Figure 1 shows the results for the system.
The efficiency of the antimony hydride generation was investigated using 6.0% (v/v) HCl at different flow rates
from 1.0 to 9.0 mL min−1. The results indicate an increase
in the absorbance signal with an increase in the flow rate up
to 7.0 mL min−1 (Figure 1a). At higher flow rates, the signal
decreased since the sample and the reagent did not have sufficient time to mix. Lower flow rates were not sufficient to generate atomic hydrogen in adequate quantities to react
with BH4− efficiently,26 while at higher flow rate, excessive
formation of H2 occurs interfering in the analytical
signal.26-28 Thus, the most appropriate hydrochloric acid
flow to ensure the formation of a sufficient amount of
stibine was 7.0 mL min−1.
Sodium tetrahydroborate flow rates ranging from 1.0
to 12.0 mL min−1 were evaluated. The analytical signal
was relatively low when the sodium tetrahydroborate
flow rate was less than 5.0 mL min−1. For flow rates
above 5.0 mL min−1 there was a slight decrease in the
analytical signal, and above 7.0 mL min−1 a sharp decrease
was observed (Figure 1b). This can be explained by the
formation of H2 gas in excess, resulting in dilution of
the stibine formed, allowing the hydrides to reach the atomization cell. Thus, the flow of sodium tetrahydroborate
solution was maintained at 5.0 mL min−1.
Another important factor to be studied is the sample flow rate. Although a high flow rate is preferable in order to achieve higher sampling frequency, the sample flow rate is limited by the reaction in the hydride generation system and the capacity of the pumping system to maintain a stable flow under high pressures. The sample flow rate was studied
in the range of 1 to 10 mL min−1. The analytical signal
increased until a sample flow rate of 4.0 mL min−1 and from
then on, it remained almost constant up to 8.0 mL min−1,
after which it decreased (Figure 1c). This decrease is related
to the greater amount of SbIII introduced into the gas-liquid
separator when high sample flow rates are used, and the
NaBH4 is not sufficient to reduce the whole amount of
sample present and generate stibine. Thus, the sample flow
was set at 4.0 mL min−1.
The experimental conditions for the determination of
SbIII and SbV were established for the selective generation
of stibine from SbIII and online stibine generation to
obtain the total antimony concentration. The hydride
generation parameters evaluated were the NaBH4 and HCl
concentrations. Each parameter was evaluated for each
antimony species using 10 µg L−1 SbIII and SbV solutions.
The NaBH4 concentration is an important parameter
for the generation of stibine, because it is formed in the
presence of hydrogen generated by NaBH4 in an acidic
medium. In this case, H2 acts as a stripping gas, besides
present is dependent on the NaBH4 and HCl flow rates and concentrations, all of these parameters need to be studied.
Figure 1 shows that the generation of hydride from SbV leads
to slower stibine generation compared with SbIII, making it
necessary to increase the NaBH4 concentration in order to
compare the results obtained for the two species. Results show that the absorbance increases with an increase in the
NaBH4 concentration in the determination of both inorganic
antimony forms (Figure 2). However, the response obtained
for SbV is lower than that obtained for SbIII. The results
of previous studies suggest that in the process of stibine
formation from SbV, there is firstly the reduction of SbV to
SbIII with the subsequent formation of SbH
3.24 A NaBH4
concentration higher than 0.4% (m/v) is required to obtain
complete antimony hydride generation from both SbIII and
SbV, while a NaBH
4 concentration higher than 5.0% (m/v)
is needed for stibine hydride generation from SbV. These
results demonstrate that the determination of SbIII and SbV
is possible under these conditions. The SbIII was determined
under conditions where there was no hydride generation
from SbV. Thus, a NaBH
4 concentration of 0.4% (m/v) was
selected in order to obtain the best analytical performance. The total antimony concentration was determined in the same
flow system using a NaBH4 concentration of 5.0% (m/v).
The effect of varying the HCl concentration on the
analytical signal for SbIII and SbV was investigated from
0.05 to 10.0% (v/v) HCl. The signals related to SbIII and
SbV increased up to a concentration of 6.0% (v/v) HCl. The
sensitivity was not significantly different on comparing 6.0 and 10.0% (v/v) HCl and, thus, 6.0% (v/v) HCl was chosen for further measurements.
Comparative tests for efficiency of the reduction of SbV
Since the use of NaBH4 at high concentrations proved
to be effective in reducing SbV and the total antimony
could be determined without a pre-reduction step, a study was conducted to evaluate the effectiveness of this reagent in comparison with L-cysteine. For this, two calibration
curves with concentrations ranging from 0 to 10 µg L−1
SbV were constructed. The calibration curve obtained when
the reduction was performed online using 5.0% (m/v)
NaBH4 was compared with that obtained for SbV solutions
subjected to a pre-reduction step with L-cysteine. It was
observed that the analytical signals obtained for the SbV
determination using the proposed method are similar to those obtained when performing the pre-reduction step.
Studies of interfering ions
The effects of representative potential interferents that are known to affect the hydride process were determined,
0 2 4 6 8 10
0.0 0.2 0.4 0.6 0.8 1.0 1.2
Absorbance
Flow rate HCl / (mL min )–1 (a)
0 2 4 6 8 10 12
0.7 0.8
0.9
1.0 1.1 1.2 1.3 1.4 1.5 1.6
Absorbance
Flow rate NaBH / (mL min )4 –1 (b)
0 2 4 6 8 10
0.5 0.6 0.7 0.8 0.9 1.0
Absorbance
Flow rate Sb / (mL min )III –1 (c)
Figure 1. Optimization of the following HG conditions: (a) HCl flow rate, (b) NaBH4 flow rate and (c) sample flow rate.
0 1 2 3 4 5 6 7 8 9 10 11
0,0 0,2 0,4 0,6 0,8 1,0
Absorbance
NaBH / % (m/v)4 SbIII
Sb total
i.e., SbV, AsIII, AsV, CaII, NaI, Cl− andPO
43−. To investigate
the extent of their effect on the determination of antimony,
10 µg L−1 of SbIII was spiked with increasing levels of these
potential interferents and values for the interference factor were calculated for each experiment (data not shown). A considerable signal depression was observed for all
interfering ions when present in a fifty-fold excess. SbIII
can be tolerated without interference up to a 25-fold excess.
Analytical figures of merit and application
The equations for the calibration curves obtained
for aqueous standard solutions of SbIII and SbV were:
A= 0.023 + 0.056[SbIII] and A= 0.001 + 0.050[SbV], where
A is the absorbance and the Sb concentration is expressed
as µg L−1. The correlation coefficients for the calibration
curves were 0.9984 and 0.9997, respectively. For the SbIII
determination, 0.4% (m/v) NaBH4 was used and for the
SbV determination, 5.0% (m/v) NaBH
4 was used. The
calibration curves were linear up to a concentration range
of 0.7-50.0 µg L−1 for SbIII and 0.7-50.0 µg L−1 for SbV. The
detection limits based on 3σ/m, where σis the standard
deviation of 10 measurements of a blank and mthe slope of
the calibration curve, were 0.2 µg L−1 for SbIII and 0.3 µg L−1
for total Sb. Based on ten measurements (n = 10), relative
standard deviations of 0.1% for 10 µg L−1 SbIII and 0.4%
for 10 µg L−1 total antimony were obtained, demonstrating
excellent repeatability. The analytical frequency was
30 samples per hour. The NaBH4 consumption was around
300 mL and waste generation in the order of 960 mL h−1.
Thus, the determination of Sb in water samples by HG AAS represents an acceptable green analysis procedure. Its rank on the Eco-Scale (71) results from the minimal amounts of
reagents used and waste generated.28
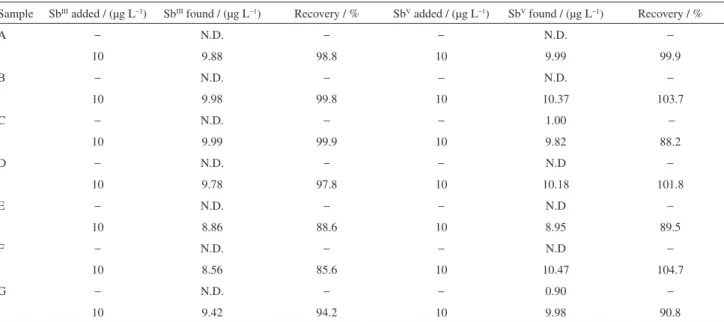
The proposed method was applied to the quantification of antimony in mineral, sea and river water samples
(Table 1). SbIII was not detected in these samples and SbV
was detected in sea and river water samples. To validate the method for the analysis of water, two samples were spiked
with SbIII and SbV to give a final concentration of 10.0 µg L−1
of SbIII and SbV. As can be seen in Table 1, recovery
percentages of 98.8 to 103.7% were obtained. The results for sediment samples collected at Itaguá Beach
(Ubatuba-SP) were in the range of 2.8 ± 0.5 µg L−1 to 3.8 ± 0.5 µg L−1
total Sb. SbIII was not detected in these samples.
The accuracy of the method was evaluated by analyzing drinking water reference material APS 1075 with a certified
inorganic antimony concentration of 10.0 ± 0.5 µg L−1. The
result obtained for total Sb was 9.7 ± 0.1 µg L−1 and SbIII
was not detected. These results are in good agreement with the certified values, confirming the reliability of the proposed method.
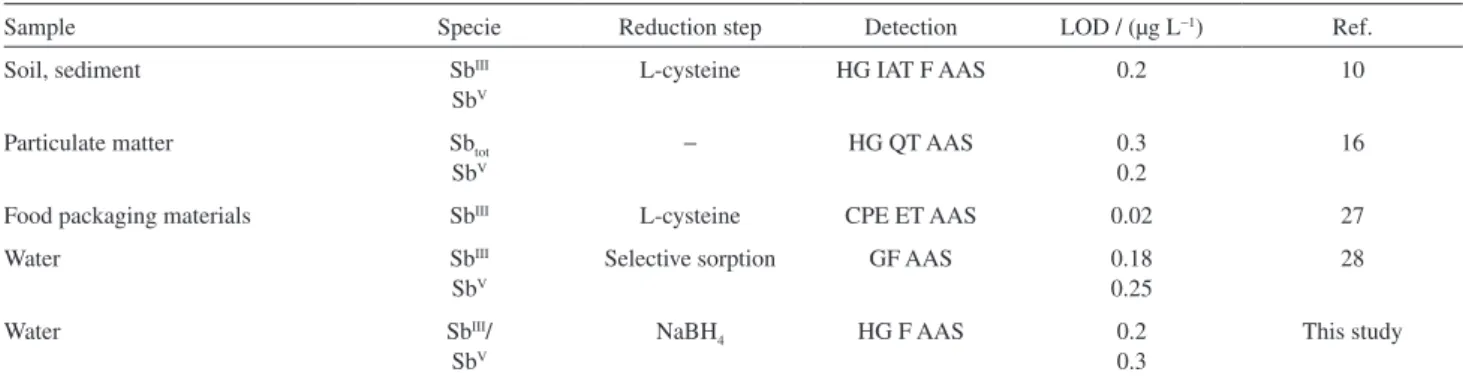
In this study, the proposed method was described and compared, according to the detection technique used. Important details related to previously published procedures
for SbIII and total Sb determination are given in Table 2. Most
of these methods were applied to the analysis of antimony in environmental samples (water, sediment and particulate
Table 1. Experimental recovery of antimony in water samples spiked with 10.0 µg L−1 of SbIII and SbV by HG AAS
Sample SbIII added / (µg L−1) SbIII found / (µg L−1) Recovery / % SbV added / (µg L−1) SbV found / (µg L−1) Recovery / %
A − N.D. − − N.D. −
10 9.88 98.8 10 9.99 99.9
B − N.D. − − N.D. −
10 9.98 99.8 10 10.37 103.7
C − N.D. − − 1.00 −
10 9.99 99.9 10 9.82 88.2
D − N.D. − − N.D −
10 9.78 97.8 10 10.18 101.8
E − N.D. − − N.D −
10 8.86 88.6 10 8.95 89.5
F − N.D. − − N.D −
10 8.56 85.6 10 10.47 104.7
G − N.D. − − 0.90 −
10 9.42 94.2 10 9.98 90.8
matter). To compare the method proposed herein, the limit of detection was taken into account. The lowest limit of detection reported for the previously published methods
in Table 2 is 0.02 µg L−1. However, these methods often
require tedious sample pre-treatment procedures such as
preconcentration and extraction steps.29,30 It can be observed
that the method described herein shows better or similar performance when compared with previously published procedures in terms of the limit of detection. Furthermore, the method does not require the use of a pre-reduction step and offers the advantage of selective determination.
Conclusions
The use of the HG AAS system described herein was
found to be effective for the determination of SbIII and SbV.
The use of HG AAS provides adequate sensitivity and
accuracy for the direct determination of antimony (SbIII and
SbV) in water samples using the same flow system, thereby
avoiding the tedious reduction procedures required for the
determination of SbIII and SbV by previously published
methods. Since the pre-reduction step is eliminated, the need for sample handling and therefore the risk of contamination are reduced. The number of samples that can
be analyzed per hour is 30. NaBH4 consumption is around
300 mL and waste generation is in the order of 960 mL h−1,
indicating that this can be considered as a green analysis procedure. As a result, this is an attractive technique for the routine determination of trace amounts of antimony in water samples.
Acknowledgments
The authors are grateful for financial support from the Brazilian Federal Governamental and State funding agencies: Conselho Nacional de Desenvolvimento
Científico e Tecnológico (CNPq), Fundação de Amparo à Pesquisa do Estado de Minas Gerais (FAPEMIG) and Coordenação de Aperfeiçoamento de Pessoal de Nível Superior (CAPES).
References
1. Amarasiriwardena, D.; Wu, F. C.; Microchem. J. 2011, 97, 1.
2. World Health Organization (WHO); Guidelines for Drinking-Water Quality, 4th ed., WHO Library Cataloguing-in-Publication
Data: Geneva, 2011.
3. http://water.epa.gov/drink/contaminants/ accessed on March 11, 2015.
4. He, M. C.; Wang, X. Q.; Wu, F. C.; Fu, Z. Y.; Sci. Total Environ.
2012, 421, 41.
5. Santos, E. J.; Herrmann, A. B.; Prado, S. K.; Fantin, E. B.; Santos, V. W.; Oliveira, V. M.; Curtius, A. J.; Microchem. J. 2013, 108, 233.
6. Fujiwara, F.; Rebagliati, R. J.; Marrero, J.; Gomez, D.; Smichowski, P.; Microchem. J. 2011, 97, 62.
7. Nomngongo, P. N.; Ngila, J. C.; Kamau, J. N.; Msagati, T. A. M.; Moodley, B.; Talanta2013, 110, 153.
8. Dessuy, M. B.; Kratzer, J.; Vale, M. G. R.; Welz, B.; Dedina, J.; Talanta2011, 87, 255.
9. Sundar, S.; Chakravarty, J.; Int. J. Environ. Res. Public Health
2010,7, 4267.
10. Matusiewicz, H.; Krawczyk, M.; J. Anal. At. Spectrom. 2008, 23, 43.
11. Hong, W.; Xuecui, W.; Bing, L.; Yueling, L.; Shanshan, L.; Jusheng, L.; Jiuying, T.; Wenfeng, Z.; Zonghui, Y.; Spectrochim. Acta, Part B 2011, 66, 74.
12. Kamlesh, S.; Kavita, A.; Neetu, H.; J. Hazard. Mater. 2008,
155, 173.
13. Mihaltan, A. I.; Frentiu, T.; Ponta, M.; Petreus, D.; Frentiu, M.; Darvasi, E.; Marutoiu, C.; Talanta2013, 109, 84.
Table 2. Comparison of methods for determination of SbIII and SbV using hydride generation
Sample Specie Reduction step Detection LOD / (µg L−1) Ref.
Soil, sediment SbIII
SbV
L-cysteine HG IAT F AAS 0.2 10
Particulate matter Sbtot
SbV
− HG QT AAS 0.3
0.2
16
Food packaging materials SbIII L-cysteine CPE ET AAS 0.02 27
Water SbIII
SbV
Selective sorption GF AAS 0.18
0.25
28
Water SbIII/
SbV
NaBH4 HG F AAS 0.2
0.3
This study
14. Gonzalvez, A.; Cervera, M. L.; Armenta, S.; De la Guardia, M.; Anal. Chim. Acta2009, 636, 129.
15. Pitzalis, E.; Mascherpa, M. C.; Onor, M.; D’Ulivo, A.; Spectrochim. Acta, Part B 2009, 64, 309.
16. Ferreira, S. L. C.; Macedo, S. M.; Santos, D. C.; Jesus, R. M.; Santos, W. N. L.; Queiroz, A. F. S.; Andrade, J. B.; J. Anal. At. Spectrom. 2011, 26, 1887.
17. Lopez-Garcia, I.; Rivas, R. E.; Hernandez-Cordoba, M.; Talanta
2011, 86, 52.
18. Chen, Y. W.; Belzile, N.; Anal. Chim. Acta2010, 671, 9. 19. Fornieles, A. C.; Torres, A. G.; Alonso, E. V.; Cordero, M. T. S.;
Pavon, J. M. C.; J. Anal. At. Spectrom.2011, 26, 1619. 20. Yousheng, Y.; Jianchi, S.; Hongbing, M.; Guanhong, T.; Talanta
2010, 81, 1502.
21. Semira, Y. U.; Şerife, Y.; Anal. Chim. Acta2013, 770, 7. 22. Morgana, D. B.; Jan, K.; Maria, R. G. V.; Bernhard, W.; Jiří, D.;
Talanta2011, 87, 255.
23. Long, Z.; Chen, C.; Hou, X. D.; Zheng, C. B.; Appl. Spectrosc. Rev. 2012, 47, 495.
24. Ferreira, S. L. C.; Santos, W. N. L.; Santos, I. F.; Junior, M. M. S.; Silva, L. O. B.; Barbosa, U. A.; Santana, F. A.; Queiroz, A. F.; Microchem. J. 2014, 114, 22.
25. Ure, A. M.; Quevauviller, P. H.; Muntau, H.; Griepink, B.; Int. J. Environ. Anal. Chem.1993, 51, 133.
26. Emur, H.; Yasemin, I.; Miray, K.; Nur, A.; Onur, Y.; Tülin, D. C.; Raif, I.; Spectrochim. Acta, Part B2011, 66, 793.
27. Quiroz, W.; Ariasa, H.; Bravo, M.; Pinto, M.; Lobos, M. G.; Cortés, M.; Microchem. J.2011, 97, 78.
28. Gałuszka, A.; Konieczka, P.; Migaszewski, Z. M.; Namiesnik, J.; TrAC, Trends Anal. Chem.2012, 37, 61.
29. Jiang, X.; Wen, S.; Xiang, G.; J. Hazard. Mater. 2010, 175, 146.
30. Zih-Perényi, K.; Jankovics, P.; Sugár, É.; Lásztity, A.; Spectrochim. Acta, Part B 2008, 63, 445.