Artigo
*e-mail: [email protected]
IMPROVING THE SOLUBILITY OF THE ANTICHAGASIC DRUG BENZNIDAZOLE THROUGH FORMATION OF INCLUSION COMPLEXES WITH CYCLODEXTRINS
José Lamartine Soares Sobrinho e Mônica Felts de La Roca Soares
Departamento de Bioquímica e Farmacologia, Universidade Federal do Piauí, Campus Universitário Ministro Petrônio Portella, 64049-550 Teresina – PI, Brasil
Juan Jose Torres Labandeira
Departamento de Farmácia e Tecnologia Farmacêutica, Universidade de Santiago de Compostela, 15782 Santiago de Compostela, Espanha
Lariza Darlene Santos Alves e Pedro José Rolim Neto*
Departamento de Ciências Farmacêuticas, Universidade Federal de Pernambuco, Rua Arthur de Sá, s/n, 50740-521 Recife – PE, Brasil
Recebido em 12/11/10; aceito em 19/4/11; publicado na web em 17/6/11
This study describes unpublished research on improving the solubility of benznidazole by the formation of an inclusion complex. The cyclodextrins selected were αCD, βCD, γCD, HPβCD, RMβCD and SBβCD. All complexes were obtained in solution, presenting 1:1 stoichiometry according to the phase solubility diagram. The highest association constants were obtained with RMβCD and SBβCD, being selected for attainment of solid state complexes. These were characterized using XRD, SEM and dissolution test. The data obtained suggest the formation of complexes and indicate that these may provide a promising alternative way of developing solid doses of drug with suitable biopharmaceutical properties.
Keywords: benznidazole; Chagas disease; inclusion complex and dissolution.
INTRODUCTION
Chagas disease is an endemic disease caused by the protozoan Trypanosoma cruzi and is considered to be a serious medical and social problem in Latin America, affecting approximately 10 million individuals, with an additional 40 million at risk of infection.1,2
Although it is not the ideal drug of choice, owing to its low solubility and consequent high toxicity, benznidazole (BNZ), N-benzyl-2-(2-nitroimidazol-1-yl) acetamide, is currently the only drug available for Chagas disease treatment.3
Increased knowledge of the physicochemical characteristics of drugs and of more effective techniques for improving the biopharma-ceutical properties of drugs enables new therapeutic alternatives to be developed more cheaply and more quickly than the introduction of a new molecule into the treatment.
Several techniques, such as solid dispersion,4 sol-emulsion,5 inclusion complexation and conjugation with water-soluble polymer or cyclodextrin have been developed to enhance the solubility of various drugs.6-11
The potential use of natural cyclodextrins (CDs) and their syn-thetic derivatives has been extensively studied as a way of improving certain drug properties, such as solubility, stability and/or bioavail-ability. The property of enhancing solubility may be explained by the formation of water-soluble inclusion complexes in which the hollow, truncated, cone-like CD structure encapsulates the hydrophobic drug molecules in the apolar interior. By contrast, the outer, hydrophilic region of the CD, enables solubilization through interaction with water molecules.12,13
As yet few researchers have adopted technical approaches that aim to optimize the biopharmaceutical properties of BNZ and none of these
have considered the development of a solid pharmaceutical form. Alter-natives to a parenteral solution of BNZ found in the literature include the development of liposomes2,4 and obtention of a ruthenium complex, trans-[Ru(Bz)(NH3)4SO2](CF3SO3)2,14 which alters the solubility of the compound and increases the effectiveness of the drug. However, no study involving BNZ has placed the drug in an inclusion complex, an approach that may hold promise for the development of a solid dosage form that is more appropriate than the one currently available.15
The purpose of this study was to improve the solubility and disso-lution rate of BNZ in order to develop a promising solid oral delivery system. Firstly, a screening of six types of CDs was performed and their capacity of increasing the drug intrinsic solubility evaluated by the phase solubility studies, being three natural CDs (α, β and γ) and three modified βCDs [randomly methylated βCD (RMβCD), hydroxypropyl βCD (HPβCD) and sulfobutyl ether βCD (SBβCD)]. In a second phase, BNZ-CD binary systems were prepared in solid state. Only the two modified βCDs, RMβCD and SBβCD, which had the highest complex association constants for this phase. The solid state complexes were obtained using a variety of methods, includ-ing physical mixinclud-ing, kneadinclud-ing, freeze-dryinclud-ing and evaporation. The inclusion complexes obtained were characterized using X-ray powder diffraction (XRPD) and scanning electron microscopy (SEM), and the dissolution profile of the complex and the drug were determined. EXPERIMENTAL
Materials
Roquette (Barcelona, Spain); HPβCD (degree of molar substitution of 2.7) by Janssen Pharmaceutica (Beerse, Belgium) and SBβCD (degree of molar substitution of 1.0) by CyDex (Lenexa, KS). All other materials were of analytical grade. The solutions were prepa-red using distilled water, filteprepa-red through 0.22 µm Millipore filters (Millipore Corp®, Billerica, MA).
Analytical methods
The UV spectrophotometric method was used, following the method previously reported by Soares-Sobrinho et al.16 for quantita-tive determination of BNZ, on an Agilent 8453 UV-Visible spectro-photometer (Agilent Corp, Santa Clara, CA) with a photodiode array detector set at 324 nm. The calibration curve in water was plotted using standard solutions in the range of 4 to 40 µg mL-1. The addition of CD’s was observed to have no effect on the UV spectrum of the BNZ solution for any of the CDs studied.
Phase solubility diagram
Phase solubility studies were performed according to the method reported by Higuchi et al..17 Excess quantities of BNZ (~30 mg) were added to 5 mL aqueous solutions containing increasing con-centrations of CDs, in the range of 0 to 1.5% (wt/vol) for βCD; 0 to 2% (wt/vol) for α and γ CD; 0 to 4% (wt/vol) for HPβCD RMβCD and SBβCD. Suspensions were placed in an ultrasound bath for 15 min and shaken in an oscillating water bath thermostatically controlled at 25 ºC for 7 days, which previous studies have shown to be sufficient time to ensure equilibrium. Samples were filtered and appropriately diluted. The concentration of BNZ was deter-mined using a spectrophotometer. Experiments were performed in triplicate. The drug-CD association constants (K1:1) were calculated using the linear portion of the phase solubility diagrams, assuming 1:1 stoichiometry, according to the Equation 1, where S0 is BNZ water solubility in the absence of CD:
(1)
Preparation of solid-state complexes
Preparation of physical mixture
A physical mixture (PM) of BNZ and the CDs RMβCD or SBEβCD was obtained by mixing the compounds in a Turbula WAB T2C mixer (Willy A. Bachofen Corp, Basel, Switzerland) at a 1:1 mol ratio for 25 min.
Preparation of kneaded systems (KN)
The kneaded system (KN) was prepared from the physical mixture in a mortar by the slow addition of ethanol/water (1:1 vol/vol), at 20% wt/wt, and mixed until a homogeneous system was obtained. Samples were dried for 24 h in a 40 ºC oven and powdered.
Preparation of freeze-dried systems (FD)
The physical mixture was dissolved in ethanol:water (1:1 vol/ vol). The solution was frozen by immersion in liquid nitrogen and freeze-dried (FD) in a Labconco apparatus (Labconco Corp, Kansas City, MO).
Evaporation (EV)
The physical mixture was dissolved in ethanol:water (1:1 vol/ vol). The solution was evaporated in a vacuum at 50 ºC in a rotary evaporator (Büchi Rotavapor R-200).
The characterization of the solid-state complexes
X-ray powder diffraction (XRPD)
The X-ray powder diffraction patterns were collected using co-pper radiation (40 Kv, 30 mA), on a Philips PW 1729 diffractometer (Philips Corp, Netherlands) with Bragg-Brentano geometry, in the 2<2θ<60 range with a step size of 0.02º and counting time of 2 s per step.
Scanning electron microscopy (SEM)
The surface morphologies of samples were examined using a LEO-435VP scanning electron microscopy (Leica Microsystems, Cambridge, UK). Particles were fixed on a brass stub using double-sided tape and vacuum coated gold.
Dissolution studies
In vitro dissolution studies were performed in accordance with the Food and Drug Administration’s18 specifications for poorly soluble drugs. The United States Pharmacopeia19 dissolution two paddle apparatus (Turu Grau DT-6, Barcelona, Spain) set at 75 rpm and 37 ºC (± 0.5 ºC) was used. In order to ensure the Sink condition of the method and increase the specificity of the dissolution test, to show that this method is able to distinguish between different drug formulations, the recommended medium for poorly soluble drugs was selected: namely, sodium chloride : hydrochloride acid buffer pH 1.2, with a volume of 900 mL. Powdered samples of 50 mg of BNZ or equivalent amounts of each BNZ/CD system (particle size 50-200 µm) were tested. Samples were collected at certain time intervals, filtered through cellulose filters, and the concentration of dissolved drug was determined by spectroscopy at 324 nm. Three replicates were tested for each binary system. The dissolution profiles were assessed and compared using dissolution efficiency at 15 and 20 min (DE15 and DE20) as the parameters.20 The statistical analysis of the DE20 was performed using one-way analysis of variance (ANOVA) followed by a least significant difference (LSD) test using Statgraph-ics Plus Version 3.
RESULTS AND DISCUSSION
Phase solubility diagram
In this paper, we have used a method to determinate the asso-ciation constants of the inclusion complexes formed between BNZ and all CDs used, based on phase solubility studies (Figure 1). The improvement in solubility of the BNZ depended greatly on the type of CD. In all cases, the solubility of BNZ increased linearly as a function of CD concentration over the concentration range under study, with gradients lower than one. These diagrams can be classified as AL type and suggest a 1:1 mol:mol BNZ-CD stoichiometry, according to Higuchi et al..17 This drug had not hitherto been evaluated using studies involving CDs.
The K1:1 values obtained for βCD and derivatives (HPβCD, RMβCD, SBβCD) were almost twice as high as those obtained for the other CDs (αCD and γCD) (Figure 1) (Table 1). The improved solubility of RMβCD may result from the presence of methyl groups, which can extend the hydrophobic region of the CD cavity, facilita-ting and stabilizing BNZ inclusion complexation.21 A similar effect also occurs with the hydroxypropyl and sulfobutyl ether groups. All complex solutions had a final pH of ≈ 7.0, indicating no change in pH occurred during the study.
characteristics of RMβCD and SBβCD, especially their high aqueous solubility and low toxicity, in addition to their greater capacity to dissolve BNZ, made these CDs the candidates for inclusion in an oral solid dosage form.22
Characterization of solid-state complexes
X-ray powder diffraction
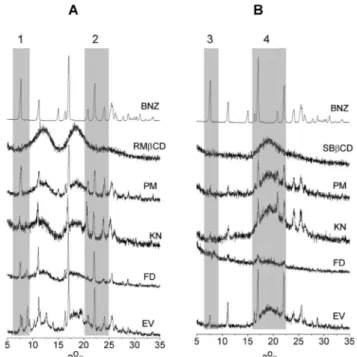
XRPD was carried out on the samples in isolation (BNZ, RMβCD and SBβCD), PM and EV, FD and KN, with a view to identifying evidence of the formation of CD inclusion complexes (Figure 2). The diffractometric profile of the drug reveals the presence of high-intensity peaks at 7.5, 16.5 and 22 º2θ, along with a number of secon-dary peaks, thereby demonstrating the crystalline behavior of BNZ. The opposite can be seen in the diffratograms of the predominantly amorphous CDs.
The PM method of preparation, both for RMβCD and SBβCD, correspond to the sum of both profiles with a reduction in the intensity of BNZ peaks owing to its concentration in the sample. It is possible, according to Figure 2, to identify alterations in some characteristic peaks of BNZ in addition to the disappearance or lower intensity of the other peaks in the processed preparations (KN, FD and EV). This may be taken as evidence of interaction between the components being facilitated by the processing of samples.
Column 1 in Figure 2A shows the lower peak in the KN, FD and EV preparations, when compared to PM, along with the appearance of new peaks near the characteristic initial peak of BNZ at 7.5 ° 2θ. The appearance of new peaks not corresponding to the original component provides strong evidence of the formation of a new crystalline phase that may correspond to the drug-CD inclusion complex.
Column 2 in Figure 2A points to the disappearance and weakening of peaks in the region between 20 and 26 2θ for the FD sample, which
may indicate loss of crystalline structure in this sample, which can also be interpreted as evidence of interaction between BNZ and RMβCD. It was possible to detect small variations in the relative intensity of the peaks for the drug in mixtures containing SBβCD (Column 3-4, Figure 2B) in the processed samples. However, these variations are difficult to interpret, since they may be caused by an effect of the preferred orientation of crystals. For the FD preparation (Figure 2B), a more pronounced amorphous profile can be seen, with alterations to the characteristics of the main crystalline peaks of the drug and, in the case of the preparation illustrated in Figure 2A, this may indicate interaction between components.
In view of these changes observed from the diffratograms, it is fair to say that there is consistent evidence of interaction and, conse-quently, possible formation of inclusion complexes.23,24
Scanning electron microscopy (SEM)
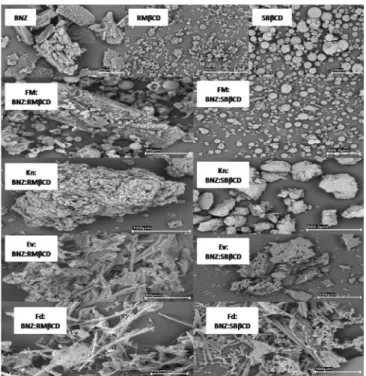
Morphological changes in particles can have an important impact on the dissolution profile.25,26 Selected photomicrographs of BNZ, RMβCD and SBβCD, along with those of binary systems processed are represented in Figure 3. BNZ characteristically takes the form of regular crystals,27 while RMβCD and SBβCD are normally composed of amorphous particles.8
In general, all the processed samples underwent changes in the morphology of the particles. The characteristics of the amorphous particles of the non-manipulated CDs were not observed. The KN preparation form aggregates (granules) that are somewhat uniform in size. The FD formulation of both CDs and the EV formulation of RMβCD show a reduction in the size of particles, which take the form of needles shaped completely differently from the materials at the start of the experiment. The change in shape and reduction in size of particles seems to less striking for the EV preparation of SBβCD. Dissolution studies
The dissolution profiles for the systems under study are presented in Figure 4. The dissolution efficiency was calculated after 15 and 20 min for all the products studied (Table 2). Data from the literature show that increases in the dissolution of inclusion complexes for Table 1. Results obtained from the phase solubility diagram
CDs K1:1 (mol
-1) R2
HPβCD 49.7 0.9992
SBβCD 74.1 0.9985
RMβCD 68.3 0.9982
αCD 14.7 0.9699
γCD 22.9 0.9579
βCD 57.2 0.9981
Figure 2. X-ray diffraction patterns of BNZ with RMβCD (A) and SBbCD (B) as supplied and their processed binary systems
different drugs can be explained by their higher energy amorphous state (reduction in crystallinity) and by the lower interfacial tension between water and the insoluble drug.25
Significant differences were observed in the dissolved quantities of pure drug (BNZ), PM and processed forms (KN, FD and EV) as well as in the dissolution rate. Five minutes after the start of the dissolution test, the percentage of drug dissolved was ≈12%; the percentage of drug dissolved from the RMβCD complex was over 80% and the percentage of drug dissolved from the SBβCD complex was over 50%.
In the case of both PMs, the dissolution efficiency brought about a significant difference in comparison to pure BNZ (p < 0.05). This appears to be a consequence of the mechanical treatment which in-creases the contact between the drug and the carrier. This fact can be attributed to the improved wettability of PMs, owing to the presence of cyclodextrins,28 as well as, in the earlier stages of the dissolution process, CD molecules operating locally on the hydrodynamic layer surrounding the particles of BNZ. This results in an in situ inclusion process and produces a rapid increase in the amount of dissolved drug.29
Although the kneading process is efficient in improving the dis-solution rate for binary systems, as in the case of the BNZ-RMβCD complex, where ≈100% of the drug dissolved within 10 min of testing, the interaction with the drug requires a better method, such as the FD or EV, to obtain similar results for mixtures with SBβCD. These results may be explained by an intrinsic interaction between BNZ and RMβCD at surface level, as demonstrated by SEM (Figure 4), as this facilitates the formation of the complex.
The dissolution rates ranked as follows according to ANOVA: BNZ < PMSBβCD < PMRMβCD = KNSBβCD < KNRMβCD =FD = EV. These results suggest FD and EV should be the recommended
Table 2. Calculated mean values of dissolution efficiency at 15 and 20 min
BNZ PM KN FD EV
RMβCD SBβCD RMβCD SBβCD RMβCD SBβCD RMβCD SBβCD
%DE15min 12.4 (±1.2) 46.9 (±2.6) 28.8 (±3.7) 77.8 (±1.2) 48.7 (±2.1) 74.7 (±2.8) 76.1 (±2.0) 83.4 (±1.3) 75.8 (±1.3)
%DE20min 14.2 (±1.3) 54.4 (±1.9) 37.8 (±3.7) 81.8 (±1.1) 54.2 (±1.9) 81.0 (±1.7) 81.8 (±2.2) 87.6 (±1.8) 81.9 (±1.5)
Figure 3. Scanning electron microphotographs of BNZ; RMbCD; SBbCD; PM; KN, EV and FD systems
Figure 4. Dissolution profiles of BNZ, PM, KN, EV and FD systems with RMbCD and SBbCD, in sink condition. () BNZ, () PM, () KN, () FD, () EV
methods for preparation of inclusion complexes between BNZ and CDs with a higher solubilizing power. The KN method could also be used for BNZ:RMβCD binary mixtures, owing to the high capacity of CD to form inclusion complexes spontaneously.
CONCLUSION
complex with a good dissolution profile could be prepared at a 1:1 molar ratio using EV, FD and KN methods. In view of these results, we believe that complexation effectively enhanced the solubility of BNZ, which may consequently increase its bioavailability and might improve its pharmaceutical potential, providing a more uniform and efficient dissolution profile, minimizing variations during the drug solubilization stage, exposing the organism to lower quantities of the drug and hence lowering its toxicity.
REFERENCES
1. Coura, J. R.; Castro, S. L.; Mem. Inst. Oswaldo Cruz2002, 97, 3. 2. Lamas, M. C.; Villagi, L.; Nocito, I.; Bassani, G.; Leonardi, D.; Pascutti,
F.; Serra, E.; Salomón, C. J.; Int. J. Pharm. 2006, 307, 239. 3. Docampo, R.; Curr. Pharmaceut. Des. 2001, 7, 1157.
4. Morilla, M. J.; Montanari, J. A.; Prieto, M. O.; Lopez, M. O.; Petray, P. B.; Romero, E. L.; Int. J. Pharm. 2004, 278, 311.
5. Silva-Nogueira, S.; Jerley, J.; Pavanelli, W. R.; Gutierrez, F. R. S.; Lima, F. C. A.; Silva, A. B. F.; Silva, S. J.; Franco, W. D.; J. Med. Chem.2008, 51, 4104.
6. Jung, J.; Yoo, S.; Lee, S.; Kim, K.; Yoon, D.; Lee, K.; Int. J. Pharm. 1999, 187, 195.
7. Akkar, A.; Muller, R. H.; Eur. J. Pharm. Biopharm. 2003, 56, 29. 8. Figueiras, A.; Carvalho, R. A.; Ribeiro, L.; Torres-Labandeira, J. J.;
Veiga, F. J. B.; Eur. J. Pharm. Biopharm. 2007, 67, 531.
9. Rodriguez-Tenreiro, C.; Alvarez-Lorenzo, C.; Concheiro, A.; Torres-Labandeira, J. J.; J. Therm. Anal. Calorim.2004, 77, 403.
10. Xavier, C. R.; Silva, A. P. C.; Schwingel, L. C.; Borghetti, G. S.; Koester, L. S.; Mayorga, P.; Teixeira, H. F.; Bassani, V. L.; Lula, I. S.; Sinisterra, R. D.; Quim. Nova 2010, 33, 587.
11. Grillo, R.; Melo, N. F. S.; Fraceto, L. F.; Brito, C. L.; Trossini, G. H. G.; Menezes, C. M. S.; Ferreira, E. I.; Moraes, C. M.; Quim. Nova2008, 31, 290.
12. Fraceto, L. F.; Gonçalves, M. M.; Moraes, C. M.; Araújo, D. R.; Zanella, L.; Paula, E.; Pertinhez, T. A.; Quim. Nova2007, 30,1203.
13. Moraes, C. M.; Abrami, P.; Gonçalves, M. M.; Filho, N. A.; Fernandes, S. A.; Paula, E.; Fraceto, L. F.; Quim. Nova2007, 30, 777.
14. Piel, G.; Pirotte, B.; Delneuville, I.; Neven, P.; Llabres, G.; Delarge, J.; Delattre, L.; J. Pharm. Sci. 1997, 86, 475.
15. Ventura, C. A.; Giannone, I.; Paolino, D.; Pistara, V.; Corsaro, A.; Puglisi, G.; Eur. J. Med. Chem.2005, 40, 624.
16. Soares-Sobrinho, J. L.; Silva, A. L. M.; Grangeiro-Júnior, S.; Medeiros, F. P. M.; Rolim-Neto, P. J.; Rev. Bras. Farm. 2006, 87, 78.
17. Higuchi, T.; Connors, K. A.; Adv. Anal. Chem.1965, 4, 117.
18. FDA; Dissolution Testing of Immediate Release Solid Oral Dosage Forms, Guidance for Industry, Rockville, 1997.
19. The United States Pharmacopeial Convention; USP 31, Rockville, 2008, p. 194-195.
20. Khan, K. A.; Rhodes, C. T.; Pharm.Acta Helv.1972, 47, 594. 21. Mura, P.; Furlanetto, S.; Cirri, M.; Maestrelli, F.; Corti, G.; Pinzauti, S.;
J. Pharm. Biomed. Anal.2005, 37, 987.
22. Jacquet, R.; Elfakir, C.; Lafosse, M.; Rapid Commun. Mass Spectrom. 2005, 19, 3097.
23. Fukuda, M.; Miller, D. A.; Peppas, N. A.; McGinity, J. W.; Int. J. Pharm. 2008, 350, 188.
24. Jun, S. W.; Kim, M. S.; Kim, J. S.; Park, H. J.; Lee, S.; Woo, J. S.; Swang, S. J.; Eur. J. Pham. Biopharm. 2007, 66, 413.
25. Fernandes, C. M.; Vieira, T. M.; Veiga, F. J. B.; Eur. J. Pharm. Sci.2002, 15, 79.
26. Cirri, M.; Rangoni, C.; Maestrelli, F.; Corti, G.; Mura, P.; Drug Dev. Ind. Pharm.2005, 31, 697.
27. Soares-Sobrinho, J. L.; Cunha-Filho, M. S. S.; Rolim-Neto, P. J.; Torres-Labandeira, J. J.; Dacunha-Marinho, B.; Acta Crystallogr. Sect. E: Struct. Rep. Online 2008, E64, 634.
28. Arias, M. J.; Moyano, J. R.; Munoz, P.; Gines, J. M.; Justo, A.; Giordano, F.; Drug Dev. Ind. Pharm.2000, 26, 253.