Nota Técnica
*e-mail: cht17nr_amu @yahoo.com
STUDIES ON THE DEVELOPMENT OF SPECTROPHOTOMETRIC METHOD FOR THE DETERMINATION OF HALOPERIDOL IN PHARMACEUTICAL PREPARATIONS
Nafisur Rahman*, Asma Khatoon and Habibur Rahman
Analytical Chemistry Division, Department of Chemistry, Aligarh Muslim University, Aligarh-202002, Uttar Pradesh, India
Recebido em 26/2/11; aceito em 18/7/11; publicado na web em 19/8/11
A spectrophotometric method based on the formation of ion-pair complex between haloperidol and eriochrome black T (EBT) at pH 1.85 has been described. The formed complex was extracted quantitatively into chloroform and measured at 510 nm. Infra red (IR) studies were performed to confirm the formation of ion-pair complex. Beer’s law was obeyed in the concentration range of 2.0-9.0 µg mL-1 with molar absorptivity of 2.67 × 10⁴ L mol-1 cm-1. The detection limit was found to be 0.18 µg mL-1. Statistical comparison
of the results of the proposed method with those of the reference method shows excellent agreement and indicates no significant difference in accuracy and precision.
Keywords: haloperidol; ion-pair complex; spectrophotometry.
INTRODUCTION
Haloperidol is a typical antipsychotic drug that chemically belon-gs to butyrophenone group. It is chemically known as 4-[4-(4-chlo-rophenyl)-4- hydroxyl-1-piperidyl]-1- (4-fluorophenyl) butan-1-one with molecular weight of 375.86 g mol-1. It occurs as a white to pale
yellow crystals or powder. Haloperidol is commonly used to treat moderate to severe psychiatric conditions including schizophrenia, manic states and medicament-induced psychosis.1,2 It is also used to
treat extreme behavior problems in children and to ease the symp-toms of Tourett’s syndrome. For the treatment of schizophrenia, the required dosage of haloperidol was found to be 5-15 mg per day with an average of 10 mg per day.3 The dosage forms are typically
tablets and injections. However, haloperidol produces extrapyramidal side effects including acute dystonic reactions, acathisia syndrome, drug induced Parkinsonism, bradykinesia and tardive dyskinesia.4
In view of therapeutic importance, it has been planned to develop a sensitive analytical method for assay of haloperidol in pharmaceutical preparations.
Haloperidol has been determined in dosage forms using various analytical techniques such as high performance liquid chromato-graphy,5-7 high performance thin-layer chromatography,8-1019F NMR
spectroscopy,11 square-wave adsorptive stripping voltammetry at a
mercury electrode,12 square-wave and cyclic voltammety at hanging
mercury drop electrode,13 cyclic voltammetry at multi-walled carbon
nanotubes-modified glassy carbon electrode,14 conductometry,15 and
fluorimetry.16 Non aqueous titrimetric,17 and UV spectrophotometric,18
assay procedures have been described in official compendia. Spectrophotometry is still popular because of the inherent sim-plicity, low cost, sensitivity, speed and reliability for determination of drugs in pharmaceutical preparations. The analytical procedures based on spectrophotometry19-21 are still being frequently published
in the literature. Literature survey revealed that few spectrophoto-metric methods have been used to determine haloperidol in phar-maceutical preparations. These methods were based on the reaction with [Cr (NCS) 6]3-, [BiI6]3 and picric acid,15 chloranilic acid,22 and
p-chloranil.23 Haloperidol showed absorption maximum at 245 nm
in methanol - 0.1M HCl mixture (9:1) and hence it was determined in commercial dosage forms by UV spectrophotometry.24 Derivative
spectrophotometric method has also been reported for quantitation of haloperidol in pharmaceutical preparations.25
The aim of the present study was to develop a simple and sensi-tive spectrophotometric method for the determination of haloperidol in pharmaceutical preparations. The proposed method is based on the formation of ion-pair complex between haloperidol and EBT at pH 1.85. The ion- pair complex was extracted quantitatively with chloroform and measured spectrophotometrically at 510 nm. The reaction conditions were optimized and validated as per International Conference on Harmonization (ICH) guidelines.26
EXPERIMENTAL
Apparatus
Spectral runs were made on a Shimadzu UV-visible 1240 spec-trophotometer (Kyoto, Tokyo, Japan). All other spectrophotometric measurements were made on Spectronic 20 D+ spectrophotometer
(Milton Roy Company, USA) using 1 cm matched glass cells. Eutech (Cyber scan pH 2100) pH meter was used to measure the pH. All measurements were performed at 25 ± 1 °C. The IR spectra were recorded on a Perkin- Elmer FTIR 1650 spectrophotometer using KBr pellet technique.
Chemicals and reagents
Haloperidol was purchased from Sigma Chemical Company (St. Louis, MO, USA) and used as received. Commercial tablets of haloperidol such as Trancodol tablet equivalent to 10 mg haloperidol (Intas Laboratories Pvt. Ltd., India) and Senorm tablet equivalent to 10 mg haloperidol (Sun Pharmaceuticals Industries Ltd., India) were purchased from local market. 2.167 × 10⁻³ M EBT (Fluka Chemie
AG, Switzerland, and molecular weight 461.38) solution was freshly prepared in distilled water. Buffer solutions ranging from pH 0.65-5.20 were prepared using appropriate volumes of 1 M sodium acetate and 1 M HCl.
Standard solution
in 10 mL methanol and then diluted to volume with the same solvent to provide a solution of 0.2 mg mL-1.
General procedure
Aliquots of standard solutions of haloperidol (0.2 mg mL-1)
containing 20-90 µg were pipette into a series of 50 mL separating funnels. To each separating funnel, 0.85 mL of 2.167 × 10⁻³ M EBT
was added followed by 2 mL of buffer solution (pH 1.85). The con-tents of the separating funnel were shaken vigorously with 10 mL chloroform for 2 min and then allowed to separate the two layers. The absorbance of the organic layer was measured at 510 nm against the reagent blank prepared simultaneously and the calibration curve was constructed. The amount of the drug in pure form and in samples (pharmaceutical preparations) was calculated from the calibration curve, or from the corresponding regression equation.
Procedure for pharmaceutical preparations
Five tablets (claiming for 10 mg of haloperidol per tablet) were finely powdered and transferred into a small conical flask. Haloperidol was extracted with 2 × 20 mL of methanol by shaking. It was filtered through Whatmann filter paper No.42 into 50 mL volumetric flask to remove excipients. The filtrate was diluted to mark with methanol. The stock solution was diluted to provide a theoretical 0.2 mg mL-1
concentration. The content of haloperidol was determined following the proposed procedure.
Determination of stoichiometry
The molar combining ratio between haloperidol and EBT was evaluated by Job’s method of continuous variations.27 In this
me-thod, solutions of haloperidol and EBT with identical molar con-centrations (2.167 × 10⁻³ M) were mixed in varying volume ratios
(0.1 + 0.9 --- 0.9 + 0.1 mL) in such a way that the total volume of each mixture was the same. To each mixture 2 mL of buffer solution (pH 1.85) was added and then extracted with 10 mL chloroform. The absorbance of the organic layer was measured at 510 nm and plotted against the mole fraction.
RESULTS AND DISCUSSION
EBT is a metallochromic indicator widely used in complexome-tric titrations. Chemically it is sodium 1-(1-hydroxy-2-naphthylazo)-6-nitro-2-naphthol-4-sulphonate (NaH2In). As pointed by
Schwarzen-bach and Biedermann,28 the sulphonic acid group on EBT is a strong
acid and sodium salt of EBT is completely ionized in acid medium (e.g. pH 1.85). The equilibria involved can be expressed as:
pK 6.3 pK 11.5
NaH2In Na+ + H2In- HIn2- In
Wine red Blue Orange Below pH 6, the aqueous solution of EBT exhibited a wine red colour,29 which is due to the presence of
1-(1-hydroxy-2-naphthylazo)-6-nitro-2-naphthol-4-sulphonate anion (H2In-). In the present study,
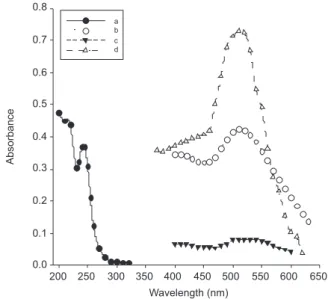
haloperidol was found to react with EBT at pH 1.85, producing an ion-pair complex which was extracted into chloroform. The absorption spectra of haloperidol, EBT at pH 1.85, mixture of haloperidol and EBT at pH 1.85, and ion-pair complex extracted in chloloform are shown in Figure 1. The absorption spectrum of ion pair complex (Figure 1d) shows maximum absorbance at 510 nm. EBT at pH 1.85 could not be extracted into chloroform and thus the reagent blank did not show absorption at 510 nm. The absorption spectrum of EBT at pH 1.85 (in
aqueous phase) exhibits maximum absorption at 510 nm. The ion pair complex extracted in chloroform shows higher absorbance as compa-red to the aqueous phase, indicating that there is no steric hindrance.
The stoichiometric ratio of the reactants was evaluated by Job’s method of continuous variations. The results (Figure 2) indicated 1:1 ratio for haloperidol with EBT. The formation constant (Kf) of the
ion-pair complex was calculated using the equation:
where C— = 1.084 × 10⁻⁴ M, C
D= 1.084 × 10
-4 M, concentration of
ha-loperidol at the point of maximum complex formation, CR = 1.084 ×
Figure 1. Absorption spectra of (a) 2.66 × 10⁻⁵ M haloperidol; (b) 6.50 ×
10-5 M EBT at pH 1.85 against doubly distilled water; (c) 2.66 × 10⁻⁵ M
ha-loperidol + 1.84 × 10⁻⁴ M EBT at pH 1.85 against blank (1.84 × 10⁻⁴ M EBT
at pH 1.85); (d) ion pair complex extracted in 10 mL chloroform (2.66 × 10⁻⁵
M of haloperidol and 1.84 × 10⁻⁴ M EBT at pH 1.85) against reagent blank
(reagent shaken with 10 mL chloroform)
10-4 M; concentration of EBT at the point of maximum complex
formation. Aobs and Aextp are the measured and extrapolated
absor-bances at the point of maximum complex formation. Kf was found
to be 5.66 × 10⁵.
The Gibb’s free energy, ∆G, was also calculated using the
equation:
∆G = – RT ln Kf
and found to be – 31.79 KJ mol-1.
The pKa of haloperidol is 8.3030 which correspond to ionization
of piperidine moiety. Hence at pH 1.85, the nitrogen atom of piperi-dyl group present in its structure is protonated; creating one positive centre. On the other hand, EBT exists as an anion (H2In-) at pH 1.85.
Thus it can be suggested that one mole of haloperidol associates with one mole of EBT, producing ion-pair complex which was quantitati-vely extracted into chloroform.
The IR spectra of haloperidol, EBT and haloperidol-EBT ion-pair complex are shown in Figure 3. In the IR spectrum of haloperidol
ν(C=O), ν(C-F) and ν(C-Cl) bands appeared at 1658, 1226 and 740 cm-1, respectively. The IR spectrum of EBT exhibited band
at 1507 cm-1 which is assigned to N=N stretching vibration. The
stretching vibrations due to –NO2 group were observed at 1571 and
1342 cm-1.The -SO
3 group showed stretching vibrations at 1218 and
1054 cm-1. The IR spectrum of haloperidol-EBT ion pair complex
showed the bands due to stretching vibrations of C=O, C-F, C-Cl, N=N, NO2 and SO3 groups, thus confirming the formation of
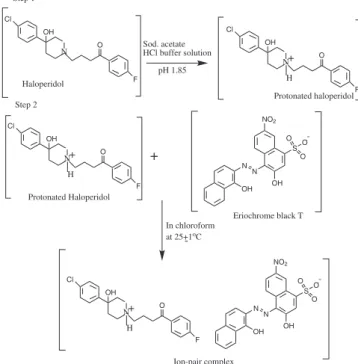
ion-pair complex extractable into chloroform. The formation of ion-ion-pair complex is shown in Scheme 1.
Optimisation of variables
The different variables that affect the formation of ion-pair com-plex were critically studied and optimized. The optimum values of the variables were maintained throughout the determination process.
Effect of temperature
The effect of temperature on the absorbance of the ion pair complex was studied over the range 20-35 °C. It was found that the absorbance of the ion pair complex was constant upto 35 °C. There-fore all measurements were carried out at 25 ± 1 °C.
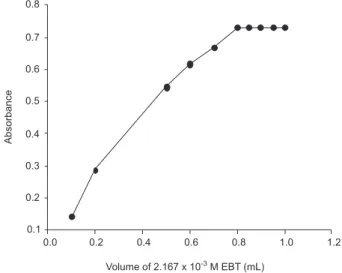
Effect of concentration of EBT
The influence of the concentration of EBT was studied by mea-suring absorbance of the solutions containing the same concentration of haloperidol (9.0 µg mL-1) and varying volumes of 2.167 × 10⁻³ M
EBT. Maximum colour intensity of the complex was obtained with 0.80 mL of EBT solution (Figure 4). Higher volumes of EBT solution had no pronounced effect on ion-pair complex formation. Therefore 0.85 mL of 2.167 × 10⁻³ M EBT solution was chosen as the optimal
value for subsequent measurement.
Effect of pH
The influence of the pH on the formation of the complex was studied by carrying out the reaction in sodium acetate-HCl buffer solution of pH range 0.65-5.20. The results are presented in Figure 5 which indicated that the maximum and constant absorbance was obtained in the pH range of 1.42 - 4.58. The absorbance of the ion pair complex decreases on increasing the pH above 4.58. Therefore, buffer solution of pH 1.85 was chosen for the determination process.
Effect of volume of pH 1.85 buffer solution
The effect of volume of buffer solution (pH 1.85) on absorbance was studied in the range of 0.3-3.0 mL. The maximum absorbance was attained with 1.8 mL and after that the absorbance value remained constant. Therefore 2.0 mL buffer solution (pH 1.85) was adopted as an optimum volume for all measurements.
Figure 3. IR Spectra of (A) haloperidol; (B) EBT and (C) ion-pair complex
Step 1
F O OH Cl
N
Haloperidol
Sod. acetate HCl buffer solution
pH 1.85
F O OH Cl
N
Protonated haloperidol H
+
F O OH Cl
N H
+ +
OH N
N OH NO2
SO O O -
-Protonated Haloperidol
Eriochrome black T
F O OH Cl
N H
+
OH N
N OH NO2
SO O O -
-Ion-pair complex In chloroform
at 25+1oC
-Step 2
Effect of shaking time for extraction
Shaking time ranging from 0.5-3.0 min were tested to ascertain the extraction of the complex. Maximum and constant absorbance value was obtained when extracted after 1.5 min shaking (Figure 6). Therefore, shaking time of 2 min was maintained throughout the experiment.
Effect of extracting solvent
The effect of extracting solvent on the ion-pair complex was stu-died. The organic solvents such as chloroform, carbon tetrachloride, dichloromethane, butanol, isoamyl alcohol and ethyl acetate were examined for extraction of the complex in order to provide efficient extraction procedure. Chloroform was preferred because it provided quantitative extraction of the ion-pair complex from the aqueous solution and gave maximum absorbance of the coloured extract.
Analytical performance
Linearity and range
Under the optimum conditions, the standard calibration curve was constructed by plotting the absorbance at 510 nm as a function of haloperidol concentration. Beer’s law range, molar absorptivity, regression equation, correlation coefficient and limits of detection (LOD) and quantitation (LOQ) were calculated and summarized in Table 1. Beer’s law was obeyed in the concentration range 2.0-9.0 µg mL-1. The high value of correlation coefficient indicates the good
line-arity of the calibration curve. The high molar absorptivity of the ion pair complex indicates the high sensitivity of the method. LOD and LOQ26 values were found to be 0.18 and 0.53 µg mL-1, respectively.
Accuracy and precision
The intra-day precision was evaluated through replicate analysis at 3 concentration levels i.e. 3.0, 6.0, 8.0 µg mL-1 of haloperidol by
performing 5 experiments on the same day using the same analyte standard solution. The inter-day precision was assessed using 5 samples of 3 different concentrations on 5 days over a period of a week. The results are summarized in Table 2. It is evident from the table that intra-day and inter-day relative standard deviation (RSD) and error ranged from 0.51-0.64% and 0.35-0.82%, respectively. It is concluded that the method has good accuracy and precision.
Selectivity
The selectivity of the proposed method was evaluated with regard to possible interference due to tablet excipients such as lactose, sucro-se, magnesium stearate, mannitol and starch. To this end, a mixture of haloperidol with excipients in amounts commonly found in tablets was prepared and analyzed following the proposed procedure. It was observed that the results were not affected by the common excipients.
Robustness
Robustness was examined by evaluating the influence of small variation in the method variables on its analytical performance. In these experiments, one parameter was changed whereas the others were kept unchanged, and the recovery percentage calculated each time. It was found that variation in the volume of 2.167 × 10⁻³M EBT
solution, 0.85 ± 0.05 mL, and volume of pH 1.85 buffer solution, Figure 4. Effect of volume of 2.167 × 10⁻³ M EBT on the absorbance of ion
pair complex
Figure 5. Effect of pH on the absorbance of ion pair complex
Figure 6. Effect of shaking time for extraction of the ion pair complex
Table 1. Analytical characteristics of the proposed method
Parameters Observed value
λmax (nm) 510
Beer’s law limit (µg mL-1) 2.0 - 9.0
Molar absorptivity (L mol-1 cm-1) 2.67 × 10⁴
Intercept, a -0.025
Slope, b 0.073
Correlation coefficient (r) 0.9998
LOD ( µg mL-1) 0.18
2.0 ± 0.2 mL, did not significantly affect the procedure. The proposed method is reliable during normal usage and considered to be robust. Table 3 shows the comparison of the performance of the proposed method with other existing methods for the determination of halope-ridol in pharmaceutical preparations. The existing spectrophotometric methods are tedious15 and time consuming.15,22 The derivative
spectro-photometric method25 has acceptable linear range with higher RSD
values. The HPLC, HPTLC and 19FNMR methods are sensitive with
good linear range. The RSD values for these methods are also higher. In addition, all analytical laboratories cannot afford to keep these instrumentations owing to high cost. In comparison, the proposed method is simple and sensitive employing only a cheaper reagent.
Analysis of dosage forms
Two different brands of tablet samples were analysed by the pro-posed method and a reference method.23 The results were presented in
Table 4. The results obtained by the proposed and reference methods were compared statistically. The student’s t- and F- tests showed that the calculated t- and F-values are less than the theoretical values at 95% confidence level. This indicated good precision and accuracy in the analysis of haloperidol in tablets. Interval hypothesis test31 was also
performed to calculate lower (θ
L) and upper (θu) confidence limits at
95% confidence level based on recovery experiments. It was found that in both cases; θ
L and θu values were within ± 2%; confirming
the compliance of regulatory authority.32
CONCLUSION
The proposed method is rapid, simple, sensitive and accurate which can be used for determination of haloperidol in pharmaceutical
preparations. The method presented is based on the formation of chlo-roform extractable ion-pair complex with EBT. The method makes use of a common and simple reagent which an ordinary analytical laboratory can afford. The extractive spectrophotometric method has the advantage that it allows the separation of haloperidol from other auxiliary substances. In addition, Beer’s law is obeyed in the con-centration range 2.0-9.0 µg mL-1. The main advantage of this method
is low cost of reagent and apparatus used and short analysis time.
ACKNOWLEDGMENTS
The authors are grateful to chairman Department of Chemistry,
Table 2. The inter- and intra-day precision and accuracy data for determination of haloperidol by proposed method
Proposed method Concentration (µg mL
-1 )
Precision RSD (%)
Accuracy
Error (%) SAEc CLd
Taken Founda ± SDb
Interday 3.00 2.98 ± 0.24 0.82 0.76 0.11 0.30
6.00 6.01 ± 0.22 0.37 0.22 0.10 0.28
8.00 7.98 ± 0.28 0.35 -0.30 0.13 0.35
Intraday 3.00 3.01 ± 0.16 0.51 0.32 0.07 0.19
6.00 6.02 ± 0.39 0.64 0.31 0.17 0.48
8.00 7.99 ± 0.46 0.57 -0.10 0.20 0.56
aMean for 5 independent determinations; bSD = standard deviation; cSAE = standard analytical error dCL = confidence limit at 95% confidence level and 4
degrees of freedom (t = 2.776)
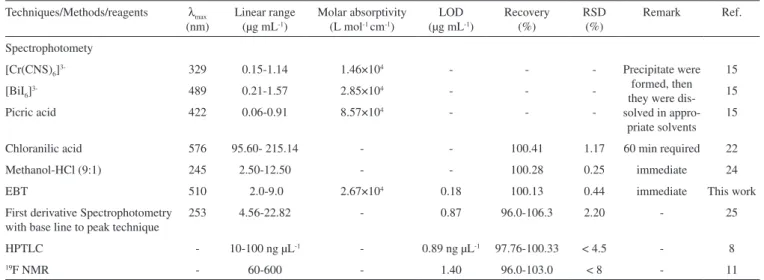
Table 3. Comparison of the proposed method with existing methods for determination of haloperidol
Techniques/Methods/reagents λmax (nm)
Linear range (µg mL-1)
Molar absorptivity (L mol-1 cm-1)
LOD (µg mL-1)
Recovery (%)
RSD (%)
Remark Ref.
Spectrophotomety
[Cr(CNS)6]3- 329 0.15-1.14 1.46×10⁴ - - - Precipitate were
formed, then they were dis-solved in
appro-priate solvents 15
[BiI6]3- 489 0.21-1.57 2.85×10⁴ - - - 15
Picric acid 422 0.06-0.91 8.57×10⁴ - - - 15
Chloranilic acid 576 95.60- 215.14 - - 100.41 1.17 60 min required 22
Methanol-HCl (9:1) 245 2.50-12.50 - - 100.28 0.25 immediate 24
EBT 510 2.0-9.0 2.67×10⁴ 0.18 100.13 0.44 immediate This work
First derivative Spectrophotometry with base line to peak technique
253 4.56-22.82 - 0.87 96.0-106.3 2.20 - 25
HPTLC - 10-100 ng µL-1 - 0.89 ng µL-1 97.76-100.33 < 4.5 - 8
19F NMR - 60-600 - 1.40 96.0-103.0 < 8 - 11
Table 4. Point and interval hypothesis tests: Applicability of the proposed
method in pharmaceutical preparations and its comparison with the reference method at 95% confidence level
Pharmaceutical formulations (labelled amount)
Amount found ± SD (mg) Proposed methoda Reference method
Trancodol-10 (10 mg)
10.01 ± 0.04 F = 1.14
t = 0.02 θLb = 0.99
θUb = 1.01
9.98 ± 0.18
Senorm-10 (10 mg)
10.01 ± 0.02 F = 1.69
t = 0.74 θLb = 0.99
θUb = 1.00
9.99 ± 0.31
aAverage of 5 determinations; bA bias, based on recovery experiments, of ± 2%
Aligarh Muslim University for providing research facilities. One of the authors (A. Khatoon) is grateful to Aligarh Muslim University for providing Non Net UGC fellowship to carry out this work.
REFERENCES
1. Gilbert, M. M.; Curr. Ther. Res. 1969, 11, 520.
2. Hollister, L. E.; Basic and Clinical Pharmacology, 6th ed., Prentice-Hall:
London, 1995, p. 432.
3. Singh, O. P.; Chakraborty, I.; Dasgupta, A.; Datta, S. A.; Indian J. Psychiatry 2008,50, 171.
4. Cesario, V.; Recent Prog. Med.2008, 99, 146.
5. Wate, S. P.; Bosker, A. A.; Int. J. ChemTech. Res. 2009, 1, 675. 6. Ali, I.; Aboul-Enien, H. Y.; J. Liq. Chromatogr. Relat. Technol. 2005, 28,
3169.
7. Petkovska, R.; Dimitrovska, A.; Acta Pharm.2008, 58, 243.
8. Mennickent, S.; Pino, L.; Vega, M.;Godoy, C. G.; De-Diego, M.; J. Sep. Sci.2007, 30, 772.
9. Mennickent, S.; Pino, L.; Vega, M.;Diego, M.; J. Sep. Sci.2008, 31, 201. 10. Maslanka, A.; Krzek, J.; J. AOAC Int. 2005, 88, 70.
11. Shamsipur, M.; Shafiee-Dastgerdi, L.; Telebpour, Z.; Haghgoo, S.; J. Pharm. Biomed. Anal.2007, 43, 1116.
12. El- Desoky, H. S.; Ghoneim, M. M.; J. Pharm. Biomed. Anal. 2005, 38, 543.
13. Ribeiro, F. W. P.; Soares, J. E. S.; Becker, H.; De-Souza, D.; de Lima-Neto, P.; Correia, A. N.; Electrochim. Acta 2011, 56, 2036.
14. Huang, F.; Peng, Y.; Jin, G.; Zhang, S.; Kong, J.; Sensors2008, 8, 1879. 15. Kurzawa, M.; Kowalezyk-Marzec, A.; Szlyk, E.; Chem. Anal.2004, 49,
91.
16. Rahman, N.; Siddiqui, S.; Drug Test. Anal.2010, 2, 252.
17. European Pharmacopoeia; Council of Europe: Strasbourg, 2002, p. 1288.
18. Chinese Pharmacopoeia; Chinese Pharmacopoeia Commission, Chemi-cal Industry Press: Beijing, 2005, p. 469.
19. Nagaraja, P.; Shrestha, A. K.; Shivakumar, A.; Al-Tayar, N. G. S.; Gowda, A. K.; Quim. Nova 2011, 34, 373.
20. Rufino, J. L.; Weinert, P. L.; Pezza, H. R.; Pezza, L.; Quim. Nova2009, 32, 1764.
21. Önal, A.; Quim. Nova2011, 34, 677.
22. Attama, A. A.; Nnamani, P. O.; Adikwu, M. U.; Akidi, F. O.; Chem. Pharm. Bull.2004, 52, 303.
23. Shingbal, D. M.; Joshi, S. V.; Indian Drugs 1985, 22, 326. 24. Wate, S. P.; Borkar, A. A.; Indian J. Pharm. Sci.2010, 72, 265. 25. Stolarczyk, M.; Apola, A.; Krzek, J.; Sajdak, A.; Acta Pol. Pharm.2009,
66, 351.
26. International Conference on Harmonisation of Technical Requirements for Registration of Pharmaceuticals for Human Use; ICH Harmonized Tripartite Guideline, Validation of Analytical Procedures: Text and Methodology, Q2(R 1), Complementary Guideline on Methodology dated 06 November 1996, incorporated in November 2005, London. 27. Skoog, D. A.; West, D. M.; Holler, F. J.; Crouch, S. R.; Fundamentals of
Analytical Chemistry, 8th ed., Thomson and Brooks: California, 2004.
28. Schwarzenbach, G.; Biedermann, W.; Helv. Chim. Acta1948,31, 678. 29. Welcher, W. J.; The Analytical use of Ethylenediamine Tetraacetic Acid,
1st ed., D. van Nostrand Company, Inc.: New York, 1958.
30. Al Omari, M. M.; Zughul, M. B.; Devies, J. E. D.; Badwan, A. A.; J. Solution Chem. 2009, 38, 669.
31. Hartman, C.; Smeyers-Verbeke, J.; Pinninckx, W.; Heyden, Y. V.; Vankeerberghen, P.; Massart, D. L.; Anal. Chem. 1995, 67, 4491. 32. Canada Health Protection Branch, Ministry of National Health and