Printed in Brazil - ©2006 Sociedade Brasileira de Química 0103 - 5053 $6.00+0.00
Article
* e-mail: [email protected]
Preparation and Characterization of Electrodeposited Iron + Cobalt Thin Films
from a Chloride Bath
Adriana N. Correia,* Regina C. B. de Oliveira and Pedro de Lima-Neto
Departamento de Química Analítica e Físico-Química, Universidade Federal do Ceará, Bloco 940, Campus do Pici, 60455-970, Fortaleza – CE, Brazil
Ligas Fe-Co foram depositadas e dissolvidas em solução contendo íons metálicos e em solução de NH4Cl. Resultados voltamétricos sugerem interação entre os componentes da liga, originando
uma solução sólida. Perfis de ALSV apresentam diferenciação para o processo de dissolução dos metais individuais e das ligas, com comportamento semelhante ao observado para cobalto e/ou ferro, com deslocamento de potencial para valores mais positivos à medida que aumenta o teor de cobalto no banho. A análise adimensional dos transientes potenciostáticos para cobalto, ferro e Fe-Co 1:1 e 1:10 indica processo de nucleação progressiva; já Fe-Fe-Co 1:5 segue a curva teórica para nucleação instantânea. A caracterização química e física dos eletrodepósitos mostra dependência entre a morfologia superficial e a composição do banho eletrolítico. Além disto, análises por EDX sugerem que a composição química dos eletrodepósitos foi sempre correspondente à composição do banho eletrolítico. Desta forma, é possível classificar estes processos como deposição regular.
Fe-Co alloys were deposited and dissolved in the solution containing metallic ions and in the NH4Cl solution. Voltammetric results suggest interaction between the alloy components, constituting a solid solution. ALSV profiles show a differentiation for the dissolution process of the individual metals and alloys, with potentials displacement in the dissolution processes for more and more positive values, as the proportion of cobalt increases in the bath. The non-dimensional analyses of the potentiostatic transients for the cobalt, iron and Fe-Co 1:1 and 1:10 suggest a progressive nucleation. However, Fe-Co 1:5 allowed instantaneous nucleation. The chemical and physical characterization of the electrodeposits showed dependence between the surface morphology and the composition of the electrolytic bath. Besides, EDX analyses showed that the composition of the electrodeposits were always corresponding the chemical composition of the electrolytic bath. In this way, it was possible to classify these processes as regular deposition.
Keywords: electrodeposition, anodic dissolution, Fe-Co thin films
Introduction
The electrodeposition of alloys is a process much more complex than the electrodeposition of pure metals and several binary alloys systems have been investigated
and reviewed.1-12 Moreover, only few alloys systems have
been industrially applied because an adequate control of these complex processes is naturally required in order obtaining a correct understanding of mechanisms. Electrodeposited alloys have potential applications for magnetic shielding, memory devices for computers and recording tapes, for corrosion protection and for electrocatalysis.
Nowadays, the determination of alloy phase structure has been carried out using electrochemical techniques, such as galvanostatic and potentiostatic techniques, and,
in most cases, anodic linear sweep voltammetry.13
Literature on the electrodeposition of alloys of the iron group metals (Ni, Fe, Co and Zn), is rather extensive,
comprising several papers.14-18 These alloys have many
useful properties such as high internal strength, hardness, high corrosion resistance and unusual magnetic properties. Many magnetic alloys with different compositions are widely employed for various purposes.
Ferromagnetic alloys, e.g., Fe-Co and Fe-Ni have
received considerable attention for their practical applicability in modern industries, such as rocketry,
computers, space technology, etc.6,14-16,18-23 Myung and
alloys were an order of magnitude lower than Fe-Ni and Co-Ni. On the other hand, the same authors determined the substantial increase in corrosion resistance by addition of Ni to Fe-Co deposits and the slight effect on
this parameter with addition of B. Lallemand et al.20
observed that the codeposition of cobalt and iron leads to a reduction of the reaction rate of the more noble component and an increase of the reaction rate of the less noble component even if organic additives are adsorbed on the electrode surface, and affecting the
polarization curves of single metals.23
Based on attractive soft magnetic properties and large magnetic inductions, Fe-Co alloys exhibit the
largest magnetic induction of any material.24-26 At high
temperatures, such as 998 K, metallurgical alloys near the equiatomic composition undergo changes in
structure from α-bcc to α´-CsCl-type structure. This
ordering influences intrinsic magnetic properties
slightly. Mattoso et al.19 compared the binary phase
diagram for electrodeposited Fe-Co alloys at room temperature to the equilibrium phase diagram of bulk Fe-Co. They observed relatively large deviations between both phase diagrams, especially the absence of the equilibrium bcc + fcc mixed phase around 80%. The absence of CsCl ordering around 50% in the electrodeposited diagram is also observed.
Bento and Mascaro16 verified that the iron deposition
occurs at more negative potentials than cobalt deposition because cobalt is a nobler metal and established that Fe-Co alloys in 1:1 and 10:1 ratios exhibited an instantaneous nucleation mechanism.
The presence of organic additives containing the sulfonamide group seems to be responsible for the best anti-corrosion properties of the Fe-Co deposit whereas the presence of carbonyl one seems to interfere on material
composition.20
Kim et al.21 studied the electrodeposited Fe-Co from chloride and sulfate baths and suggested that the current efficiencies from chloride bath were significantly higher than that from sulfate one. High current efficiencies,
around 52%, was independent of Fe2+ concentration in
chloride baths, but decreased to level of 18% in sulfate baths. These results can be justified by the fact of the chlorine to have catalytic effect through the formation of an ion bridge between the electrode and the metal ion being discharged. Magnetic saturation of Fe-Co electrodeposits was independent of anions types and increased with increasing deposit iron content. However, no effects of anion types on the phases and surface morphology in Fe-Co electrodeposits were observed.
The aim of this paper is to prepare and to characterize Fe-Co thin films obtained from chloride bath on vitreous carbon. The binary Fe-Co alloys were deposited and dissolved by a cathodic and anodic linear sweep potential in the solution containing ions of both
metals and in the NH4Cl solution, respectively. Another
procedure used here was based on potentiostatic transients of current where the dependence between current and experiment time for the formation and growth of a new metallic phase at a constant negative potential is recorded, followed by dissolution of the electrodeposited alloy by anodic linear sweep
voltammetry in the NH4Cl solution.
Experimental
Chemicals used here were FeCl3, CoCl2, NaCl and
NH4Cl (Synth and Fluka). All solutions were freshly
prepared with water treated by a Millipore Milli-Q system. The Fe-Co alloy ratios investigated were 1:1,
1:5 and 1:10, where Fe3+ concentration was maintained
constant at 0.05 mol dm-3 and Co2+ concentration varied
between 0.05 mol dm-3 and 0.5 mol dm-3. A 1.0 mol
dm-3 solution was used for NaCl and NH
4Cl. All
experiments were performed at room temperature (r.t., around 25 °C).
The electrochemical experiments were carried out in a
conventional three-electrode cell (Pyrex® glass). The working
electrode (Ageom = 0.20 cm2) was a vitreous carbon rod (CTA,
Brazil) sealed in a Pyrex® tub embedded in an epoxy resin.
Vitreous carbon surface was polished before each experiment
on emery paper of grade 600 (3M). A platinum plate (Ageom
= 0.35 cm2) and a saturated calomel electrode were used as
a counter and a reference electrode, respectively.
Electrochemical experiments were controlled with a potentiostat PGSTAT30 (Autolab), under a computerized control. The surface morphology of the electrodeposits was examined with a XL-30 (PHILIPS) scanning electron microscope. The qualitative and semi-quantitative chemical analyses of the alloys were performed by energy dispersive X-rays (EDX) in a model QX 2000 (Link Analytical) linked to SEM apparatus.
All voltammetric experiments were performed at 5 mV
s-1, scanning at first to negative direction. Only the first
Results and Discussion
There is no redox reaction on the support electrolyte, NaCl, at the working electrode surface in the potential region where the electroactive species were deposited/ dissolved.
Voltammetric measurements
Figure 1 shows the cyclic voltammograms obtained for the vitreous carbon electrode in three different
electrolytes containing 0.15 mol dm-3 NaCl (blank
solution, without electroactive species), 0.05 mol dm-3
FeCl3 + 1.0 mol dm-3 NaCl and 0.05 mol dm-3 CoCl
2 +
1.0 mol dm-3 NaCl. The scan potential rate was 5 mV
s-1. In addition to the redox couple at about -0.4 V,
probably due to native quinone groups on the glassy carbon surface, known to be electrocatalytically active, the voltammograms obtained show the presence of cathodic and anodic processes inherent to deposition and dissolution of metals. In this figure it can observed in the cathodic scan that the cobalt deposition occurs prior to iron deposition, exhibiting a well-defined reduction process at -0.88 V. This fact is not observed for iron, mainly due to simultaneous hydrogen evolution. In the anodic scan, there is one dissolution process for each system (maximum for Fe is at -0.51 V and for Co is at -0.34 V). The codeposition of the iron-group metals is characterized by the anomalous process. The standard equilibrium potentials of the cobalt and iron are, respectively, -0.28 V and -0.04 V (in function of SHE). Thus, from thermodynamic considerations, it would be expected that the deposition sequence would be cobalt then iron. In spite of the kinetics of the electrodeposition for individual metals establishes that the rates follow
the standard equilibrium potentials, in this work there is an inversion with cobalt being deposited preferentially. Due to differences in deposition and dissolution potentials, a crossover occurs between the cathodic and anodic branches, being a diagnostic for the nuclei formation on the electrode.
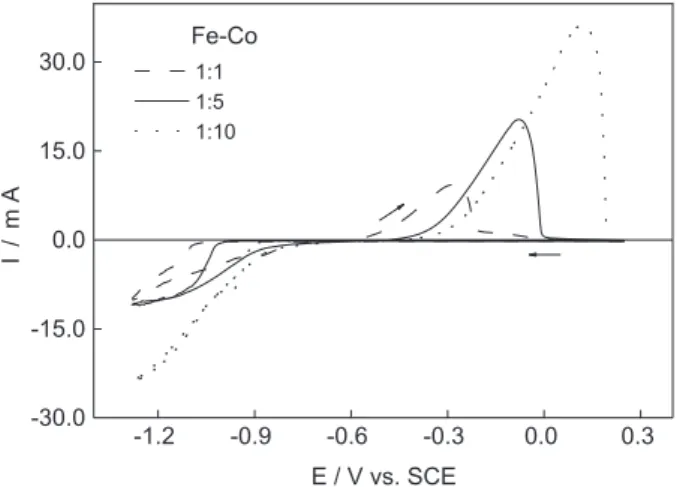
In order to evaluate the influence of cobalt concentration at the Fe-Co alloys formation, Figure 2 presents the voltammetric results for 1:1, 1:5 and 1:10 Fe:Co ratios. It can be observed that there is a positive shift in the peak potential, about 400 mV, in the dissolution processes as the amount of cobalt increases in the bath composition. This is an indication that the alloys with high cobalt content are nobler, since dissolution occurs at more positive potentials. The observed change in the maximum current can be due to a change in the loaded layer. The total concentration of the metal ions in solution increases from 0.10 mol
dm-3 to 0.55 mol dm-3 as the cobalt concentration
increases. Thus, the amount of electrodeposited material is changed for higher values. From Faraday’s law, the variation of thickness in function of the cobalt content was calculated and the values obtained were:
0.57 μm for Fe-Co 1:1, 0.78 μm for Fe-Co 1:5 and 1.56
μm for Fe-Co 1:10.
The voltammetric profile for iron commenced and terminated at -0.25 V, while for cobalt and Fe-Co alloys this value is equal to 0.25 V. In all the cases -1.28 V is the inversion potential. There was not significant current produced initially, until potentials of -1.10 V for iron, -1.06 V for Fe-Co 1:1, -1.00 V for Fe-Co 1:5, -0.88 V for Fe-Co 1:10 and -0.80 V for cobalt were reached. At these values, the cathodic current begins to increase until to form the reduction processes.
Figure 2. Cyclic voltammograms for electrodeposition and
electrodissolution of Fe-Co 1:1 (dashed line), Fe-Co 1:5 (solid line) and Fe-Co 1:10 (dotted line) on vitreous carbon electrode in 1.0 mol dm-3 NaCl bath at 5 mV s-1. Lower limit of potential sweep is -1.28 V.
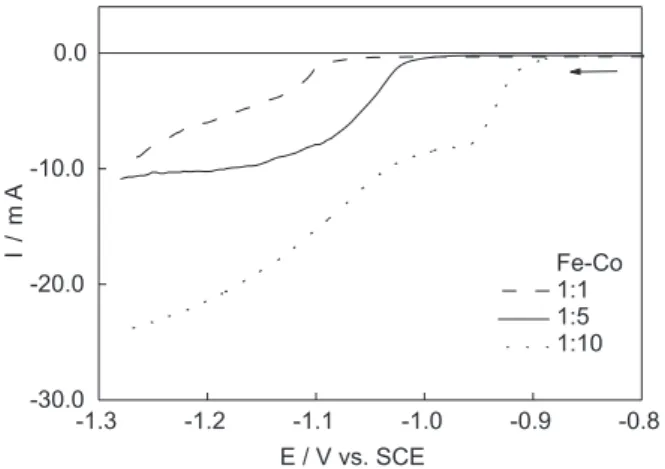
By enlarging the deposition region for alloy systems, as showed in Figure 3, it can be seen that the presence of cobalt ions influences the beginning of the reduction process. The reduction potentials are shifted towards more positive values when the cobalt content is higher.
Chronoamperometric measurements
Chronoamperometry was used to study the electro-crystallization process of Fe, Co and their alloys. Based on the voltammetric experiments it was possible to define a suitable potential range to promote potentiostatic deposition. Figure 4 presents the family of current-time transients and the potential jumps were performed from -0.5 V to more negative potential values indicated in the caption of this figure. The experimental profiles show typical nucleation and growth features, although they are roughly different. The ascendant part of current-time transients increases until it reaches a maximum (no well-defined in some cases) when diffusion becomes the rate-limiting process.
We further assume that the process of electro-crystallization occurs by the model of three-dimensional nucleation and growth and that the clusters of the new phase have a hemispherical shape. The small amplitude cathodic polarization will continue the process of surface renewal and further improve the reproducibility of the measurements. Unlike the experiments in which a large number of nuclei are formed shortly after the beginning of the transient, for these potentiostatic steps an “induction time” is observed. The induction time is a direct consequence of the need of clusters of ad-atoms to grow to a critical size required for the onset of the Figure 3. Zoomed details at the beginning of the electrodeposition pro-cess of Fe-Co 1:1 (dashed line), Fe-Co 1:5 (solid line) and Fe-Co 1:10 (dotted line) on vitreous carbon electrode in 1.0 mol dm-3 NaCl bath at 5 mV s-1. Lower limit is -1.28 V.
new phase, being inversely dependent of the applied potential step.
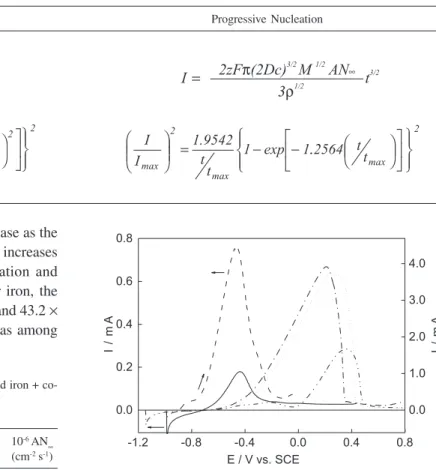
Analyses of experimental data were realized and the best fitting obtained was based on 3D diffusion-controlled nucleation and growth mechanism developed by
Scharifker and Hills.27 The basic equations described in
this model are displayed in Table 1.
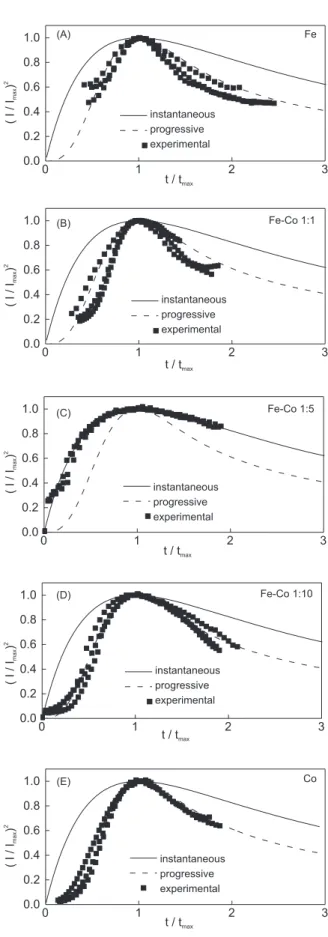
Figure 5 displays the normalized coordinates of experimental current-time transients with the corres-ponding theoretical curves for instantaneous and progressive 3D nucleation and growth controlled by diffusion. It can be seen, for all studied deposition potentials, that Fe, Fe-Co 1:1, Fe-Co 1:10 and Co show good agreement with theoretical curves for progressive process, while Fe-Co 1:5 results were fitted with theoretical curves for instantaneous process. Since the hydrogen reduction reaction can be considered as a possible influence at the systems, some explanations have
to be sought in order to justify this change. (i): in spite
of the surface of vitreous carbon electrode inhibits hydrogen evolution reaction at highly negative potentials, an electroactive site can serve as catalytic centre for this
reaction; (ii) a result like this can be explained by
determining the phase composition and structure of the
film. According to Mattoso et al.,19 it can be considered
by X-rays diffraction studies for Fe1-x-Cox
electro-deposited alloys that there is only one peak attributed to the body-centered cubic (bcc) structure up to x = 85%, some vestiges of a transition region with bcc and fcc
structure at x = 87.5% and that the spectrum of Fe10Co90
shows two peaks indicating a pure face-centered cubic phase. Beyond the catalytic effects, we can assume that the Fe-Co 1:5 alloy presented this change in the mechanism based on the existence of this transition region.
As the experimental values for i2
m ax tmax stayed
approximately constant for the iron (4.66 × 10⁻⁴ < i2
m ax tmax
< 5.31 x 10⁻⁴) and cobalt (1.38
× 10-3 < i2
m ax tmax <1.55 ×
10-3) electrodeposition, the diffusion coefficients can be
calculated by the equation:27
i2
m ax tmax= 0.2598(zFc) 2 D
In this way, the obtained values were 6.8 x 10⁻⁶ cm2
s-1 for iron and 5.2 x 10⁻⁶ cm2 s-1 for cobalt. These values
are according values reported in literature for iron, i.e.,
between 9 × 10⁻⁶ and 5 × 10⁻⁵ cm2 s-1, and for cobalt, i.e.,
1.8 × 10⁻⁵ cm2 s-1.28-30
With these values and through the equation showed in Table 1, it was possible to determinate the rate of nuclei formation for nucleation and growth processes, showed
in Table 2. As expected, the values of AN
∞ increase as the
potential values became more negative, once it increases the amount of available energy for the nucleation and growth processes of a new metallic phase. For iron, the values of AN
∞ varied among 23.3 × 10
6 cm-2 s-1 and 43.2
×
106 cm-2 s-1. Already for cobalt this variation was among
8.7 × 106 cm-2 s-1 and 17.1 × 106 cm-2 s-1.
Potentiodynamic stripping measurements
Anodic linear sweep voltammetry (ALSV) was used to characterize the iron + cobalt thin films, supported by morphological observations and by composition determination. Initially, the electrodeposits were acquired
in chloride medium containing Fe3+ and/or Co2+ in the
established ratios at different step potentials (between -0.858 V and -1.250 V) during current-time transients.
Potentiodynamic stripping in 0.5 mol dm-3 NH
4Cl electrolyte was used to analyze the electrodeposits. This procedure allowed a comparison between the dissolution processes of the individual metals and its alloys in the
presence (vide Figures 1 and 2) and in the absence of the
electroactive species. The initial potentials employed were similar to the step potentials and the final potentials were always equal to 0.8 V.
For all metal ion ratios in working solution the potentiodynamic stripping voltammograms, showed in
Figure 6, revealed a well-defined oxidation process at more positive potentials than those detected for iron and cobalt. It can be observed that the Fe-Co alloys present dissolution processes at more and more positive potentials as the cobalt content is reduced in the electrodeposition bath. As can be seen, this process with only a single peak suggests the dissolution of the solid solution, indicating the existence of a single phase with the more noble metal being reprecipitated on the spot. Also, by Faraday’s law, the variation of thickness in function of the cobalt content
was calculated and the values obtained were: 0.08 μm for
Fe-Co 1:1, 0.25 μm for Fe-Co 1:5 and 0.24 μm for Fe-Co
1:10. Table 2. Preparation and characterization of electrodeposited iron +
co-balt thin films from a chloride bath
System tmax -Estep 103 i max 10
4 i2
maxtmax 10 -6 AN
∞
(s) (V) (A cm-2) (A2 cm-4 s) (cm-2 s-1)
Cobalt 20.4 0.858 4.7 4.5 8.7
16.8 0.859 5.4 4.9 12.8
14.4 0.860 6.0 5.2 17.1
Iron 6.3 1.244 15.0 14.2 23.3
5.6 1.246 16.4 15.1 34.8
4.5 1.250 17.2 13.3 43.2
Table 3. Preparation and characterization of electrodeposited iron + co-balt thin films from a chloride bath
System Theoretical Experimental
% Fe % Co % Fe % Co
Pure Fe 100.0 0 100.0 0
Fe-Co 1:1 50.0 50.0 30.8 ± 12.3 69.2 ± 12.5 Fe-Co 1:5 16.7 83.3 15.6 ± 1.7 84.4 ± 1.2 Fe-Co 1:10 9.1 90.9 9.9 ± 0.9 90.1 ± 0.9
Pure Co 0 100.0 0 100.0
Table 1. Preparation and characterization of electrodeposited iron + cobalt thin films from a chloride bath
Instantaneous Nucleation Progressive Nucleation
Characterization of the deposits
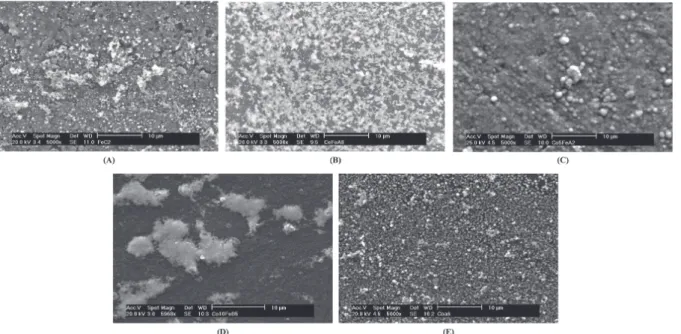
Finally, the characterization of electrodeposits obtained under these experimental conditions was performed using scanning electron microscope and energy dispersive X-rays analyses aiming the observation of the morphological aspects of these thin metallic films. The results are illustrated in the Figure 7 and in the Table 3. The obtained images suggest the formation of crystals with different morphologies in function of the composition of the electrodeposits. By the EDX analyses it was possible to observe that the metallic content in the electrodeposits is directly related with the bath composition. In this way, when there is an increase of the cobalt content in the bath, the percentage of cobalt in the electrodeposits increases in the same ratio, making possible the classification of the electrodeposition processes studied here as regular.
Conclusions
Voltammetric results suggest interaction among the alloy components, constituting a solid solution. ALSV profiles show a differentiation for the dissolution process of the individual metals and alloys when dissolved in
NH4Cl. Alloys dissolved in complexing bath present
similar behavior to cobalt and/or iron, with potentials displacement in the dissolution processes for more and more positive values, as the proportion of cobalt increases in the bath.
The non-dimensional analyses of the potentiostatic transients for the cobalt, iron and Fe-Co 1:1 and 10:1 deposition suggest a process of nucleation progressive. However, Fe-Co 5:1 allowed instantaneous nucleation. The absence of two current maxima when the supplied
energy was enough for the Co2+ and Fe3+
electro-deposition indicates the formation of a solid solution in all the alloy ratios Fe-Co studied here. As expected, the values of AN
∞ and N increased as the overpotential values
became more negative, once it increases the amount of available energy for the nucleation and growth processes of a new metallic phase.
The physical characterization of the electrodeposits showed dependence between the surface morphology and the composition of the electrolytic bath. Besides, EDX analyses showed that the composition of the electrodeposits were always corresponding the composition of the electrolytic bath. In this way, it was possible to classify these processes as regular.
Acknowledgments
The authors are indebted to the CNPq, CAPES and FINEP. R.C.B. de Oliveira thanks to PIBIC-CNPq for the scholarship.
References
1. Jovic, V. D.; Tosic, N.; J. Electroanal. Chem.1998, 441, 69. 2. Armyanov, S.; Electrochim. Acta2000, 45, 3323.
3. Correia, A. N.; Machado, S. A. S.; Electrochim. Acta2000, 45, 1733.
4. Müller, C.; Sarret, M.; Benballa, M.; Electrochim. Acta2001,
46, 2811.
5. Bajat, J. B.; Miskovic-Stankovic, V. B.; Maksimovic, M. D.; Drazic, D. M.; Zec, S.; Electrochim. Acta2002, 47, 4101. 6. Mohaidat, Q. I.; Al-Omari, I. A.; Mahmood, S. H.; Physica B
2002, 321, 149.
7. Cavallotti, P. L.; Vicenzo, A.; Bestetti, M.; Franz, S.; Surf. Coat. Technol.2003, 169-170, 76.
8. Gómez, E.; Pellicer, E.; Vallés, E.; J. Electroanal. Chem.2003,
556, 137.
9. Gómez, E.; Kipervaser, Z. G.; Vallés, E.; J. Electroanal. Chem.
2003, 557, 9.
10. Correia, A. N.; Machado, S. A. S.; J. Appl. Electrochem.2003,
33, 367.
11. Marinho, F. A.; Santana, F. S. M.; Vasconcelos, A. L. S.; Santana, R. A. C.; Prasad, S.; J. Braz. Chem. Soc.2002, 13, 522. 12. Prasad, S.; Marinho, F. A.; Santana, F. S. M.; Braz. J. Chem.
Eng.2000, 17, 423.
13. Despic, A. R.; Jovic, V. D. In Modern Aspects of Electrochemistry; White, R. E.; Bockris, J. O´M.; Conway, B. E., eds.; Plenum Press: New York, 1995, vol. 27, p.143. 14. Djokic, S. S.; Maksimovic, M. D. In Modern Aspects of
Electrochemistry; White, R. E.; Bockris, J. O’M.; Conway, B. E., eds.; Plenum Press: New York, 1992, vol. 22, p.417. 15. Ricq, L.; Lallemand, F.; Gigandet, M. P.; Pagetti, J.; Surf. Coat.
Technol.2001, 138, 278.
16. Bento, F. R.; Mascaro, L. H.; J. Braz. Chem. Soc.2002, 13, 502.
17. Jartych, E.; Jalochowski, M.; Budzynski, M.; Appl. Surf. Sci.
2002, 193, 210.
18. Myung, N. V.; Nobe, K.; J. Electrochem. Soc.2001, 148, C136. 19. Mattoso, N.; Fernandes, V.; Abate, M.; Schreiner, W. H.; Mosca,
D. H.; Electrochem. Solid-State Lett.2001, 4, C20.
20. Lallemand, F.; Ricq, L.; Berçot, P.; Pagetti, J.; Electrochim.
Acta2002, 47, 4149.
21. Kim, D.; Park, D-Y.; Yoo, B. Y.; Sumodjo, P. T. A.; Myung, N. V.; Electrochim. Acta2003, 48, 819.
22. Bai, A.; Hu, C-C.; Electrochem. Commun.2003, 5, 78. 23. Lallemand, F.; Ricq, L.; Wery, M.; Berçot, P.; Pagetti, J.; Appl.
Surf. Sci.2004, 228, 326.
24. Turgut, Z.; Huang, M.-Q; Gallagher, K.; McHenry, M. E.; Majetich, S. A.; J. Appl. Phys.1997, 81, 4039.
25. Cohen, N. S.; Pankhurst, Q. A.; Barquín, L. F.; J. Phys.: Condens. Matter1999, 11, 8839.
26. Yu, R. H.; Basu, S.; Ren, L.; Zhang, Y.; Parvizi-Majidi, A.; Unruh, K. M.; Xiao, J. Q.; IEEE Trans. Magn.2000, 36, 3388. 27. Scharifker, B.; Hills, G.; Electrochim. Acta1983, 28, 879. 28. Weber, J.; Samec, Z.; Marecek, V.; J. Electroanal. Chem.1978,
89, 271.
29. Langmaier, J.; Trojanek, A.; Weber, J.; Samec, Z.; J.
Electroanal. Chem.1999, 469, 11.
30. Soto, A. B.; Arce, E. M.; Palomar-Pardavé, M.; González, I.;
Electrochim. Acta1996, 41, 2647.
Received: May 9, 2005